The association between gas and galaxies I: CFHT spectroscopy and pair analysis
Abstract
We investigate the relative distribution of the gaseous contents of the Universe (as traced by a sample of Lyman (Ly- ) absorbers), and the luminous baryonic matter (as traced by a redshift survey of galaxies in the same volume searched for Ly- absorbers), along 16 lines-of-sight (LOS) between redshifts 0 and 1. Our galaxy redshift survey was made with the Multi-Object Spectrograph (MOS) on Canada-France-Hawaii Telescope (CFHT) and, when combined with galaxies from the literature in the same LOS, gives us a galaxy sample of 636 objects. By combining this with an absorption line sample of 406 absorbing systems drawn from published works, we are able to study the relationship between gas and galaxies over the latter half of the age of the Universe. A correlation between absorbers and galaxies is detected out to separation of 1.5 Mpc. This correlation is weaker than the galaxy-galaxy correlation. There is also some evidence that the absorbing systems seen in CIV are more closely related to galaxies, although this correlation could be with column density rather than metallicity. The above results are all consistent with the absorbing gas and the galaxies co-existing in dark matter filaments and knots as predicted by current models where the column density of the absorbing gas is correlated with the underlying matter density.
keywords:
galaxies – intergalactic medium, galaxies – quasars: absorption lines, galaxies – galaxies: haloes.1 Introduction
This paper is part of our efforts to provide constraints and measurements of the relationship between the distribution of the gaseous contents of the Universe as traced by neutral Hydrogen and the luminous baryonic mater as traced by galaxies.
The manner in which gas collapses gravitationally into dark matter potential wells to form stars (and hence galaxies), and the way in which these stars then affect the gas is a topic of great interest at present. This is being pursued both observationally and theoretically at redshifts from 7 to zero (i.e. when the universe was approximately 5% of its current age, to the present day). In this paper we investigate this process observationally during the second half of the evolution of the universe.
There is a continuing debate about the relationship between low redshift Lyman (Ly-) absorbers and galaxies, where here ‘low redshift’ is taken to mean redshifts less than 1. A simplified (strawman) version of the two sides is (a) that all low redshift Ly- absorbers are part of physically-distinct luminous-galaxy halos, or (b) that they are all part of the filamentary structure seen in recent SPH/Mesh structure formation models, and are only related to galaxies by the fact that both are following the underlying dark matter distribution. In practice, almost all authors acknowledge that the universe includes a mix of the above two populations (and indeed others), and the debate is more about which population dominates a particular set of observations.
Both of these positions have been vigorously defended in the literature. The reference list below includes all relevant papers listed on the ADS abstract server from the time of the first available high quality UV spectroscopy from HST to 15 August 2005.
Papers supporting (a) include (in chronological order): Mo (1994); Lanzetta et al. (1995); Lanzetta et al. (1996); Barcons et al. (1998); Linder (1998); Chen et al. (1998); Ortiz-Gil et al. (1999); Linder (2000); Chen et al. (2001); Chen et al. (2001); Steidel et al. (2002); Charlton et al. (2003); Zonak et al. (2004); Stocke et al. (2004); Bouché et al. (2004); Dahlem (2005); Tumlinson et al. (2005); Keeney et al. (2005); Masiero et al. (2005) and Jenkins et al. (2005).
Papers supporting (b) include (in chronological order): Morris et al. (1991); Morris et al. (1993); Morris & van den Bergh (1994); Mo & Morris (1994); Weymann et al. (1995); Dinshaw et al. (1995); Stocke et al. (1995); Shull et al. (1996); Bahcall et al. (1996); Rauch et al. (1996); Le Brun et al. (1996); Bowen et al. (1996); van Gorkom et al. (1996); Dinshaw et al. (1997); Jannuzi et al. (1998); Grogin & Geller (1998); Weymann et al. (1998); Tripp et al. (1998); vanden Berk et al. (1999); Impey et al. (1999); Penton et al. (2000); Penton et al. (2000); Penton et al. (2002); Tripp et al. (2002); Tripp et al. (2002); McLin et al. (2002); Manning (2002); McLin et al. (2002); Bowen et al. (2002); Rosenberg et al. (2003); Manning (2003); Penton et al. (2004); Bregman et al. (2004); Sembach et al. (2004); Côté et al. (2005); Danforth & Shull (2005) and Chen et al. (2005).
Finally to complete the reference list, some of the theoretical papers from the last ten years which are relevant for this debate are: Hernquist et al. (1996); Zhang et al. (1997); Cen et al. (1998); Theuns et al. (1998); Davé et al. (1999); Cen & Ostriker (1999); Davé & Tripp (2001); Schaye (2001); McDonald et al. (2002); Scannapieco et al. (2002); Viel et al. (2002); Theuns et al. (2002); McDonald et al. (2002); Nagamine et al. (2004a); Nagamine et al. (2004b); Fujita et al. (2004); Aguirre et al. (2005); Tumlinson & Fang (2005); Scannapieco (2005); Furlanetto et al. (2005); Viel et al. (2005) and Jena et al. (2005).
Regardless of whether either hypothesis is correct, we emphasize that even if one (naively) believes a clear answer can be obtained (either (a) or (b) above), this answer will be a function of the neutral Hydrogen column density of the absorbers. For N cm-2, one is probing a column density of material comparable to that of the disk of our galaxy, and hence all galaxies, to varying degrees, should be expected to contribute to the population of such absorbers. At column densities N cm-2, one is getting close to the neutral hydrogen content of the expected fluctuations within voids, and we expect that a more heterogeneous set of causes could produce such absorption.
The increasingly sophisticated models of galaxy formation and evolution now available (see references above) suggest that if we could make a perfect census of the gaseous and luminous constituents of a large volume of the low redshift Universe, we would find that both the gas (quasar absorption line systems) and stars (galaxies) trace the same fundamental structures (whose course of formation and distribution was set by the early perturbations of the distribution of dark matter in the Universe). These same models, however, also indicate that a wide range of detailed relationships between the gas and galaxies should be observed. The details of the structures will depend on an equally wide range of interesting astrophysics, including the process of star formation and “galaxy feedback” and we hope that the approach of this paper can lead to a better understanding of this astrophysics.
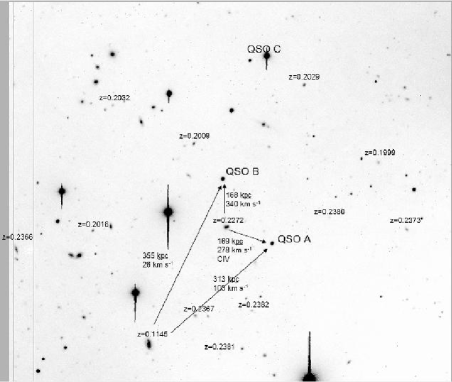
Observationally comparing the distribution of galaxies and quasar absorption line systems shows some of the complexity of the phenomena at work. This can be illustrated by considering Figure 1. In this figure we show an image of the lines-of-sight (LOS) towards the QSOs LBQS 0107-025A and B. As discussed later in the paper, for this field we have samples of galaxies and Ly- absorption line systems whose locations in this common volume of space can be compared. In the figure we have selectively labelled illustrative cases of ‘associated’ galaxies and absorption lines. For two of the galaxies labelled with a redshift, arrows indicate where there is a detected absorption line in both of the QSO spectra. For those absorber-galaxy pairs, the projected spatial separation and velocity difference between the galaxy and the absorber are also provided.
We consider a few of these cases below:
-
1.
A bright, multi-component object lies between the two QSOs at a redshift of 0.2272. There is absorbing gas seen at nearly this same redshift in both QSO LOS, and in one of them, CIV absorption is also detected. This then could potentially be interpreted as a straightforward case of a large gaseous halo around a bright galaxy. The complex morphology of the galaxy could indicate an ongoing merger.
-
2.
At a distance of 350 kpc to the south and east of the two QSO LOS is another bright morphologically-complex galaxy at a redshift of 0.1145. This galaxy is also close in velocity to absorption seen in both LOS. It is instructive though to compare the small visible extent of the stars in the (large) galaxy with the distance to the two QSO LOS. Smooth, undisturbed gaseous halos of this size seem improbable, although it is one of the goals of this paper to investigate this statistically.
-
3.
Generally to the north of the two QSOs are a collection of 5 galaxies marked with redshifts near 0.20. All 5 of these galaxies are within 500 km s-1 (and also within a projected distance of 500 kpc) of an absorber seen in the LOS to LBQS 0107-025B. No absorption is detected in the other QSO LOS. This collection illustrates the common difficulty of picking out one individual galaxy to tie to one absorber. Although there is indeed a single ‘closest’ galaxy, it seems rather arbitrary to claim that it is the sole cause of any absorption.
-
4.
Finally, a collection of six galaxies, all within 500 km s-1 of each other at a redshift around 0.24 are marked surrounding the LOS to LBQS 0107-025A. Despite their proximity to the LOS, and the case above where a group of galaxies can be associated with an absorber, no absorption is seen at this redshift in either of the two QSO LOS. While one could speculate that low column density absorbers might be fragile entities that are destroyed in a dense environment, there is no good independent evidence at present that this galaxy ‘group’ has crossed such a threshold.
These examples demonstrate the great variety of appearances the underlying relationship between the absorbers and galaxies presents, along even one LOS. This richness should be kept in mind when interpreting the results derived from the ensemble of data we consider in this paper.
2 Data
Our observational program would ideally be designed to allow a statistical comparison between the absorption gas detected in Hubble Space Telescope (HST) UV spectroscopy between redshifts of 0 and 1 and the galaxies within a cylindrical region at least 3 Mpc111Throughout we assume H0=70 km s-1 Mpc-1, =0.3 and =0.7. Impact parameters are reported in physical rather than comoving coordinates. in radial extent away from the QSO Line of Sight (LOS). In practice, what we achieved was an absorption line sample taken from the HST Quasar Absorption Line Survey (Bahcall et al. 1993, 1996; Jannuzi et al. 1998), an HST Key Project during cycles 1-4, with varying redshift coverage, and galaxy samples from a variety of observatories. The main one reported here was obtained using the Multi-Object Spectrograph (MOS) at the Canada-France-Hawaii Telescope (CFHT). Some additional galaxy redshifts have been obtained using the COSMIC spectrograph at Palomar, and gleaned from the literature. We are in the process of supplementing this data set with additional observations using other facilities. Although we do not claim that any of these galaxy samples are ‘complete’, we have endeavoured to ensure that they all come with known selection functions, allowing a statistical analysis to be performed. Completeness in this context would be rather an illusory concept, as there will always be weaker lines and less luminous or lower surface brightness galaxies that are missed by any survey. This point has been made by many authors including Linder (1998, 2000) and Rosenberg et al. (2003).
2.1 Sample definition
The fields observed with MOS on the CFHT were chosen to include Key Project QSOs (Jannuzi et al. 1998) with QSO redshift greater than 0.5 and Faint Object Spectrograph (FOS) higher dispersion spectroscopy covering from redshift 0.34 to 1 (i.e., FOS gratings G190H and G270H). While UV spectroscopy down to z=0 is obviously desirable (and has been obtained with the HST along a limited number of sight lines) the KP LOS including coverage to z=0 (observations made with the FOS G130H grating) are of QSOs with redshifts too low for efficient CFHT MOS followup. In Table 1 we list the QSOs selected. The columns include the QSO RA, Dec, redshift and V band magnitude, followed by the date of the HST UV spectroscopy for the 3 FOS gratings used in this paper, followed by the number of CFHT MOS masks observed (see § 2.4) and the date of the MOS observation.
There is one additional field observed as part of the CFHT MOS sample which was not part of the HST Key Project. HST UV spectra of the QSO pair LBQS 0107-025A and LBQS 0107-025B were studied by Dinshaw et al. (1995), Dinshaw et al. (1997) and Young et al. (2001). This LOS was included in the CFHT MOS target list because of the presence of two QSOs bright enough for reasonable S/N HST UV spectroscopy within the MOS field of view. An analysis taking full advantage of this will be performed in a later paper, but for the present paper we generally use them as two ‘separate’ LOS. We have checked whether removing one of the LBQS 0107-025 QSOs from the sample makes any significant difference to our numerical results or conclusions, and have found that it does not.
| OBJECT | R.A.(J2000) | Decl.(J2000) | z | V | G190H | G270H | G160L | Masks | Date |
|---|---|---|---|---|---|---|---|---|---|
| NAB 0024+22… | 00 27 15.4 | +22 41 59 | 1.118 | 16.6 | 07/22/92 | 07/22/92 | 05/11/91 | 1 | Jul-95 |
| LBQS 0107-025A | 01 10 13.1 | -02 19 52 | 0.960 | 17.9 | 02/05/97 | 12/26/96 | 1 | Jul-95 | |
| LBQS 0107-025B | 01 10 16.2 | -02 18 50 | 0.956 | 17.3 | 02/12/94 | 12/26/96 | 1 | Jul-95 | |
| PKS 0122-00… | 01 25 28.9 | -00 05 57 | 1.07 | 16.7 | 11/09/91 | 09/11/91 | 2 | Nov-97 | |
| 3C 57… | 02 01 57.2 | -11 32 34 | 0.67 | 16.4 | 11/01/95 | 11/01/95 | 1 | Nov-97 | |
| 3C 110… | 04 17 16.7 | -05 53 46 | 0.773 | 15.9 | 03/16/95 | 03/16/95 | 3 | Nov-97 | |
| NGC 2841 UB3… | 09 19 57.7 | +51 06 10 | 0.553 | 16.5 | 03/04/92 | 03/04/92 | 03/04/92 | 2 | Nov-97 |
| 0959+68W1… | 10 03 06.8 | +68 13 18 | 0.773 | 15.9 | 11/12/92 | 11/12/92 | 11/12/92 | 1 | Nov-97 |
| 4C 41.21… | 10 10 27.5 | +41 32 39 | 0.613 | 16.9 | 09/12/92 | 10/12/92 | 10/12/92 | 2 | Nov-97 |
| 3C 334.0… | 16 20 21.8 | +17 36 24 | 0.555 | 16.4 | 03/04/92 | 03/04/92 | 03/04/92 | 2 | Jul-95 |
| PG 1718+481… | 17 19 38.3 | +48 04 12 | 1.084 | 14.7 | 05/13/93 | 05/13/93 | 1 | Jul-95 | |
| PKS 2145+06… | 21 48 05.5 | +06 57 39 | 0.99 | 16.5 | 10/22/91 | 10/22/91 | 3 | Jul-95 | |
| 3C 454.3… | 22 53 57.8 | +16 08 53 | 0.859 | 16.1 | 11/15/91 | 11/15/91 | 11/15/91 | 2 | Jul-95 |
| PG 2302+029… | 23 04 45.0 | +03 11 46 | 1.052 | 15.8 | 05/10/94 | 02/08/94 | 2 | Nov-97 | |
| PKS 2340-036… | 23 42 56.6 | -03 22 27 | 0.896 | 16.0 | 10/28/91 | 01/18/93 | 01/18/93 | 2 | Nov-97 |
| PKS 2344+09… | 23 46 36.9 | +09 30 46 | 0.677 | 16.0 | 07/10/92 | 07/10/92 | 07/10/92 | 2 | Nov-97 |
2.2 HST Quasar Absorption Line Sample
The complete list of selection criteria for the KP quasars is discussed in section 2.1 of Jannuzi et al. (1998). We review here only the criteria used by the KP that might produce a bias for our study. First is their practical decision to select targets with bright V-band magnitudes and well determined redshifts in order for their targets to have predictable UV luminosities that, in the absence of high column density absorption systems along the LOS, would enable a high signal-to-noise ratio UV spectrum to be obtained in a modest exposure time with HST. A sample biased toward objects bright in V-band apparent magnitude might be more inclined to include lensed quasars, i.e. objects with a foreground over-density along the LOS. In practice, the redshifts of the quasars included in the KP are low, and therefore less likely to be lensed. Second, a subset of the quasars included in the KP sample were not randomly selected, but were chosen for a GTO program of J. Bahcall because they were behind foreground objects whose absorption properties were to be investigated. These include AGN like Markarian 205 (with the galaxy NGC 4319 very close to the LOS to Mkn 205, producing absorption in the spectrum of the background AGN; Weedman (1970); Bahcall et al. (1992)) and 3C 232 (with the galaxy NGC 3067 in the foreground). Of the objects we selected from the KP catalogues for observation with CFHT, only NAB 002422 was not a randomly selected target by the KP. This quasar was part of the GTO program of Bahcall and was selected because it was discovered as part of a search for quasars with LOS near a cluster of galaxies (Bahcall et al. 1973). Abell 31, with a redshift of 0.160, is along the LOS to this quasar. The cluster redshift is smaller than the range we investigate along this LOS.
We had two additional criteria for selecting our sample for the CFHT observations. The fields needed to be observable during our scheduled CFHT observing runs. We chose to focus on LOS with quasars with redshifts greater than 0.5, in order to maximize the efficiency of our redshift galaxy survey.
With the previously mentioned exception of LBQS 0107025A and B, the sample of absorption lines we use is drawn from the KP catalogue papers, Bahcall et al. (1993), Bahcall et al. (1996), and Jannuzi et al. (1998). The KP Ly- absorption line catalogue was constructed to include all features with a significance level greater than 4.5 (as defined and discussed by Schneider et al. (1993)). This corresponds to a variable equivalent width limit along each LOS. Plots showing these equivalent width limits as a function of wavelength are given in Figure 2 of Jannuzi et al. (1998). With the modest spectral resolution of the FOS (R=1300; approximately 230 km s-1), the Ly- absorption features were generally unresolved and conversion from the observed equivalent width to column density in neutral hydrogen must be done with some assumption about the Doppler-b parameter for the lines. For the subset of lines that were broader than the instrumental profile, their width probably indicates the blending of multiple absorption features, and not a line profile that can be fit to deduce the column density of the absorber. We note that approximately 10% of the detected Key Project Ly- absorbers were in fact resolved, and, as noted by Jannuzi et al. (1998), are a sign of possible clustering of absorbers on these velocity scales. This results in an additional contribution to the uncertainty in the derived column densities.
For LBQS 0107025A and B we have chosen to use the line lists from Young et al. (2001), supplemented with lines from the GHRS observations of Dinshaw et al. (1997). (In detail this meant adopting the lines from Table 5 of Dinshaw et al. (1997), and Tables 3 and 5 of Young et al. (2001) for LBQS 0107025A, and from Table 5 of Dinshaw et al. (1997), and Tables 4 and 6 of Young et al. (2001) for LBQS 0107025B.) We shifted the wavelengths of the Dinshaw et al. (1997) by -1.72Å as recommended by Young et al. (2001).
We want the subset of absorbers caused by intervening, rather than associated, absorption systems. We follow Weymann et al. (1998) and exclude any line from our sample with a difference of less than 3,000 km s-1 from the systemic velocity of the quasar. Note that while this is a traditional choice of velocity range for excluding associated systems, it will not exclude all associated systems. In particular, one of our quasars, PG 2302029, includes at least one associated system with an ejection velocity of over 50,000 km s-1(Jannuzi et al. (1996); Sabra et al. (2003); Jannuzi et al. 2006, in preparation). We have excluded the broad system at from the sample used in this paper.
All of the line lists we use have complete identifications with the exception of the spectrum of PG1718481. The effects of the incomplete identification of the PG1718481 absorbers are discussed in § 3.4, where it is shown they are negligable.
2.2.1 Comments on Individual Lines of Sight
Detailed notes about the HST FOS spectra along the individual LOS we are studying, and the resulting absorption line lists, are included in the KP catalogue papers and in Young et al. (2001)(for the LBQS 0107025 LOS). Here we comment on the special properties of a few of the fields.
As previously mentioned, NAB 002422 was discovered during a search for quasars near or behind clusters of galaxies (Bahcall et al. 1973). Abell 31, with a redshift of 0.160, is foreground to the redshift range covered by the FOS spectroscopy (0.2950 to 1.0998). Intervening absorption line systems including absorption by CIV are at , 0.4830, 0.8196, and 1.1102. The SNR of the KP spectrum of this quasar is not as high as the typically observed object, resulting in a smaller sample of detected absorbers given the relatively long redshift path observed ().
Bergeron & Boisse (1991) reported an emission line galaxy at z=0.791 in the LOS to PKS 214506, which was later identified as being associated with an extensive metal line systems in the FOS UV spectrum obtained by the KP (Bergeron et al. 1994). This system is high enough column density to produce a Lyman limit system starting at 1633Å , preventing the observation of Ly- absorption along this LOS below z0.3.
2.3 Imaging
To compare the distribution of the galaxies along the same LOS that the FOS spectroscopy maps the gas distribution requires knowledge of the positions and redshifts of galaxies in the fields of our quasar sample. Images of the quasar fields can provide the positions and magnitudes of the galaxies. The spectroscopy that allows the determination of the galaxy redshifts requires the imaging catalogue as input for the design of multi-slit masks.
For the CFHT MOS, the images used to generate the multi-slit mask designs are obtained during the same observing block as the spectroscopy (i.e., the instrument has not been removed from the telescope between the imaging and spectroscopy observations). Therefore we obtained images for our fields during our two observing runs. The images were reduced shortly after they were obtained and catalogues of galaxies generated to guide the design of the multi-slit masks. After the observing runs were completed, the images were re-reduced, the photometry and astrometry of the images calibrated, and final catalogues were constructed. Since the main purpose of the scheduled observing time was to perform the spectroscopy, only band images deep enough to detect the galaxies we wished to target for spectroscopy were obtained. It would be desirable to obtain images including additional band-passes and with enough photometric standard observations to improve the accuracy of our photometry.
In the following subsections we describe the imaging observations, the astrometric and photometric calibration of the images, and the measurement of the galaxy positions and band magnitudes in the fields of our targeted quasars.
2.3.1 Observing
We had two observing runs with CFHT MOS (July 29 - August 1, 1995 UT and November 29 - December 3, 1997 UT). The date each field was imaged is listed in Table 2. The instrument and telescope properties were significantly different during the two runs and we will describe the particulars by run.
During the 1995 observing run, the 29th of July UT was photometric and 600 second band exposures were obtained of six quasar fields. Two and 10 second exposures of the photometric standard stars in the field of NGC 7790 Odewahn et al. (1992) were also obtained to allow a photometric zero-point to be determined for the images. Unfortunately, the proper baffles were left off of the telescope when MOS was installed on the telescope prior to our run. As a result, bright arcs of light, produced by stars outside of the FOV, cut across the images and effectively increased the sky level over approximately one third of the FOV of the images. The amount and distribution of the scattered light was, naturally, pointing dependent. The mixture of sharp and diffuse features in the scattered light made it difficult to completely remove during the processing of the images. This complicated the determination of the sky background around objects, and the subsequent generation of the galaxy catalogues necessary for the construction of the multi-slit masks. The two most strongly affected images were those of LBQS 0107025AB and PG 1718481. To increase the area that could be mapped for galaxies, we obtained two additional images of each field, each offset in position from the others, and combined the images of each field after masking the regions with the worst scattered light in each of the exposures. The combined images allowed us to produce improved measurements of the galaxies in these fields, but there are still regions in each image where we would not be able to detect galaxies and objects whose measured properties were strongly affected by scattered light. The imaging on 30 and 31 July 1995 UT was not done under photometric conditions, so the flux zero-point for the combined image was set to match the imaging on the 29th. The CCD in MOS during this run was the Loral-3 with pixels of approximately 0.313″ in size and a gain of 1.9 electrons per ADU.
During the 1997 observing run, the 29th of November UT was photometric and 600 second exposures of four quasar fields were obtained. Two and 10 second exposures of the photometric standard stars in the field of NGC 7790 were also obtained. The correct baffles were on the telescope. The nights of UT 26 Nov, 30 Nov, and 1 Dec, during which 600 second exposures of 5 additional quasar fields were obtained, were not photometric. For two of the fields taken during these nights, two 600 exposures were obtained to compensate. The CCD in MOS during this run was the STIS-2 with pixels of approximately 0.44″ in size and a gain of 4.52 electrons per ADU.
| Object | UT Date | DIQ | Comment |
|---|---|---|---|
| ″ | |||
| NAB 0024+22… | 29 Jul 95 | 1.75 | |
| LBQS 0107-025AB | 29 Jul 95 | 1.10 | |
| 30 Jul 95 | 0.80 | 2 exposures | |
| PKS 0122-00… | 29 Nov 97 | 0.99 | |
| 3C 57… | 30 Nov 97 | 0.85 | |
| 3C 110… | 29 Nov 97 | 1.22 | |
| NGC 2841 UB3… | 26 Nov 97 | 1.23 | 2 exposures |
| 0959+68W1… | 29 Nov 97 | 0.95 | |
| 4C 41.21… | 1 Dec 97 | 1.14 | |
| 3C 334.0… | 29 Jul 95 | 1.15 | |
| PG 1718+481… | 29 Jul 95 | 0.68 | |
| 31 Jul 95 | 0.59 | 2 exposures | |
| PKS 2145+06… | 29 Jul 95 | 0.66 | |
| 3C 454.3… | 29 Jul 95 | 0.88 | |
| PG 2302+029… | 29 Nov 97 | 0.80 | |
| PKS 2340-036… | 30 Nov 97 | 1.17 | |
| PKS 2344+09… | 26 Nov 97 | 1.01 | 2 exposures |
2.3.2 Reductions
The images were reduced and analysed twice. During the observing run a basic reduction was performed with IRAF222IRAF, the Image Reduction and Analysis Facility, is a general purpose software system for the reduction and analysis of astronomical data. It was written and supported by programmers in the Data Products Program of the National Optical Astronomy Observatory, which is operated by the Association of Universities for Research in Astronomy, Inc., under cooperative agreement with the National Science Foundation. (bias subtraction and flat fielding). FOCAS (Valdes 1989) was used to generate a catalogue that could be used for the identification of galaxies and the generation of the multi-slit masks. Following the observing runs, the images were processed in a more relaxed manner, astrometric and photometric calibrations were determined, and measurements of the object positions and magnitudes completed. In the following subsections we describe this second round of reductions, which yielded the measurements presented in this paper.
The final processing of all of the images was performed using ccdproc and other tasks distributed with v2.12 of IRAF. Bias subtraction and flat fielding were the main processing steps. While only single exposures were obtained for most fields, effort was made to identify saturated pixels and defects caused by cosmic rays, scattered light, satellite trails, etc., and to map the locations of affected pixels in a bad pixel mask for each image. These masks were used during the generation of the catalogues, described below, to flag objects whose properties could not be well measured.
2.3.3 Astrometry
In order to generate relatively accurate positions for the galaxies whose properties are presented in the electronic Tables 3-18, we needed to determine for each of the images an accurate world coordinate system. This was generated using software in IRAF (tasks ccsetwcs and msccmatch in the mscred package; as described by Valdes (2002)) and the USNO A2.0 catalogue of the positions of objects in each of the fields (Monet et al. 1998). A limited magnitude range was used of USNOA2.0 reference stars in order to avoid the documented relative offset in astrometry for this catalog as a function of magnitude. Using the IRAF task msccmatch (in v4.7 of the mscred package), a fourth order mapping between the images in x,y pixel coordinates to RA and DEC of the reference stars was determined. The RMS residuals of the fit were 0.3 to 0.4′′ for each of the images. At the time these solutions were determined, the USNO A2.0 was the best catalogue available. Although catalogues with improved positions are now available (e.g. USNO-B1.0, Monet et al. (2003) or GSC2.2 333The Guide Star Catalogue-II is a joint project of the Space Telescope Science Institute and the Osservatorio Astronomico di Torino. Space Telescope Science Institute is operated by the Association of Universities for Research in Astronomy, for the National Aeronautics and Space Administration under contract NAS5-26555. The participation of the Osservatorio Astronomico di Torino is supported by the Italian Council for Research in Astronomy. Additional support is provided by European Southern Observatory, Space Telescope European Coordinating Facility, the International GEMINI project and the European Space Agency Astrophysics Division.), a trial new solution using the USNO-B1.0 did not result in a significantly improved solution, so we have retained our original fits. The residuals to our solutions were largest around the border of the images and we suspect that the uncertainties in the positions of objects around the edge of each field should probably include an additional 0.1 to 0.2′′ of systematic error. Our measured positions of objects given in this paper are in the ICRF and J2000.
2.3.4 Photometry and Catalogue Generation
We did not obtain multiple standard star observations nor observe in a range of colours that would allow us to determine our own extinction solutions and colour terms. This fundamentally limits the accuracy we can obtain in our photometry. However, our needs in the current study only require photometry accurate to a few tenths of a magnitude. Using a representative Mauna Kea extinction curve determined from photometric observations during other runs and our observations of the stars in NGC 7790, which have been calibrated in the band by Odewahn et al. (1992), we were able to determine zero points for the 10 fields imaged during our photometric nights.
There were five fields observed only on non-photometric nights. We have determined an approximate zero-point for these images as follows. First, for the 10 fields we calibrated with our measurements of NGC 7790, we compared our measured magnitudes to the red magnitudes of the GSC2.2 for objects in common. The pass-bands, of course, are not the same, and we would not expect the magnitudes to be identical, but we were gratified that all of the fields observed under what we believe to have been photometric conditions yielded similar offsets (mean offset of 0.1 of a magnitude) and RMS residuals (0.15 to 0.25). We then assigned to each of the five fields (all from the 1997 run) observed on non-photometric nights a zero-point based on the calibration determined from the photometric night of that run. We then compared these five fields to the GSC2.0. Two of the fields, 3C 57 and PKS 2340036, had mean differences in the same range as those fields observed under photometric conditions. Three of the fields; NGC 2841 UB3, 4C 41.21, and PKS 234409; had significantly larger initial offsets (0.43, 0.47, and 0.62 magnitudes). The RMS residuals, however, were similar to those of all the other fields. We therefore adjusted the zero-points for these fields so that their mean offset when compared to the GSC2.0 stars would also be 0.1 of a magnitude. This adjustment is consistent with what is evident from inspecting the images (and number counts), namely that these exposures taken with some clouds did not reach the same depth (in the same exposure time) as our other exposures. A systematic uncertainty of 0.2 mags should probably be assigned to our reported magnitudes for observed galaxies, but we feel we have successfully placed our observations on a common relative photometric scale.
Using our magnitude zero-points for each image and measurements of the variance in the sky brightness of each image, we have confirmed that the five sigma detection thresholds for point sources in all of our images is a magnitude of 24.9 or greater, well below our selection of targets for spectroscopic follow-up.
For each field the object catalogues were generated using SExtractor 2.2.2 (Bertin & Arnouts 1996) run with the minimum detection area, Gaussian convolution filter, and signal above sky threshold optimized to detect and measure all of the objects for which spectroscopic data was obtained. We measured eight fixed aperture magnitudes (starting at 2′′ and increasing to 10′′ in diameter) and the SExtractor MAG_BEST, which is similar to the Kron total magnitude (Kron 1980). Results for our spectroscopically observed galaxies are included in the electronic Tables 3-18.
As previously discussed, for some of our fields scattered light affected our images. Even without these problems, any catalog will suffer increasing incompleteness for galaxies of fainter total magnitude and/or surface brightness. As a test of the completeness of our imaging catalogs, artificial galaxies were inserted into each image (using the IRAF artdata task) and SExtractor used to attempt to recover the objects. While not a perfect measure of the robustness of our catalogs, the 50% completeness limit of our catalogs for each quasar field is typically 24.4 (band) and greater than 24.0 for all fields. The fields most seriously affected by the arcs of scattered light could be missing even bright galaxies at the 5% level, but visual inspection indicates that the fraction is likely to be much smaller.
2.3.5 Bounded Restframe -band Magnitude
We would like to have well measured luminosities for each of the galaxies expressed in a common rest-frame band. Unfortunately, we do not have well measured colours or spectrophotometry that would allow an accurate determination of the over-all spectral energy distributions (SEDs) of the galaxies in our sample. This prevents the assignment of the proper correction for each galaxy in our sample.
We can, however, constrain the range of rest frame band luminosities possible for each galaxy using our band measurements, the redshifts determined from our spectroscopy, and the galaxy SED templates and corrections of Coleman et al. (1980). For each galaxy we determined the range of possible corrections and intrinsic colours and tabulated the resultant maximum and minimum rest-frame band magnitudes. These are listed for each galaxy in the electronic Tables 3-18. We assumed no evolution or intrinsic extinction. While more involved procedures might, with other data sets, provide probability distributions for the rest band luminosities of each galaxy, the procedure described above allows us to make the gross comparisons between sub-samples that are reasonable given the other uncertainties in our measurements. In other words, those galaxies that might be the intrinsically more luminous are separable from those that could not. The observed redshifts and band magnitudes are the dominant constraints.
2.4 MOS Spectroscopy
2.4.1 Observing
The majority of the galaxy redshifts described in this paper were obtained using the CFHT Multi-Object Spectrograph (MOS), (Le Fevre et al. 1994), during observing runs in July 1995 and November 1997. As described above, imaging catalogs were prepared in real time, from which masks were designed. For July 1995 the Loral 3 CCD was used along with the O300 grism, yielding roughly 3.5Å per pixel. No wavelength blocking filter was used, yielding a wavelength coverage that varied depending on the location of the slit within the field of view, but reasonable signal-to-noise (S/N) was generally obtained for wavelengths between 5000 Å and 9000 Å. For the November 1997 run, the STIS 2 CCD was used with the same grating, yielding a dispersion of 5.2Å per pixel. for both runs, masks were designed with a 1.5″ slit width, corresponding to 4.8 pixels in July 1995 and 3.4 pixels in November 1997. Some of the observations were taken through cloud. A flux standard star was observed in order to allow an approximate flux calibration of the data and to allow us to remove the instrumental signature, but because of the above mentioned cloud, the fluxes recorded could be low.
Spectroscopic multi-slit masks were designed using the galaxy catalogs generated during the observing run. Slits were assigned to galaxies with a magnitude ranking. Slits had a default length of 10″ and width of 1.5″. After this, the assignment algorithm checked whether it was possible to add further objects by sliding slits sideways by a limited amount. Finally all slits were expanded in length to fill the array and allow better sky subtraction for some objects. Depending on the galaxy surface density and distribution in the field between 40 and 47 galaxies had slits assigned to them per mask in this manner. Between one and three masks per LOS were taken.
Because of the varying conditions mentioned above, the redshift success rate for objects which were assigned slits varies from mask to mask. The average success rate was 0.5, with a nadir of 0.07 for a mask taken through thick cloud, and a pinnacle of 0.89 for one particularly good mask.
It was never our intent to obtain a sample complete to any given magnitude, but merely to obtain a statistically useful sample of the galaxies around the LOS. By comparing with the photometric catalog, we can reconstruct our completeness for each field as a function of magnitude, as will be discussed below.
2.4.2 Reduction
The spectroscopic data reduction using IRAF followed the standard procedure for MOS spectroscopy used for example in the CNOC2 project (Yee et al. 2000). The data were bias subtracted and trimmed. If necessary, bad columns were interpolated over. Repeat exposures of the same mask were combined and cosmic rays removed. Because the spectral extraction involves summing over several columns, flat fielding to correct for pixel-to-pixel variations in CCD sensitivity was not necessary (and would have added noise). Individual apertures were then summed to generate 1D spectra, simultaneously subtracting the sky using adjacent regions along the slit. These spectra were wavelength calibrated using arc spectra obtained at the same position on the sky (to minimize the effects of flexure), and the spectra were approximately flux calibrated using observations of a standard star taken through the same slit width.
2.4.3 Redshift Determination
The driving goal for the redshift measurements was to obtain redshifts that could all be placed in the same reference frame, in our case heliocentric. To do this, all the galaxy redshifts determined in different ways were tied together in the same reference frame, and then this frame was tied to that of the absorption line lists, which were adjusted to the heliocentric velocity frame as described by Jannuzi et al. 1998.
All galaxies were cross correlated with two absorption line templates using the IRAF XCSAO task. One template was the ‘fabtemp97’ one which comes with the XCSAO package, and the other was a high-quality wide-wavelength coverage spectrum of the early-type galaxy NGC 4889, kindly provided by B. Oke (private communication, template available on request from S. Morris). As usual, the cross correlation process involved continuum fitting and also filtering of high and low Fourier components. Redshifts for emission line objects were obtained more interactively using the IRAF RVIDLINES task inside the RV package. The results of these routines were then checked by eye, and each measurement flagged as successful or failed. This somewhat subjective procedure was necessary in order to deal with the combined effects of zero order contamination, poor sky subtraction, residual cosmic rays and other reduction problems. In practice, for the cross correlation measurements, there was a fairly clear threshold in R-value reported by the routine above which between measurement were judged successful. Despite all of the above, it is still of course possible for some objects in our redshift catalog to have ‘catastrophic’ redshift errors (i.e. redshifts based on spurious features of mis-identified features). We believe that the above procedure should have minimized the number of such errors, and would be surprised if there were more than a handful these in the redshift catalog, but it should be noted that the redshift errors do not take account of this possibility.
Both the above routines automatically convert redshifts to a heliocentric frame. Nevertheless, as is well known, this does not mean that there are no systematic shifts in velocity introduced by the different processes, and so objects with reliable redshifts determined from 2 or more of the above approaches were used to measure and remove any such shifts. (Shifts of -49 km s-1 and +72 km s-1 were measured for the NGC 4889 and emission line redshifts relative to the fabtemp97 measurements).
At this stage we are left with 641 galaxy redshifts in our catalog with their associated redshift errors. The success rate of obtaining redshifts from a given number of slits on a mask varied considerably depending on conditions and the magnitude range of objects on the masks, but for typical masks and conditions was around 60-70%.
As described above, the photometry performed on the mountain for mask design was repeated after the observing run. The resulting photometric catalog was then re-matched with the redshift catalog, resulting in our dropping two of our measured objects because of large uncertainties in their positions and magnitudes. The CFHT MOS data therefore provided 639 new redshifts of galaxies in the targeted LOS.
The objects with identified redshifts are listed in a set of Tables (3-18) available in the electronic version of the paper. The columns in the associated electronic table are as follows:
-
1.
RA: The J2000 Right ascension of the galaxy. The relative positions for galaxies in a single quasar field should be good to a few tenths of an arcsecond.
-
2.
DEC: The J2000 Declination of the galaxy. The relative positions for galaxies in a single quasar field should be good to a few tenths of an arcsecond.
-
3.
z: The redshift determined from our MOS spectrum of the galaxy.
-
4.
zerr: this is the error reported by the cross correlation routine, and as such should be considered a lower limit on the redshift error.
-
5.
R-mag: R-band apparent magnitude (MAG_BEST from Sextractor). As discussed above, these are only accurate to 0.2 magnitudes.
-
6.
Bmax: estimate of the maximum rest frame B band luminosity as discussed in § 2.3.5
-
7.
Bmin: estimate of the maximum rest frame B band luminosity as discussed in § 2.3.5
| R.A.(J2000) | Decl.(J2000) | z | zerr | R-mag | Bmax | Bmin |
|---|---|---|---|---|---|---|
| 0:26:55.8 | 22:41:02.3 | 0.1587 | 0.0003 | 18.1 | -20.4 | -19.6 |
| 0:26:56.7 | 22:40:09.3 | 0.3100 | 0.0006 | 20.2 | -19.9 | -19.3 |
| 0:26:57.8 | 22:41:30.6 | 0.3469 | 0.0007 | 21.0 | -19.3 | -18.9 |
| … | … | … | … | … | … | … |
2.5 Additional Galaxy Redshifts
We also searched the literature to find additional galaxies with measured redshifts around the sample QSO LOS. As the typical redshift range for the SDSS and 2dF galaxy redshift samples are not well matched to absorption line data used in this paper, we have not chosen to add in galaxies from those surveys at this stage.
Our main method for finding additional redshifts was through the NED database444This research has made use of the NASA/IPAC Extragalactic Database (NED) which is operated by the Jet Propulsion Laboratory, California Institute of Technology, under contract with the National Aeronautics and Space Administration.. We list the results of this search below. Since the analysis in this paper is statistical in nature, we have chosen only to add redshifts from other authors to our sample when they make a significant difference to the number of redshifts known for a given LOS.
2.5.1 PKS 012200
Galaxies in this LOS were observed by both Bowen et al. (1997), and Chen et al. (2001), but as only two additional galaxy redshifts would have been added to the sample, for simplicity these were not included. For the three galaxies in common between our sample and that in Chen et al. (2001) a mean velocity difference of 30 km s-1 is measured, with an RMS of 450 km s-1 .
2.5.2 PKS 214506
2.5.3 PG 2302+029
This LOS was surveyed by Bowen et al. (2001), obtaining spectra for 24 objects. In this same field, we measured redshifts for 42 objects. We had 6 galaxies in common. (For which we measure a reassuringly small mean velocity shift of -65 km s-1 with RMS 227 km s-1 , in line with our error estimates). This then gives us 18 additional redshifts which we add to our sample. These objects are included in (the electronic) Table 16. On a less positive note, it is interesting that 2 groups designing masks for the same LOS could end up with so little overlap in their samples.
2.5.4 Q0107025A,B
The region around the LOS to the QSO pair Q0107-025A,B was also observed with the COSMIC spectrograph on the Palomar 5m telescope (http://www.astro.caltech.edu/palomar/200inch/cosmic/) by Weymann et al. (private communication). The measured redshifts for one of the masks observed was kindly made available to us by M. Rauche. This yielded 28 additional objects with redshifts. In this case there was no overlap by design, and so we are assuming that any systematic shifts between the two redshift sets is small. These objects are included in (the electronic) Table 4.


3 Analysis
3.1 Sample Properties
The final galaxy sample as described in § 2 above contains 685 objects with redshifts. Of these, 49 have ‘redshifts’ less than 500 km s-1, and hence are almost certainly stars. Assuming this to be true, we can check that our redshift error estimates are reasonable. The mean velocity of this sample is 5 km s-1, with RMS 190 km s-1. The mean of the error estimates on the velocities is 230 km s-1, suggesting we might be slightly overestimating our velocity errors, but, to be conservative, we make no adjustment for this.
The absorber sample as described in § 2 above contains 815 lines, of which 381 are identified as Ly- and 54 are CIV. Of the CIV sample, there are 25 with unique redshifts less than one (i.e. counting doublets as one system). For our present analysis we will restrict ourselves to this subsample of 406 absorption lines.
The final redshift distribution of this absorption line sample is shown in Figure 18. The dramatic drop in line numbers shortward of z0.35 is where Ly- moves below the blue edge of the HST FOS G190H grating. In our subsample, absorption line systems at redshifts less than 0.35 are generally either metal line systems, or Ly- detected in a GHRS exposure towards LBQS0107-025A or B.

The final redshift distribution of the galaxies with measured redshifts is shown in Figure 19.

In Figure 20 we show the distribution of the galaxy sample with projected distance to the QSO LOS in our adopted cosmology. There are relatively few galaxies within 200 kpc of the LOS (as would be expected for a uniformly sampled distribution). The survey geometry, combined with cosmology, results in a fairly flat distribution out to radial distances of 1 Mpc, with a drop off from there out to 2 Mpc which effectively defines the corners of our surveyed volume.

In Figure 21 we show a pie diagram resulting from combining all of the LOS. This figure should allow the reader to understand our survey geometry and the regime over which our statistical results apply. In particular one can clearly see that our survey covers impact parameters out to 2 Mpc for redshifts above 0.45. One can also see that (because the KP observations did not include wavelengths shortward of 1630Å) very few absorber-galaxy pairs are found with redshift less than 0.34. All symbols and lines are as defined for Figure 2.

By comparing the galaxy sample with measured redshifts with the photometric catalogs, we can compute the completeness as a function of magnitude for each field individually. Because of the fairly small number statistics of individual fields, these histograms look fairly noisy, although informative. For this paper, we show the merged result from combining all of the fields. As can be seen in Figure 22, the average completeness peaks at around 60% at the bright end, falling smoothly to 20% at R20 and 10% at R21. This completeness can be taken as roughly referring to the volume enclosed by the solid line in the bottom panel of Figure 21.

3.2 Identifying ‘Absorber-Galaxy pairs’
There are two reasons for trying to identify absorber-galaxy ‘pairs’. One is to investigate the physical relationship (if any) between the gas and the galaxies, while the other is to allow us to try to tie the velocities of the galaxies to the frame of the absorbers.
A straightforward way of tying galaxies to absorbers is to set limits in impact parameter and velocity difference, and to call all galaxies within that distance of an absorber ‘associated’. This begs the question of what to do when there is more than one galaxy within this distance of an absorber, with common approaches being to just take the closest, as defined by some metric combining the velocity difference and projected distance, or to accept all such pairs.
A more complex approach has been followed by the series of papers by Lanzetta and Chen (Lanzetta et al. 1995; Lanzetta et al. 1996; Chen et al. 1998; Ortiz-Gil et al. 1999; Chen et al. 2001), who identify ‘physical’ absorber-galaxy pairs by separating them from ‘random’ and ‘correlated’ pairs in the following manner. ‘Random’ pairs are removed by calculating the value of the absorber-galaxy correlation function assuming a parametric form (kindly provided to us by Hsiao-Wen Chen), given the impact parameter and velocity difference (Lanzetta et al. 1998). Pairs are passed to the next stage if their calculated correlation amplitude is greater than 1. To remove ‘correlated’ pairs they also then require that the impact parameter is less than 200 h-1 kpc (286 kpc in our adopted cosmology). Given the form of the correlation function, and the above additional cut, one can calculate the region of impact parameter/velocity difference space within which an absorber-galaxy pair would be declared ‘physical’. We note that this is in practice extremely similar to a simple cut at impact parameter of 286 kpc and velocity difference of 530 km s-1 .
Another route to the above pairing was discussed by Morris et al. (1993), where the three dimensional distance between absorbers and galaxies was corrected for the statistical fact that objects close in projected distance might have relatively large peculiar motions relative to each other because they are orbiting in the same potential well. As discussed in that paper, it is possible to use the two point correlation function to estimate the probability distribution of the real three dimensional separation of two objects, and then to adopt the expectation value of this probability distribution as what was referred to as the ‘perturbed Hubble flow’ distance.
For simplicity we will only adopt straight cuts in impact parameter and velocity difference (shown for example in Figure 24), along with the Lanzetta et al. correlation function approach, in this paper.
3.3 Properties of 286 kpc. ‘Absorber-Galaxy pairs’
In order to compare our results with those of Chen et al. (2001), we have produced pair samples using their approach, and also with cuts in impact parameter 286 kpc and velocity difference 530 km s-1 (the region enclosed by dashed lines in Figure 24). For our sample, these two approaches produce identical lists of 13 absorber-galaxy pairs. Given our fairly large sample of Ly- absorption lines and galaxies with redshifts, this small number of ‘physical’ pairs might be seen as surprising, but we re-emphasize that our strategy in designing the galaxy redshift survey was not to identify the galaxies ‘causing’ the absorption, but to obtain a statistically well-understood sample of galaxies over a region large in impact parameter. For this reason we did not try to concentrate our efforts at small impact parameters. Indeed, this would have been a rather inefficient use of telescope time and MOS spectrograph real-estate.
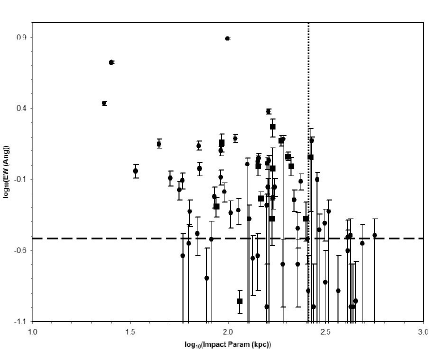
Chen et al. (2001) use their sample of 34 galaxy-absorber pairs to conclude that L* galaxies have tenuous gaseous halos of column density 1014 cm-2, with radius 180 h-1 kpc and covering factor near unity, and that the halo radius scales with galaxy B-band luminosity as L. Their Figures 3 and 4 make the case for this conclusion. In Figure 23 we show a reproduction of their Figure 3 (converted to our adopted cosmology) along with the additional pairs from our sample. Also marked are the fiducial EW of 0.3Å (corresponding roughly to a column density of 1014 cm-2) and the L* impact parameter of 257 kpc (180 h-1 kpc with h=0.7).
In response to an interesting question from the referee of this paper, we have investigated the sub-sample of pairs found with large rest EW (taken to mean larger than 1Å) and large impact parameter (taken to mean larger than 100 kpc). There are 5 such pairs in our sample. With such a small sample, it is impossible to draw any statistically convincing conclusions, but it is notable that all 5 galaxies so identified have at least one other galaxy close to it in redshift. The clearest example is the absorber galaxy pair in the PG 2302+029 LOS at redshift 0.59 where there is a clear group or wall of galaxies at this redshift (see Figure 13). One possible inference, which could only be confirmed with a much larger sample, would be that large EW, large impact parameter ‘pairs’ are identified in somewhat overdense regions.
The additional pairs from our sample do significantly increase the number of large column density pairs with separations larger than 100 kpc, but the incomplete nature of our sample (and indeed of most samples of this nature) does leave open the possibility that a galaxy of comparable brightness might be found closer to the LOS.
We also looked at the rest frame B-band luminosities of the galaxies that are paired in this manner, finding that these were not significantly different from the luminosities of all the galaxies found in pairs with separation up to 5000 km s-1 and impact parameter up to 2 Mpc. I.e. there is no evidence from our sample that more luminous galaxies are more likely to be found in absorber-galaxy pairs. However, the large uncertainties in the derived absolute B-band magnitudes we tabulate, that results largely from an uncertain k-correction, mean that any such trend, even if present, could be undetectable using the data in this paper.
As a result of these inconclusive results, we have chosen to abandon the approach of trying to identify a single ‘physical’ galaxy-absorber pair, and in the next section will concentrate on the statistical properties of all the galaxy-absorber pairs within a fairly generous window.
3.4 Properties of All AbsorberGalaxy Pairs with velocity difference less than 1000 km s-1
We can now analyse the statistical properties of the relative distributions of the gas and galaxies along the 16 lines of sight. The basic sample we will use will be taken from all possible pairs of absorbers and galaxies with velocity differences less than +/- 5000 km s-1 . For the CIV systems we have only taken the stronger line of the doublet. We note that therefore individual absorbers or galaxies can appear multiple time as different pairs. The entire sample is shown in Figure 24. This complicated plot shows both the regions we have determined to contain an excess of absorber-galaxy ‘pairs’, and also a region beyond +/- 1000 km s-1 which we will use to determine the ‘background’ value for random pairings. Our sample is large enough to break into bins of impact parameter (shown divided by horizontal lines in the figure). We also measure absorber-galaxy pair over-densities for three different velocity ranges +/- 200, 500 and 1000 km s-1 . We show the illustrative box at impact parameter of 286 kpc and velocity difference of 530 km s-1 which approximates the region selected by Lanzetta et al. (1995); Lanzetta et al. (1996); Chen et al. (1998); Ortiz-Gil et al. (1999) and Chen et al. (2001) as containing physical pairs.


In Figure 25 we show the above data projected onto the x-axis and displayed as a histogram. We also show the mean background values for the Ly- and CIV samples. Two thing can be readily seen from this figure. First that there is a strong over-density of pairswith a small velocity difference in both Ly- and CIV, and secondly that the velocity differences seen in CIV are somewhat smaller than those seen in the Ly- . The RMS of the velocity differences between all absorber-galaxy pairs seen in Ly- with velocity difference between 1000 km s-1 is 440 km s-1 (191 pairs), while the RMS for absorber-galaxy pairs seen in CIV with velocity difference between 1000 km s-1 is 350 km s-1 (31 pairs).

We also show in Figure 26 how the pairs in the two other plots are distributed in redshift. As a result of the wavelength coverage of the FOS spectra providing our absorption line sample, there is a clear break in the sample at z=0.29. For the following analysis we will consider both the whole sample, and also just the pairs with z0.29 to check whether the results are being affected by the low redshift sub-sample (which mostly comes from the LBQS 0107-025A and B LOS).
Given this sample, we can now pose the question: How large is the absorber-galaxy pair over-density compared to the background, and how significant is the detection of this over-density? In order to measure the latter, we consider the numbers of pairs seen in the various bins in impact parameter and velocity difference in Figure 24 to be drawn from a Poisson distribution with an expected mean given by the ‘background’ density measured at the same range of impact parameter but with velocity differences between -5000 and -1000 km s-1 and between +1000 and +5000 km s-1 . The results of the analysis are shown in Figures 27, 28, 29, and 30.
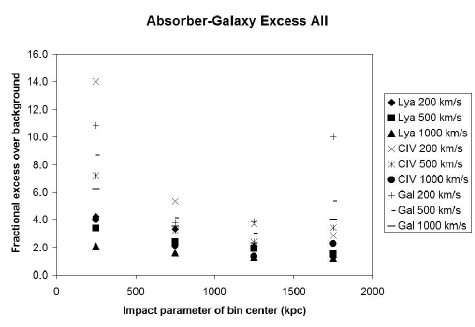

In Figures 27 and 28 we show that (as expected by a visual inspection of Figure 24) there is a substantial over-density of absorber-galaxy pairs at impact parameters less than 500 kpc. The fractional over-density is larger for the systems seen in CIV than for the Ly- systems. At larger impact parameters, the fractional over-density is less. It is reasonable that the strength of the over-density generally drops as one increases the velocity difference range within which one counts pairs.
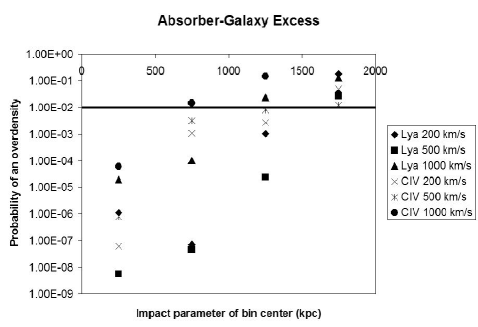
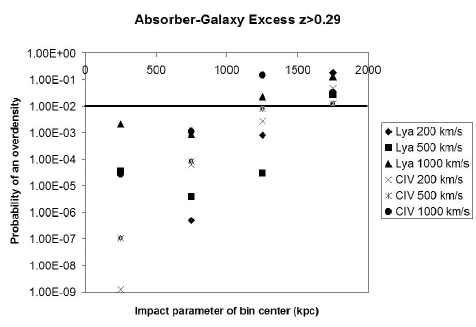
In Figures 29 and 30 we show that the over-densities notable in Figures 27 and 28 have a 1% probability of arising by chance out to impact parameters of at least 1.5 Mpc. This is consistent, for example, with the models of Davé et al. (1999). Figure 18 in that paper for example shows correlations in absorber-galaxy properties out to these sorts of scales.
Note that the probabilities reported assume that the expected (or background) value is known perfectly. In practice there is a (Poisson) error on our measurement of this background, which could be folded in to the analysis, but has not been in order to avoid overly complicated plots.
As noted in § 2.2, the identifications of the lines in the PG 1718+481 LOS are not complete. We have rerun the above statistical tests including all the unidentified lines as Ly- and find that this makes no significant difference to the results reported in this section.
We also remind the reader that the FOS spectral resolution of 230 km s-1 means that no pairs of absorption features can be identified with velocity difference smaller than this. The low density of Ly- absorbers at these redshifts make the likelihood of two such lines coinciding by chance low, although clustering can obviously change this conclusion. This issue is discussed in more detail in Jannuzi et al. (1998). We also note that the galaxy redshift uncertainties (also of 230 km s-1 ) will artificially move galaxies across the boundaries of any velocity difference cut. The general trend will be (a) to weaken any measured correlation, and (b) for this weakening to be stronger for the smaller velocity difference bins.
An obvious question is whether the observed results are simply due to the absorbing gas being in the halo of a galaxy, and the detected pair excess being due to the galaxy-galaxy correlation function. This is tested using the galaxy sample and forming a similar sample of galaxy-galaxy pairs to the absorber-galaxy pairs. In order to approximately match the absorber galaxy sample, we choose galaxies from each field within 500 kpc of the QSO LOS, and collect up all resulting pairs with that sample. This subsample should then be able to find pairs in the same volume of space as the absorber sample. Figures 31 and 32 are the equivalent of Figures 24 and 26 but for the galaxy-galaxy pairs. The over-densities found for galaxy-galaxy pairs were plotted in Figures 27 and 28.


The above analysis shows that the galaxy-galaxy pair over-density is significantly higher than the absorber-galaxy pair over-density seen for the Ly- systems, but comparable to that seen for the absorber systems seen in CIV. This result could have several interpretations, but one might be that the absorbing gas seen in CIV (and which has obviously been polluted by outflows from galaxies) is still in close proximity with galaxies, while systems seen in Ly- are more widely distributed, albeit still correlated with the galaxy distribution.555When this paper was near to submission, an interesting short letter appeared on astro-ph by Chen et al. (2005) describing a single LOS with high quality STIS UV spectroscopy. They perform a correlation analysis with a sample of 61 galaxies within 1 h-1 Mpc at redshifts less than 0.5. Some of their conclusions will need confirmation with a greater number of LOS and a larger galaxy sample, but their conclusion that the absorber-galaxy correlation is entirely due to the emission line (i.e. star forming) galaxies is potentially very exciting. If confirmed, then this would support a seductively simplistic model with star forming galaxies and high column density absorbing gas co-existing in the filamentary structure now so familiar from the simulations, while the more highly clustered absorption line galaxies lie in the knots and intersections where the 104 K gas needed for detection in Ly- is absent or destroyed (possibly by conversion into the much sought after WHIM). Our data set can be used to look for confirmation of this picture. Another possible interpretation is that we are just seeing the column density correlation with impact parameter noted by other authors and modelled for example by Davé et al. (1999). Separating hydrogen column density from metallicity as the underlying driver of these correlations needs further work and will benefit from higher resolution UV spectroscopy (i.e. data from the HST archive taken with the Space Telescope Imaging Spectrograph (STIS)).
3.5 The link to simulations and theory
One of the many benefits provided by the powerful cosmological simulations begun in the 1990s and continuing into the present (see introduction for list of references), is the ability to simulate the evolution of the physical properties of Ly- absorbers as a function of redshift and cosmic time. This helps tremendously when trying to make use of diverse observational data sets in order to understand what physical processes influence the physical properties and evolution of the IGM and galaxies. The theoretical models aid us in identifying the high redshift progenitors of structures observed at low redshift. For example, it is from such models (e.g. Davé et al. (1999); Schaye (2001)) that we understand that a given relative over-density in the (dark) matter distribution will be associated with a different column density of neutral hydrogen as a function of redshift. Ly- absorbers with N approximately 1014 cm-2 at are in regions of over-density that at would have neutral gas columns closer to 1016 cm-2 (Davé et al. 1999). We note that this does not imply that regions of neutral column density 1016 cm-2 at z=3 evolve into regions with neutral column density 1014 cm-2 at z=0, but merely that these two different column densities of neutral material flag regions at those two epochs with the same dark matter overdensity.
A natural next step for this work will be to compare the statistics we have derived from our observations with statistics measured as close as possibly identically on simulations which include feedback, with a goal of verifying or ruling out the feedback assumptions they have made. This is a challenging project, as the simulation must faithfully include both low density inter-galactic gas, and also accurately predict the locations and physical properties (stellar luminosities and star formation histories) of the highly-collapsed galaxies. The redshift range from z=1 to the present day is well known to be hard to model at high resolution, because of the large dynamic range needed. That said, several of the references to modelling work given in the introduction suggest that this problem is tractable.
4 Conclusions
A goal of our work is an improved understanding of how gas is transformed into galaxies, and how those galaxies in turn influence the gas around them (e.g. by winds, jets or radiation). Studies of absorbers and galaxies at high redshift have already yielded evidence for such mechanisms playing a role in the formation and evolution of galaxies (e.g. Adelberger et al. (2003); Croft et al. (2002); Frank et al. (2003); Bruscoli et al. (2003) and Kollmeier et al. (2003)).
We have focussed on the second half of the history of the Universe, i.e. at redshifts less than one. This is a period in which the star formation density of the Universe is thought to be dropping away from its peak, the rapid evolution of the properties of the Ly- absorbers has slowed, and when the Hubble sequence of galaxies is well established. Despite this apparent middle-aged placidity, there should remain clear evidence of the wild excesses of youth, and that is what we claim to have measured. An advantage of focussing on this (large) fraction of the history of the Universe is that the galaxy population can be studied in detail, and with confidence that a representative sample has been obtained.
There is evidence from the KP data set alone for clustering of some fraction of low redshift () Ly- absorbers on velocity scales 300 km/sec. This evidence is that approximately 10% of the KP Ly- absorbers are “resolved” in the FOS spectra (Jannuzi et al. 1998).
At higher column densities, the Lyman limit systems contained in the KP sample all have extensive associated metal line systems. For all the extensive metal line systems (multiple absorption lines from strong resonance line producing species, e.g. Si, O, N, etc.) for which we could check for the presence of an associated Lyman Limit system, we detect such a system. In other words, the absorption line systems that are unambiguously higher column density systems (at low redshift) are unquestionably more like the gas producing the ISM of a galaxy than like the gas one might expect in a void. These same absorbers also often have associated OVI, or NV, or other evidence of more highly ionized components i.e. multi-phase gas again, like a galaxy.
Our conclusions for the more moderate column density systems that dominate our current sample can be summarized as:
-
•
A correlation between absorbers and galaxies has been detected out to impact parameters of at least 1.5 Mpc.
-
•
The strength of the absorber-galaxy correlation is weaker than the correlation between galaxies and galaxies.
-
•
The velocity differences seen between galaxies and absorbers with detected CIV are typically smaller than the velocity differences seen between galaxies and absorbers seen in Ly- only.
-
•
The above is consistent with absorbers being a mixed population containing some pristine 666Given the results of e.g. Songaila (2001) on the high-z Universe that show that all gas has CIV by z of 5.5, it is debatable whether anything we see in absorption is truly ‘pristine’ material probably infalling for the first time along the filaments predicted by current models, and some contaminated material produced by outflows which in general lies closer to galaxies in velocity.
-
•
The above qualitative picture needs to be fleshed out by comparing the numerical strengths of the observed correlations and relationships with SPH or AMR modelling.
While we have so far only made a fairly superficial analysis of the (no-doubt complex) relationship between gas and galaxies at redshifts less than one, we feel the above results are very encouraging, and that they suggest that there is considerable room for further observation and modelling of this crucial interaction.
Acknowledgments
This work would not have been possible without many landmark contributions by Professor John Bahcall, who sadly passed away as we prepared to submit this paper. Not only did Bahcall anticipate the production of quasar absorption lines by gas associated with galaxies and other structures (Bahcall & Spitzer 1969), but he indefatigably worked for the development, launch, repair, and continued operation of the Hubble Space Telescope. As PI of the Key Project, he led the team that successfully completed the first census of absorbers at low redshift, enabling the present work.
We would like to that our anonymous referee who made a number of suggestions that significantly improved the quality of this paper.
We thank Ray Weymann for his active participation in the hard work of the observing runs that produced the data presented in this work and for many relevant conversations. We also thank the CFHT telescope operators. We thank Michael Rauch for providing the additional redshifts in the LBQS 0107025 sight-line and H. W. Chen for providing to us the description of the correlation function used in the referenced Chen et al. papers. We would like to acknowledge valuable discussions regarding the proper use of FOCAS and SExtractor with respectively F. Valdes and M. J. I. Brown. We also thank Professor Carlos Frenk and the Durham visitor grant program that helped support this work. BTJ acknowledges partial support of early stages of this work from NASA through HF-1045.01-93A and later stages by the National Optical Astronomy Observatory, operated by AURA, Inc., on behalf of the U.S. National Science Foundation. Finally, we thank Mrs. Jane Darwin for providing the accommodation where the production of this document was finally completed.
References
- Adelberger et al. (2003) Adelberger K. L., Steidel C. C., Shapley A. E., Pettini M., 2003, ApJ, 584, 45
- Aguirre et al. (2005) Aguirre A., Schaye J., Hernquist L., Kay S., Springel V., Theuns T., 2005, ApJ, 620, L13
- Bahcall et al. (1993) Bahcall J. N., Bergeron J., Boksenberg A., Hartig G. F., Jannuzi B. T., Kirhakos S., Sargent W. L. W., Savage B. D., Schneider D. P., Turnshek D. A., Weymann R. J., Wolfe A. M., 1993, ApJS, 87, 1
- Bahcall et al. (1996) Bahcall J. N., Bergeron J., Boksenberg A., Hartig G. F., Jannuzi B. T., Kirhakos S., Sargent W. L. W., Savage B. D., Schneider D. P., Turnshek D. A., Weymann R. J., Wolfe A. M., 1996, ApJ, 457, 19
- Bahcall et al. (1992) Bahcall J. N., Jannuzi B. T., Schneider D. P., Hartig G. F., Jenkins E. B., 1992, ApJ, 398, 495
- Bahcall & Spitzer (1969) Bahcall J. N., Spitzer L. J., 1969, ApJ, 156, L63+
- Bahcall et al. (1973) Bahcall N. A., Bahcall J. N., Schmidt M., 1973, ApJ, 183, 777
- Barcons et al. (1998) Barcons X., Lanzetta K. M., Chen H.-W., Yahata N., Webb J. K., Fernández-Soto A., Ortiz-Gil A., 1998, Ap&SS, 263, 75
- Bergeron & Boisse (1991) Bergeron J., Boisse P., 1991, A&A, 243, 344
- Bergeron et al. (1994) Bergeron J., Petitjean P., Sargent W. L. W., Bahcall J. N., Boksenberg A., Hartig G. F., Jannuzi B. T., Kirhakos S., Savage B. D., Schneider D. P., Turnshek D. A., Weymann R. J., Wolfe A. M., 1994, ApJ, 436, 33
- Bertin & Arnouts (1996) Bertin E., Arnouts S., 1996, A&AS, 117, 393
- Bouché et al. (2004) Bouché N., Murphy M. T., Péroux C., 2004, MNRAS, 354, L25
- Bowen et al. (1996) Bowen D. V., Blades J. C., Pettini M., 1996, ApJ, 464, 141
- Bowen et al. (2001) Bowen D. V., Jimenez R., Jenkins E. B., Pettini M., 2001, ApJ, 547, 39
- Bowen et al. (1997) Bowen D. V., Osmer S. J., Blades J. C., Tytler D., 1997, MNRAS, 284, 599
- Bowen et al. (2002) Bowen D. V., Pettini M., Blades J. C., 2002, ApJ, 580, 169
- Bregman et al. (2004) Bregman J. N., Dupke R. A., Miller E. D., 2004, ApJ, 614, 31
- Bruscoli et al. (2003) Bruscoli M., Ferrara A., Marri S., Schneider R., Maselli A., Rollinde E., Aracil B., 2003, MNRAS, 343, L41
- Côté et al. (2005) Côté S., Wyse R. F. G., Carignan C., Freeman K. C., Broadhurst T., 2005, ApJ, 618, 178
- Cen & Ostriker (1999) Cen R., Ostriker J. P., 1999, ApJ, 514, 1
- Cen et al. (1998) Cen R., Phelps S., Miralda-Escude J., Ostriker J. P., 1998, ApJ, 496, 577
- Charlton et al. (2003) Charlton J. C., Ding J., Zonak S. G., Churchill C. W., Bond N. A., Rigby J. R., 2003, ApJ, 589, 111
- Chen et al. (2001) Chen H., Lanzetta K. M., Webb J. K., 2001, ApJ, 556, 158
- Chen et al. (1998) Chen H., Lanzetta K. M., Webb J. K., Barcons X., 1998, ApJ, 498, 77
- Chen et al. (2001) Chen H., Lanzetta K. M., Webb J. K., Barcons X., 2001, ApJ, 559, 654
- Chen et al. (2005) Chen H.-W., Prochaska J. X., Weiner B. J., Mulchaey J. S., Williger G. M., 2005, ApJ, 629, L25
- Churchill et al. (2000a) Churchill C. W., Mellon R. R., Charlton J. C., Jannuzi B. T., Kirhakos S., Steidel C. C., Schneider D. P., 2000a, ApJS, 130, 91
- Churchill et al. (2000b) Churchill C. W., Mellon R. R., Charlton J. C., Jannuzi B. T., Kirhakos S., Steidel C. C., Schneider D. P., 2000b, ApJ, 543, 577
- Coleman et al. (1980) Coleman G. D., Wu C.-C., Weedman D. W., 1980, ApJS, 43, 393
- Croft et al. (2002) Croft R. A. C., Hernquist L., Springel V., Westover M., White M., 2002, ApJ, 580, 634
- Dahlem (2005) Dahlem M., 2005, A&A, 429, L5
- Danforth & Shull (2005) Danforth C. W., Shull J. M., 2005, ApJ, 624, 555
- Davé et al. (1999) Davé R., Hernquist L., Katz N., Weinberg D. H., 1999, ApJ, 511, 521
- Davé & Tripp (2001) Davé R., Tripp T. M., 2001, ApJ, 553, 528
- Dinshaw et al. (1995) Dinshaw N., Foltz C. B., Impey C. D., Weymann R. J., Morris S. L., 1995, Nature, 373, 223
- Dinshaw et al. (1997) Dinshaw N., Weymann R. J., Impey C. D., Foltz C. B., Morris S. L., Ake T., 1997, ApJ, 491, 45
- Frank et al. (2003) Frank S., Appenzeller I., Noll S., Stahl O., 2003, A&A, 407, 473
- Fujita et al. (2004) Fujita A., Mac Low M.-M., Ferrara A., Meiksin A., 2004, ApJ, 613, 159
- Furlanetto et al. (2005) Furlanetto S. R., Phillips L. A., Kamionkowski M., 2005, MNRAS, 359, 295
- Grogin & Geller (1998) Grogin N. A., Geller M. J., 1998, ApJ, 505, 506
- Hernquist et al. (1996) Hernquist L., Katz N., Weinberg D. H., Jordi M., 1996, ApJ, 457, L51+
- Impey et al. (1999) Impey C. D., Petry C. E., Flint K. P., 1999, ApJ, 524, 536
- Jannuzi et al. (1998) Jannuzi B. T., Bahcall J. N., Bergeron J., Boksenberg A., Hartig G. F., Kirhakos S., Sargent W. L. W., Savage B. D., Schneider D. P., Turnshek D. A., Weymann R. J., Wolfe A. M., 1998, ApJS, 118, 1
- Jannuzi et al. (1996) Jannuzi B. T., Hartig G. F., Kirhakos S., Sargent W. L. W., Turnshek D. A., Weymann R. J., Bahcall J. N., Bergeron J., Boksenberg A., Savage B. D., Schneider D. P., Wolfe A. M., 1996, ApJ, 470, L11+
- Jena et al. (2005) Jena T., Norman M. L., Tytler D., Kirkman D., Suzuki N., Chapman A., Melis C., Paschos P., O’Shea B., So G., Lubin D., Lin W.-C., Reimers D., Janknecht E., Fechner C., 2005, MNRAS, 361, 70
- Jenkins et al. (2005) Jenkins E. B., Bowen D. V., Tripp T. M., Sembach K. R., 2005, ApJ, 623, 767
- Keeney et al. (2005) Keeney B. A., Momjian E., Stocke J. T., Carilli C. L., Tumlinson J., 2005, ApJ, 622, 267
- Kollmeier et al. (2003) Kollmeier J. A., Weinberg D. H., Davé R., Katz N., 2003, ApJ, 594, 75
- Kron (1980) Kron R. G., 1980, ApJS, 43, 305
- Lanzetta et al. (1995) Lanzetta K. M., Bowen D. V., Tytler D., Webb J. K., 1995, ApJ, 442, 538
- Lanzetta et al. (1996) Lanzetta K. M., Webb J. K., Barcons X., 1996, ApJ, 456, L17+
- Lanzetta et al. (1998) Lanzetta K. M., Webb J. K., Barcons X., 1998, in Structure et Evolution du Milieu Inter-Galactique Revele par Raies D’Absorption dans le Spectre des Quasars, 13th Colloque d’Astrophysique de l’Institut d’Astrophysique de Paris The Galaxy-Absorber Cross-Correlation Function. pp 213–+
- Le Brun et al. (1996) Le Brun V., Bergeron J., Boisse P., 1996, A&A, 306, 691
- Le Fevre et al. (1994) Le Fevre O., Crampton D., Felenbok P., Monnet G., 1994, A&A, 282, 325
- Linder (1998) Linder S. M., 1998, ApJ, 495, 637
- Linder (2000) Linder S. M., 2000, ApJ, 529, 644
- Manning (2002) Manning C. V., 2002, ApJ, 574, 599
- Manning (2003) Manning C. V., 2003, ApJ, 591, 79
- Masiero et al. (2005) Masiero J. R., Charlton J. C., Ding J., Churchill C. W., Kacprzak G., 2005, ApJ, 623, 57
- McDonald et al. (2002) McDonald P., Miralda-Escudé J., Cen R., 2002, ApJ, 580, 42
- McLin et al. (2002) McLin K. M., Stocke J. T., Weymann R. J., Penton S. V., Shull J. M., 2002, ApJ, 574, L115
- Mo (1994) Mo H. J., 1994, MNRAS, 269, L49+
- Mo & Morris (1994) Mo H. J., Morris S. L., 1994, MNRAS, 269, 52
- Monet et al. (1998) Monet D. B. A., Canzian B., Dahn C., Guetter H., Harris H., Henden A., Levine S., Luginbuhl C., Monet A. K. B., Rhodes A., Riepe B., Sell S., Stone R., Vrba F., Walker R., 1998, VizieR Online Data Catalog, 1252, 0
- Monet et al. (2003) Monet D. G., Levine S. E., Canzian B., Ables H. D., Bird A. R., Dahn C. C., Guetter H. H., Harris H. C., Henden A. A., Leggett S. K., Levison H. F., Luginbuhl C. B., Martini J., Monet A. K. B., Munn J. A., Pier J. R., Rhodes A. R., Riepe B., 2003, AJ, 125, 984
- Morris & van den Bergh (1994) Morris S. L., van den Bergh S., 1994, ApJ, 427, 696
- Morris et al. (1993) Morris S. L., Weymann R. J., Dressler A., McCarthy P. J., Smith B. A., Terrile R. J., Giovanelli R., Irwin M., 1993, ApJ, 419, 524
- Morris et al. (1991) Morris S. L., Weymann R. J., Savage B. D., Gilliland R. L., 1991, ApJ, 377, L21
- Nagamine et al. (2004a) Nagamine K., Springel V., Hernquist L., 2004a, MNRAS, 348, 421
- Nagamine et al. (2004b) Nagamine K., Springel V., Hernquist L., 2004b, MNRAS, 348, 435
- Odewahn et al. (1992) Odewahn S. C., Bryja C., Humphreys R. M., 1992, PASP, 104, 553
- Ortiz-Gil et al. (1999) Ortiz-Gil A., Lanzetta K. M., Webb J. K., Barcons X., Fernández-Soto A., 1999, ApJ, 523, 72
- Penton et al. (2000) Penton S. V., Shull J. M., Stocke J. T., 2000, ApJ, 544, 150
- Penton et al. (2000) Penton S. V., Stocke J. T., Shull J. M., 2000, ApJS, 130, 121
- Penton et al. (2002) Penton S. V., Stocke J. T., Shull J. M., 2002, ApJ, 565, 720
- Penton et al. (2004) Penton S. V., Stocke J. T., Shull J. M., 2004, ApJS, 152, 29
- Rauch et al. (1996) Rauch M., Weymann R. J., Morris S. L., 1996, ApJ, 458, 518
- Rosenberg et al. (2003) Rosenberg J. L., Ganguly R., Giroux M. L., Stocke J. T., 2003, ApJ, 591, 677
- Sabra et al. (2003) Sabra B. M., Hamann F., Jannuzi B. T., George I. M., Shields J. C., 2003, ApJ, 590, 66
- Scannapieco (2005) Scannapieco E., 2005, ApJ, 624, L1
- Scannapieco et al. (2002) Scannapieco E., Ferrara A., Madau P., 2002, ApJ, 574, 590
- Schaye (2001) Schaye J., 2001, ApJ, 559, 507
- Schneider et al. (1993) Schneider D. P., Hartig G. F., Jannuzi B. T., Kirhakos S., Saxe D. H., Weymann R. J., Bahcall J. N., Bergeron J., Boksenberg A., Sargent W. L. W., Savage B. D., Turnshek D. A., Wolfe A. M., 1993, ApJS, 87, 45
- Sembach et al. (2004) Sembach K. R., Tripp T. M., Savage B. D., Richter P., 2004, ApJS, 155, 351
- Shull et al. (1996) Shull J. M., Stocke J. T., Penton S., 1996, AJ, 111, 72
- Songaila (2001) Songaila A., 2001, ApJ, 561, L153
- Steidel et al. (2002) Steidel C. C., Kollmeier J. A., Shapley A. E., Churchill C. W., Dickinson M., Pettini M., 2002, ApJ, 570, 526
- Stocke et al. (2004) Stocke J. T., Keeney B. A., McLin K. M., Rosenberg J. L., Weymann R. J., Giroux M. L., 2004, ApJ, 609, 94
- Stocke et al. (1995) Stocke J. T., Shull J. M., Penton S., Donahue M., Carilli C., 1995, ApJ, 451, 24
- Theuns et al. (1998) Theuns T., Leonard A., Efstathiou G., 1998, MNRAS, 297, L49
- Theuns et al. (2002) Theuns T., Viel M., Kay S., Schaye J., Carswell R. F., Tzanavaris P., 2002, ApJ, 578, L5
- Tripp et al. (2002) Tripp T. M., Jenkins E. B., Williger G. M., Heap S. R., Bowers C. W., Danks A. C., Davé R., Green R. F., Gull T. R., Joseph C. L., Kaiser M. E., Lindler D., Weymann R. J., Woodgate B. E., 2002, ApJ, 575, 697
- Tripp et al. (1998) Tripp T. M., Lu L., Savage B. D., 1998, ApJ, 508, 200
- Tumlinson & Fang (2005) Tumlinson J., Fang T., 2005, ApJ, 623, L97
- Tumlinson et al. (2005) Tumlinson J., Shull J. M., Giroux M. L., Stocke J. T., 2005, ApJ, 620, 95
- Valdes (1989) Valdes F., 1989, in 1st. ESO/ST-ECF Data Analysis Workshop, Proceedings, held in Garching, F.R.G., April 17-19, 1989. Editors, P.J. Grosbol, F. Murtagh, R.H. Warmels; Publisher, European Southern Observatory, Garching bei Munchen, F.R.G., 1989. ISBN # 3-923524-32-3. LC # QB51.3. E43 E86. P. 35, 1989 Faint Object Classification and Analysis System Standard Test Image Results. pp 35–+
- Valdes (2002) Valdes F. G., 2002, in Automated Data Analysis in Astronomy The Reduction of CCD Mosaic Data. pp 309–+
- van Gorkom et al. (1996) van Gorkom J. H., Carilli C. L., Stocke J. T., Perlman E. S., Shull J. M., 1996, AJ, 112, 1397
- vanden Berk et al. (1999) vanden Berk D. E., Lauroesch J. T., Stoughton C., Szalay A. S., Koo D. C., Crotts A. P. S., Blades J. C., Melott A. L., Boyle B. J., Broadhurst T. J., York D. G., 1999, ApJS, 122, 355
- Viel et al. (2005) Viel M., Branchini E., Cen R., Ostriker J. P., Matarrese S., Mazzotta P., Tully B., 2005, MNRAS, 360, 1110
- Viel et al. (2002) Viel M., Matarrese S., Mo H. J., Theuns T., Haehnelt M. G., 2002, MNRAS, 336, 685
- Weedman (1970) Weedman D. W., 1970, ApJ, 161, L113+
- Weymann et al. (1995) Weymann R., Rauch M., Williams R., Morris S., Heap S., 1995, ApJ, 438, 650
- Weymann et al. (1998) Weymann R. J., Jannuzi B. T., Lu L., Bahcall J. N., Bergeron J., Boksenberg A., Hartig G. F., Kirhakos S., Sargent W. L. W., Savage B. D., Schneider D. P., Turnshek D. A., Wolfe A. M., 1998, ApJ, 506, 1
- Yee et al. (2000) Yee H. K. C., Morris S. L., Lin H., Carlberg R. G., Hall P. B., Sawicki M., Patton D. R., Wirth G. D., Ellingson E., Shepherd C. W., 2000, ApJS, 129, 475
- Young et al. (2001) Young P. A., Impey C. D., Foltz C. B., 2001, ApJ, 549, 76
- Zhang et al. (1997) Zhang Y., Anninos P., Norman M. L., Meiksin A., 1997, ApJ, 485, 496
- Zonak et al. (2004) Zonak S. G., Charlton J. C., Ding J., Churchill C. W., 2004, ApJ, 606, 196