X-ray flare modeling in the single giant HR 9024
Abstract
We analyze a Chandra HETGS observation of the single G-type giant HR 9024. The high flux allows us to examine spectral line and continuum diagnostics at high temporal resolution, to derive plasma parameters (thermal distribution, abundances, temperature, …). A time-dependent 1D hydrodynamic loop model with semi-length 1012cm (), and impulsive footpoint heating triggering the flare, satisfactorily reproduces the observed evolution of temperature and emission measure, derived from the analysis of the strong continuum emission. The observed characteristics of the flare appear to be common features in very large flares in active stars (also pre-main sequence stars), possibly indicating some fundamental physics for these very dynamic and extreme phenomena in stellar coronae.
keywords:
High resolution X-ray spectroscopy, hydrodynamic loop models1 HETGS observations and analysis
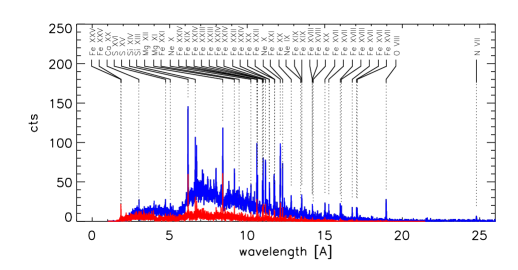
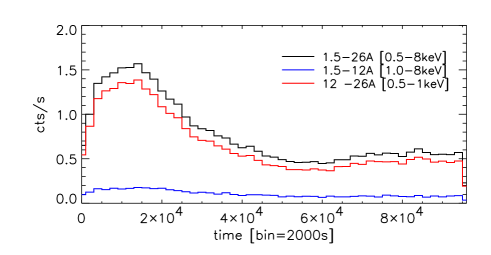
Figure 1 and 2 show the Chandra High Energy (HEG) and Medium Energy (MEG) Gratings spectra, and the lightcurve for a ks observation of the single giant HR 9024. The lightcurves for a hard and a soft spectral band, shown in Fig. 2, indicate an harder spectrum during the two peaks of the emission ( ks and ks from the start of the observation), typical of stellar flares. Table 1 summarizes the characteristics of source and the parameters of the Chandra observation.
| Spec. | d | ||||||
|---|---|---|---|---|---|---|---|
| type | [pc] | [] | [] | [erg/s] | [days] | [erg/s] | [ks] |
| G1 iii | 135 | 13.6 | 2.9 | 35.4 | 23.25 | 31.8 | 95.7 |
Spectral Analysis:
The high resolution spectra provide several plasma diagnostics, from the analysis of both continuum and emission lines, and from the lightcurves in different spectral bands or in single lines. The evolution of temperature and emission measure (EM) during the flare allows to construct a model of the flaring structure(s) (Reale et al. 1997).
-
•
T is derived from the fit to the continuum emission, selecting spectral regions ”line-free” (on the basis of predictions of atomic databases such as APED [Smith et al. 2001], CHIANTI [Dere et al. 1997]); the fit also provides an estimate for EM from the normalization parameter.
-
•
The emission measure distribution (DEM) is derived through a Markov-Chain Monte-Carlo analysis using the Metropolis algorithm (MCMC[M]; Kashyap & Drake 1998) on a set of line flux ratios (O lines are the coolest Ar the hottest, i.e. logT[K] 6.2-7.8). Coronal abundances are evaluated on the basis of the derived DEM; the abundance is a scaling factor in the line flux equation to match the measured flux.
2 Results
Abundances and DEM:
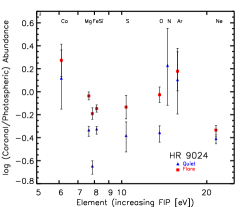
Fig. 3 show the abundances (left) and DEM (right) derived for the flare peak, and the quiescent emission.
-
-
abundances variations between flaring and ’quiescent’ phases
-
-
very hot corona, also outside the flaring phase, as found also from an XMM-Newton observation showing no obvious flare (Gondoin 2003)

Hydrodynamic Modeling:
We aim at reproducing the observed evolution of temperature, T, and emission measure, EM. The 1D hydrodynamic model, solves time-dependent plasma equations with detailed energy balance; a time-dependent heating function defines the energy release triggering the flare. The coronal plasma is confined in a closed loop structure: plasma motion and energy transport occur only along magnetic field lines. Parameters: (1) loop semi-length cm (a first estimate of L is obtained from the observed decay time); (2) footpoint heating; (3) initial atmosphere: hydrostatic, K; however, the initial conditions do not affect the evolution of the plasma after a very short time.
Fig. 4 show the comparison of observed T and EM evolution, and X-ray lightcurve, with the corresponding quantities synthesized from the hydrodynamic model.
The observed evolution is reproduced reasonably well by a model characterized by:
-
-
loop semi-length cm ();
-
-
impulsive (20 ks, shifted by 15 ks preceding the beginning of observation) footpoint heating triggering the flare; no sustained heating (i.e. pure cooling);
-
-
volumetric heating erg/cm3/s, heating rate erg/s;
-
-
from the normalization of the model lightcurve we derive an estimate of loop aspect ratio , i.e. the loop cross-section has radius cm.


3 Conclusions
The evolution of this very hot spectrum is reproduced by an hydrodynamic loop model with . This loop model has roughly the same parameters of models satisfyingly reproducing other large flares: e.g. flares in pre-main sequence stars (Favata et al. 2005). Large flares observed in very active stars seem to have very similar characteristics, possibly with important implications for the physics of these phenomena. Large flares as the one observed for HR 9024 are very unusual in single evolved stars, while being more common in active binary system.
Future work: (1) finer spectroscopic analysis, and hydrodynamic modeling; detailed comparison of observed spectra with synthetic spectra derived from hydrodynamic model. The high resolution spectroscopy together with the high signal for this observation provides a large amount of constraints to the model. (2) explore possible evidence of Non Equilibrium Ionization effects. (3) determine robust constraints on abundance variations during flare (4) analysis of Fe fluorescent emission: we can obtain constraints on the geometry of the emitting plasma, in particular on the height of the illuminating source, i.e. the loop sizes, obtaining a cross-check to the results of the hydrodynamic modeling. This observation provides the first clear evidence of fluorescence in post-PMS stars other than the Sun (i.e. fluorescence from photosphere; while in PMS stars there is evidence that the fluorescence emission is coming from the accretion disks).
References
- (1)
- Dere et al. (1997) Dere. K.P. et al. 1997, A&AS, 125, 149
- Favata et al. (2005) Favata, F. et al. 2005, ApJS, COUP special issue, in press
- Gondoin (2003) Gondoin, P., 2003, A&A, 409, 263
- Kashyap & Drake (1998) Kashyap & Drake 1998, ApJ, 503, 450
- Reale et al. (1997) Reale, F. et al. 1997, A&A, 352, 782
- Smith et al. (2001) Smith, R.K. et al. 2001, ApJ, 556, L91