A Mid-Infrared Study of the Class 0 Cluster in LDN 1448
Abstract
We present ground-based mid-infrared observations of Class 0 protostars in LDN 1448. Of the five known protostars in this cloud, we detected two, L1448N:A and L1448C, at 12.5, 17.9, 20.8, and 24.5 µm, and a third, L1448 IRS 2, at 24.5 µm. We present high-resolution images of the detected sources, and photometry or upper limits for all five Class 0 sources in this cloud. With these data, we are able to augment existing spectral energy distributions (SEDs) for all five objects and place them on an evolutionary status diagram.
1 Introduction
The majority of young stellar objects (YSOs) are classified using a scheme based on characteristics of their SEDs introduced by Lada & Wilking (1984) (see also Lada, 1987, 1991). They proposed three classes: I, II, and III; distinguished from one another by their near-infrared to mid-infrared spectral indices, which were presumed to be indicators of the evolutionary status of the object in question. Class I sources were initially thought to be representative of the earliest stage of pre-main-sequence evolution, i.e. protostars.
The spectral index, , is defined as
| (1) |
for purposes of YSO classification, the region of the SED usually used for this calculation is from 2.2 m to 10 m. The spectral index is the negative of the slope of the SED, when graphed in the frequency domain (Lada, 1991).
The most current version of this slope classification scheme is presented in Greene et al. (1994). For a Class I source, the SED tends to be broader than a single-temperature blackbody and , due to the fact that the peak of the SED of such a source is shifted towards the far-infrared because of the very low effective temperature of the YSO. These sources are usually deeply embedded in their nascent dust envelopes. For Class II and Class III YSOs, on the other hand, and , respectively. The SED of a Class II will be much broader than that of a Class III, due to the presence of circumstellar dust with a fairly wide temperature distribution. Greene et al. (1994) identify a fourth class of “flat spectrum” sources, for which , that have near-infrared spectra which are strongly veiled by continuum emission from hot circumstellar dust.
Observations of candidate protostars, in particular VLA 1623 in Ophiuchi A, an extremely cold ( 20 K) object that does not appear at IRAS wavelengths, led to the introduction of a new class of young stellar objects (YSOs) by André, Ward-Thompson, and Barsony (1993). They contended that Class I sources could not be the youngest examples of pre-main-sequence objects (i.e., not true protostars), and promptly created a new category for such objects, designated Class 0. The search for these protostars has gained impetus in the last several years due to the development of highly sensitive submillimeter continuum detectors.
Class 0 protostars are the rarest of YSOs. Pre-main-sequence stars typically spend years in this phase, on their way towards the onset of hydrogen fusion and stellar birth. The current set of defining characteristics of a Class 0 protostar are as follows (André, Ward-Thompson, and Barsony, 2000):
-
•
Detection of a radio continuum source, presence of a molecular outflow, or some other evidence of a central protostellar source;
-
•
Centrally peaked but extended submillimeter continuum emission indicating an envelope as opposed to a mere disk;
-
•
A ratio of Lsubmm/Lbol 0.5% (where Lsubmm is the luminosity radiated by the object at wavelengths longward of 350 m and Lbol is the total luminosity of the object).
This last criterion indicates a circumstellar mass greater than the mass of the central protostellar core, as discussed in André, Ward-Thompson, and Barsony (1993). There is no mention of the spectral index between 2 and 10 m, since these sources have generally not been detected shortward of 10 m using ground-based instruments. This will change, no doubt, as detector technology evolves.
Although reports of newly discovered Class 0 protostars have increased dramatically in the last few years, confirmed sources in this category still number well under a hundred. (André, Ward-Thompson, and Barsony, 2000; Froebrich, 2005). The spectral energy distribution (SED) of a Class 0 object, with a typical effective temperature of 40 K, peaks at around 100 µm; until fairly recently, essentially the only tool with which one may study the Wien side of the SEDs of protostars has been the IRAS database.
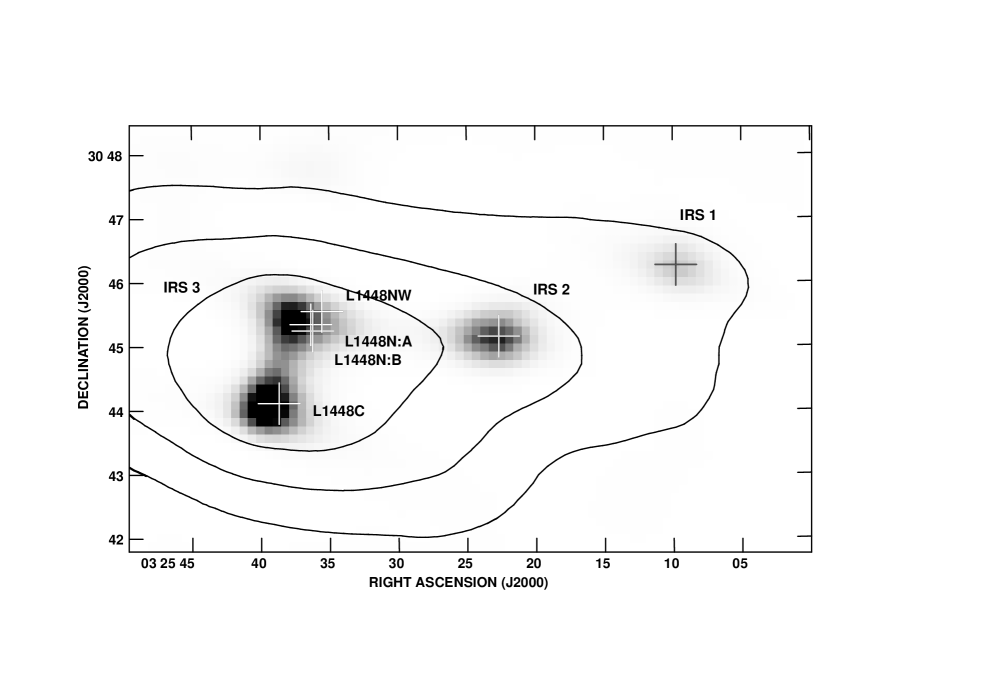
The majority of known Class 0 sources were detected by IRAS at 25 µm, if not at 12 µm; however, due to the nature of the IRAS data, the effective beam size at mid-infrared wavelengths is never less than 30–40″, even when using the high-resolution data-processing program YORIC (Aumann, Fowler, and Melnyk, 1990; Hurt & Barsony, 1996; Barsony et al., 1998; O’Linger et al., 1999). Figure 1 provides an example of coadded 60-µm IRAS data before (contours) and after HIRES processing (greyscale) via YORIC. The poor spatial resolution of the IRAS data makes associating point sources in the catalog with data from other wavelengths difficult and, in cases of close binary or multiple systems, does not allow the contributions of the individual components to the total flux to be distinguished. HIRES point-source modeling, which makes use of a little-known feature of the YORIC program, has been used successfully to estimate individual IRAS fluxes from sources as close as 20″ apart, but this still does not compare with the sub-arcsecond resolution obtainable with millimeter-wave interferometry (Barsony et al., 1998). Consequently, the mid-infrared spectral energy distributions of Class 0 sources have tended to be poorly constrained. Data from the latest NASA Great Observatory, the Spitzer Space Telescope are already contributing significantly to our understanding of the mid-IR characteristics of young stellar objects, but Spitzer lacks the resolution to augment the information on the small-scale structure of their circumstellar environments which may be obtained from submillimeter and millimeter wavelength observations (Chandler & Richer, 2000; Looney, Mundy, & Welch, 2000).
Some of the most important questions in star formation studies today center around the multiplicity of these young systems, and how the binary properties evolve with time (Looney, Mundy, & Welch, 2000; Reipurth, 2000). The majority of nearby young T Tauri stars are known to be binary systems, yet only a very few Class 0 protobinary systems have been resolved. It has been postulated that the giant Herbig-Haro flows driven by many young stellar objects may be initiated by the dynamical decay of unstable multiple systems (Reipurth, 2000). Understanding star formation in the context of multiple systems has important implications for understanding the IMF and its physical meaning.
In order to address the issue of multiplicity and obtain details about the immediate circumstellar environments of Class 0 sources, it is necessary to study these objects at as many wavelengths as possible with high angular resolution.
A particularly rich cluster of Class 0 sources is located in the compact globule L1448, a molecular cloud which is part of the Perseus molecular complex. L1448 lies at a distance of 300 pc; its mass, estimated from ammonia data, is 50 M☉ (Bachiller & Cernicharo, 1986a). Three embedded infrared sources were detected by IRAS in this cloud; since then, it has been surveyed at several wavelengths and mapped in a number of molecular lines (Bachiller & Cernicharo, 1986b; Anglada et al., 1989; Bally et al., 1997; Eislöffel, 2000; Wolf-Chase, Barsony, & O’Linger, 2000). Listed from west to east, the IRAS Point Source Catalog designations for the three sources are IRAS 03220+3035, IRAS 03222+3034, and IRAS 03225+3034. In the literature, these objects are more commonly known as L1448 IRS 1, L1448 IRS 2, and L1448 IRS 3, respectively (see Figure 1).
Only the western-most of these objects (IRS 1) has been detected at near-infrared and shorter wavelengths (Cohen & Kuhi, 1979; Neckel & Staude, 1984); this source has been identified as a Class I YSO and hence was not included in our survey (Eislöffel, 2000; Barsony, 2000). The other two IRAS point sources have been found to contain multiple Class 0 objects. IRS 2 was recently reported by Wolf-Chase, Barsony, & O’Linger (2000) to be a candidate protobinary system, based on the two distinct molecular outflows which emerge from that position, although the binary components were unresolved at that time. Subsequently Volgenau et al. (2002) announced that both components of the IRS 2 binary had in fact been detected at BIMA. IRS 3 consists of L1448N:A,B (a 7″ protobinary), L1448NW, and L1448C (note: L1448C is frequently referred to as L1448-mm), all of which drive molecular outflows as well (Terebey & Padgett, 1997; Barsony et al., 1998; Eislöffel, 2000; Wolf-Chase, Barsony, & O’Linger, 2000). The locations of all of these sources, from previously published high-resolution submillimeter or millimeter-wave observations, are indicated by crosses in Figure 1 (O’Linger et al., 1999; Looney, Mundy, & Welch, 2000; André, Ward-Thompson, and Barsony, 2000, and references therein).
We observed all of the known L1448 Class 0 protostars in the mid-infrared, and present herein images of the detected sources plus multi-wavelength photometry and/or upper limits for all five Class 0 sources.
2 Observations and Data Reduction
Low-mass Class 0 objects are generally not visible at wavelengths shorter than 10 µm using current (ground-based) technology (André, Ward-Thompson, and Barsony, 1993; Barsony, 1994). The shortest wavelengths at which these sources are generally thought to be easily detectable are in the 20 µm atmospheric window. MIRLIN, JPL’s 128x128 pixel Si:As mid-infrared camera (Ressler et al., 1994), provides access to this wavelength regime.
The observations reported here were carried out using MIRLIN at NASA’s 3-m Infrared Telescope Facility (IRTF), on the nights of 2000 Feb 18–19 UT and 2000 Oct 5 UT. For these observations, the measured pixel scale was , yielding a field of view just over 1′ on a side. To remove the thermal background signal from the sky and the telescope, the secondary mirror was chopped 28″ SE–NW at about a 5 Hz rate, and the telescope nodded the same distance and direction every few hundred chop cycles. The L1448C source and the L1448N/NW system were both observed at 12.5, 17.9, 20.8, and 24.5 µm, while L1448 IRS 2 was observed using only the latter two filters. Aur, Boo, and CMi were observed throughout each night in February, in all four passbands, both to serve as photometric calibrators and to track the weather conditions and airmass dependence. In October, Lyr was used for the same purposes. The weather was excellent in February but more variable in October.
The data were reduced using our in-house IDL routine, MAC (Match And Combine), which performs the background subtraction, identification and shifting of the source peaks, and the coaddition of the registered data. Circular aperture photometry was then performed on both the standards and the L1448 sources using apertures of radius 5 pixels ().
3 Results
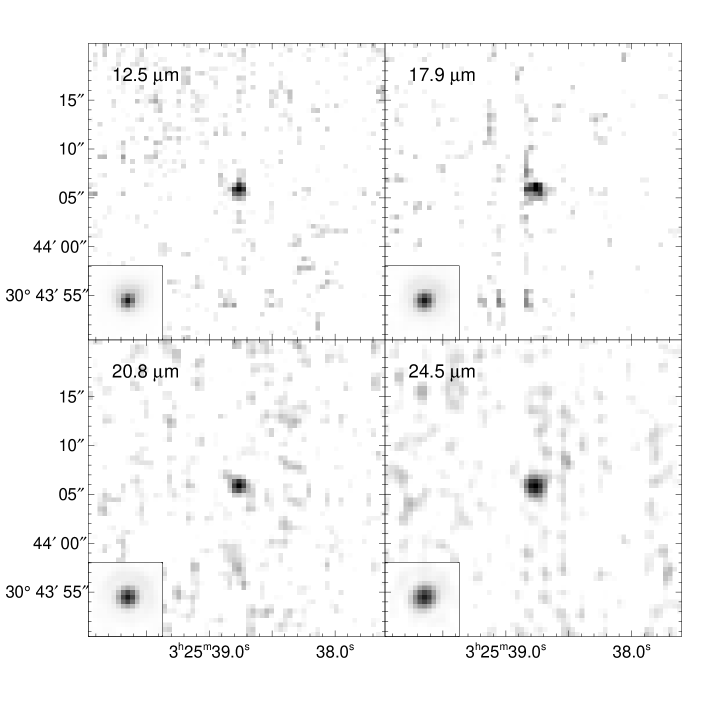
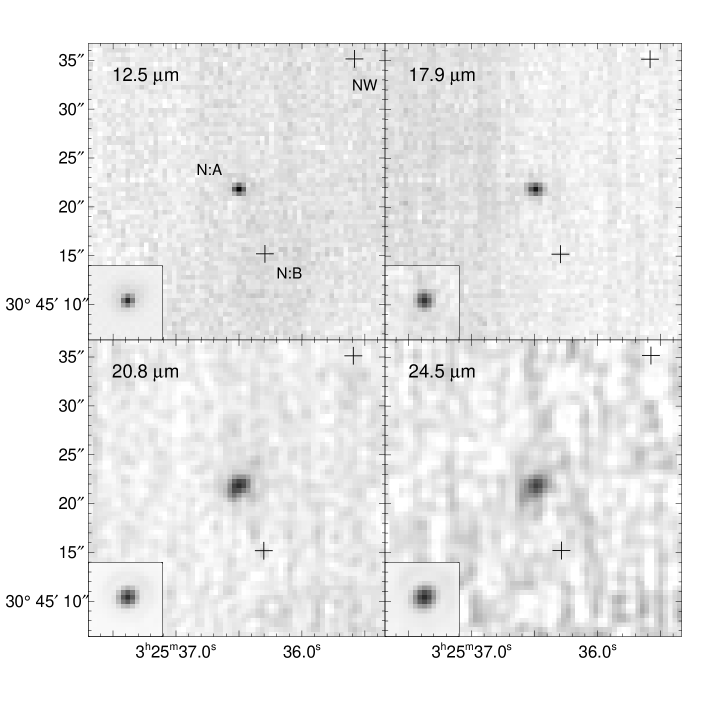
Our observations of L1448 IRS 3 are presented in Figures 2 and 3; each of the four panels is labeled with the central wavelength of the filter used, and has an image of the PSF at the appropriate wavelength shown in the lower left corner. Figure 2 shows our observations of L1448C which, at these resolutions (, , , and , at 12.5, 17.9, 20.8, and 24.5 µm, respectively), is indistinguishable from an isolated point source. Figure 3 shows our images of the rest of the sources in IRS 3, all of which lie within a single MIRLIN field of view: the 7″ binary, L1448N:A and B, and a third source 20″ away, L1448NW (Terebey & Padgett, 1997; Barsony et al., 1998; Wolf-Chase, Barsony, & O’Linger, 2000; Eislöffel, 2000; Looney, Mundy, & Welch, 2000). Although there appears to be a hint of extended emission around L1448N:A in the 20.8 and 24.5 µm images, the extension is north-west/south-east, in good alignment with the direction of the chop, and therefore is most likely an artifact of the chop pattern.
In February 2000 we detected a single source in the L1448N/NW field, at the location of L1448N:A; this was initially somewhat surprising, since N:B is actually quite a bit brighter than N:A at millimeter wavelengths. We therefore made additional observations of this field in October 2000. Using the nearby bright star BS 999 as a position reference, we find that the single source is consistent only with L1448N:A; for it to be N:B or NW would require telescope positioning errors of and (15 and 37 pixels), respectively. In Figure 3, crosses show the positions at which N:B and NW should appear. These results agree with those presented by Ciardi et al. (2003) for the L1448 N:A,B system.
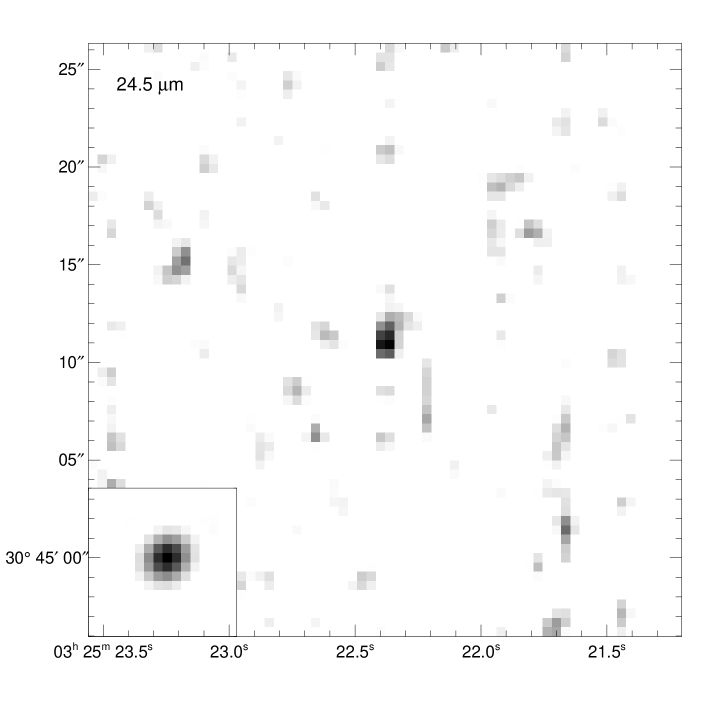
Figure 4 shows the MIRLIN image of L1448 IRS 2 at 24.5 µm, along with the PSF at that wavelength. IRS 2 was observed at 20.8 and 24.5 µm, but detected (at 4) only at the longer wavelength.
Table 1 provides the coordinates of each source and presents the MIRLIN photometry and upper limits. Coordinates for the Class 0 sources L1448N:A, N:B and NW were obtained from Looney, Mundy, & Welch (2000); the positions of L1448C and L1448 IRS 2 were taken from André, Ward-Thompson, and Barsony (2000). Errors in the photometry are dominated by the calibration uncertainties; even the most marginal detection, IRS 2, was 4. For L1448N:A and L1448C, signal-to-noise ratios varied between 6 and 23.
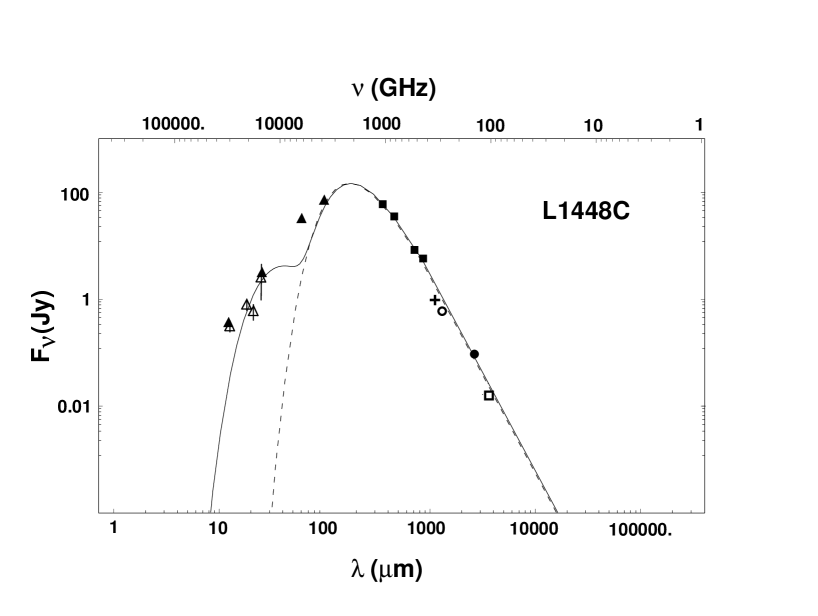
Figures 5 – 8 present SED plots for the three detected objects (L1448C, L1448N:A, and L1448 IRS 2), as well as for the undetected sources, L1448N:B and L1448NW, constrained in the mid-infrared by the MIRLIN upper limits (indicated by arrows). L1448NW, which is shown in Figure 7 for completeness, was not detected and we were unable to improve on previous upper limits in the mid-infrared that were derived from HIRES point-source modeling (Barsony et al., 1998). Previously reported data from the literature are plotted in combination with our MIRLIN fluxes. The SEDs are shown with either single or dual-greybody fits to the data. Those SED figures with dual-greybody fits (solid lines) also display single-temperature greybodies as dashed lines, each greybody being a modified blackbody of the form:
| (2) |
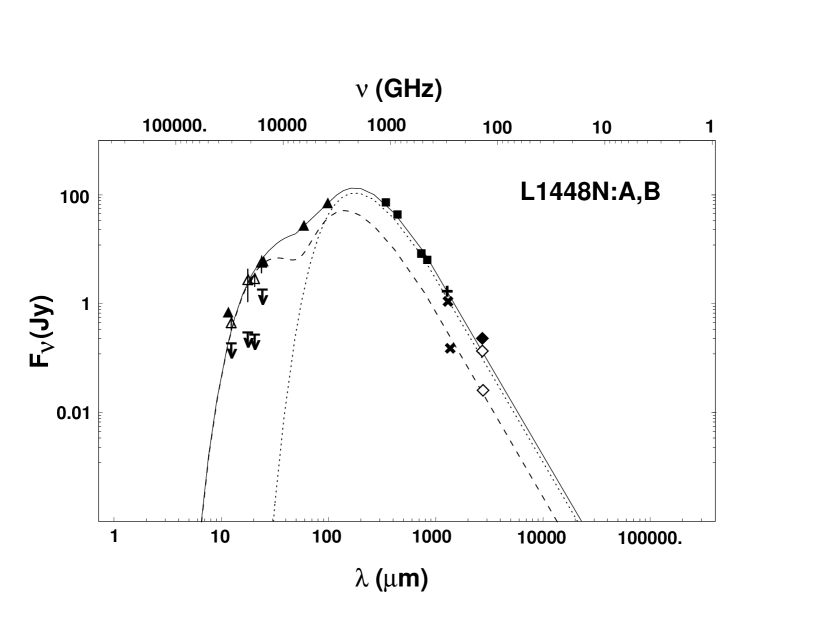
where is the Planck function at frequency and dust temperature Td, is the dust optical depth, and is the solid angle subtended by the source. The sole exception to this convention is Figure 6, which presents fits for the data from each component of the L1448N protobinary using a dashed line for N:A and a dotted line for N:B, while the solid line represents the sum of those two individual SED fits; note that this particular pair of fits to the data is not the only possible solution, and this fact is discussed at length in §4.1.2.
The various dual-greybody model fits to the data, shown by the solid lines in Figures 5 – 8, were produced by simply summing together two greybody curves, each with a different effective dust temperature. It is clearly not possible to fit all of the data points for any of the sources which were detected by MIRLIN in the mid-infrared with a single-temperature greybody. The dual-greybody curves yield more accurate calculations of the bolometric luminosities. The model fits to the flux data for each source and any necessary assumptions are discussed in detail in §4.
Table 2 lists each source, the number of greybodies (Ngb) used to fit the flux data, the associated dust temperatures (Td) for each greybody, and two physical parameters derived for these sources from the SED fitting: the bolometric luminosity, Lbol, and the infall envelope mass, Menv, estimated from (Hildebrand, 1983):
| (3) |
evaluated at mm.
Recall that dust emission is generally optically thin at millimeter wavelengths, and is therefore a direct indicator of the total mass (gas dust) contained in molecular cloud cores, given appropriate assumptions about the dust–to–gas ratio. The appropriate value of to use depends on the status or “age” of the YSOs in the core in question, due to the evolution of dust properties (André, Ward-Thompson, and Barsony, 2000). We used based on literature values for similar regions (André, Ward-Thompson, and Barsony, 1993; André & Montmerle, 1994).
In addition, the ratio of the submillimeter luminosity to the bolometric luminosity, Lsubmm/Lbol, where Lsubmm is calculated using wavelengths longer than 350 µm, was determined for each source and included in Table 2. This ratio can be used as a diagnostic tool to determine the evolutionary status of embedded YSOs, because it is linked with the ratio of the circumstellar envelope mass to the mass of the central accreting core, and thus decreases with time. A value of Lsubmm/Lbol 0.5% indicates Menv/M∗ 1, i.e. an envelope mass greater than the protostellar core mass, a distinguishing characteristic of Class 0 sources (see §1).
4 Discussion
4.1 Spectral Energy Distributions - Individual Sources
4.1.1 L1448C
This Class 0 source, which drives a powerful, highly-collimated outflow, is a favorite target of many observers (see Barsony et al., 1998, and references therein). When first discovered, it was believed to be one of the youngest Class 0 sources found, with a kinematic age (based on the outflow parameters) of 3500 years (Bachiller et al., 1990). This figure was revised upwards to 32,000 years by Barsony et al. (1998), who found that the outflow was far more extensive than previously thought (see also Wolf-Chase, Barsony, & O’Linger, 2000).
The SED for L1448C is presented in Figure 5, with a two-greybody fit to the data shown by the solid line. The dashed line indicates a single-temperature greybody fit to the data.
4.1.2 L1448N:A,B
In order to analyze the SEDs for L1448N:A and N:B, and use them to derive the parameters listed in Table 2, it is necessary to make certain assumptions regarding the individual fluxes of these two objects at far-infrared wavelengths. There are no high-angular-resolution data that can separate the 7″ protobinary components at or near the peak of the dust emission (100 µm), and this causes problems when attempting to fit modified blackbodies to the spectral energy distributions of these objects.
Due to the excellent correspondence between the 12 and 25 µm IRAS HIRES point-source model fluxes from Barsony et al. (1998) for L1448N (which represent the sums of the fluxes for both components of the protobinary) and our MIRLIN fluxes (see Figure 6), it seems clear that the mid-infrared fluxes are due chiefly to L1448N:A, with very little, if any, contribution from N:B or NW. Again, these results agree with those presented in Ciardi et al. (2003). In the millimeter, the situation is quite different: N:B produces most of the flux seen at 2.7 mm (Terebey & Padgett, 1997; Looney, Mundy, & Welch, 2000). Using HIRES modeling, Barsony et al. (1998) showed it is possible to separate the IRAS fluxes produced by L1448NW from the total flux emitted by the L1448N triple system. The L1448N system produces a total of 89 Jy at 100 µm, while the HIRES-modeled 100 µm flux from NW is 23 Jy. Therefore the maximum possible flux from the protobinary at 100 µm must be on the order of 66 Jy. Since some of the emission detected by IRAS at that wavelength is presumably due to shock-heated dust caused by the impact of the L1448C outflow on the dense core containing the L1448N protobinary, the true 100 µm flux from the binary is probably somewhat less than 66 Jy (Barsony et al., 1998; Curiel et al., 1999).
The flux ratio is approximately 5:1 in favor of N:B in the millimeter regime (Looney, Mundy, & Welch, 2000), therefore it seems reasonable to explore a range of possibilities for the 100 µm fluxes. We have done so, in the following fashion: (1) Assume that the fluxes at 100 µm have the same ratio as the 2.7 mm fluxes, so that N:A produces 11 Jy and N:B emits the remaining 55 Jy; (2) assume the inverse scenario (i.e., N:B has a flux of 11 Jy, N:A produces the other 55 Jy). These two possibilities define the endpoints of the range that we consider in this paper. A third instructive case to consider is the intermediate scenario which involves dividing the 66 Jy into equal portions; this assumes fluxes of 33 Jy at 100 µm from each of the protobinary components.
The assumptions inherent in this range of possibilities were used to generate a series of different SEDs for N:A and N:B; each of the SEDs for N:A were then fit with two-greybody models, while those for N:B were done with single-temperature greybodies. Sanity checks were performed for each case by using the various fits to calculate ranges of Lbol for the two sources, and thus to ascertain whether or not the sum of their luminosities approximates the total luminosity expected for the protobinary. The luminosity of the protobinary was derived by taking the total fluxes of the L1448N system reported in the literature and subtracting the flux data for L1448NW at all wavelengths, then plotting the resultant SED and fitting with the sum of two modified blackbodies; this yields a maximum expected Lbol of 14.1 L☉ for the protobinary system. The derivation of the L1448NW luminosity, using a single greybody fit to the data, is discussed in §4.1.3.
From the analysis described above, we find the plausible range of Lbol for L1448N:A is 3.1–6.6 L☉, and for N:B is 2.8–7.4 L☉. Since N:B dominates in the millimeter, and N:A in the mid-infrared, and the two objects have bolometric luminosities of the same order of magnitude, their SEDs must cross each other somewhere in the far-infrared, probably in the general vicinity of 100 µm. The scenario of approximately equal 100 µm fluxes thus seems the most illustrative; it yields bolometric luminosities of 4.8 L☉ for N:A, and 5.5 L☉ for N:B. The sum is indeed less than the maximum expected luminosity.
Figure 6 is a plot of the literature and MIRLIN flux data for each protobinary component along with a two-greybody fit for L1448N:A (dashed line) and a single-temperature greybody fit for N:B (dotted line) using the “equal 100 µm fluxes” scenario. The previously published data points and derived fluxes for the entire L1448N protobinary system are plotted, and the sum of the fits to the individual SEDs (i.e., dashed + dotted) is shown as a solid line. The values of the physical parameters derived from the assumption of approximately equal 100 µm fluxes (case 3) are reported in Table 2.
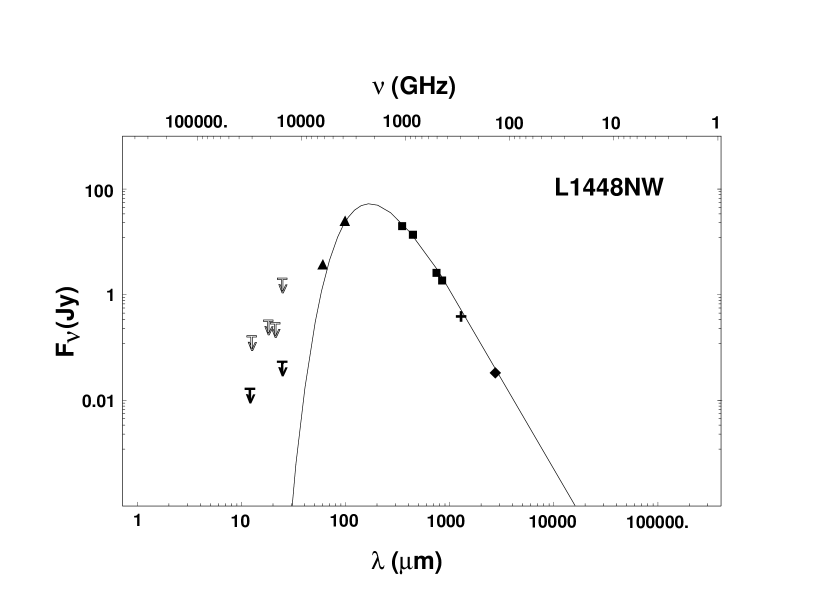
4.1.3 L1448NW
L1448NW was not detected by MIRLIN at any wavelength, as may be seen in Figure 3. This was the expected result, due to the extensive HIRES point-source modeling work reported in Barsony et al. (1998), which established IRAS upper limits for this low-luminosity source of 0.015 and 0.05 Jy at 12 and 25 µm, respectively. Our MIRLIN upper limits do not improve on these results (see Table 1).
We have incorporated the submillimeter and millimeter-wave flux data from Chandler & Richer (2000) and Looney, Mundy, & Welch (2000) in the plot shown in Figure 7; these data are entirely consistent with the FIR IRAS fluxes derived from HIRES modeling (Barsony et al., 1998). The results from a single-temperature greybody fit to the data at wavelengths longer than 60 µm are used to calculate the parameters reported in Table 2, which allow us to place L1448NW on the evolutionary diagram in Figure 9.
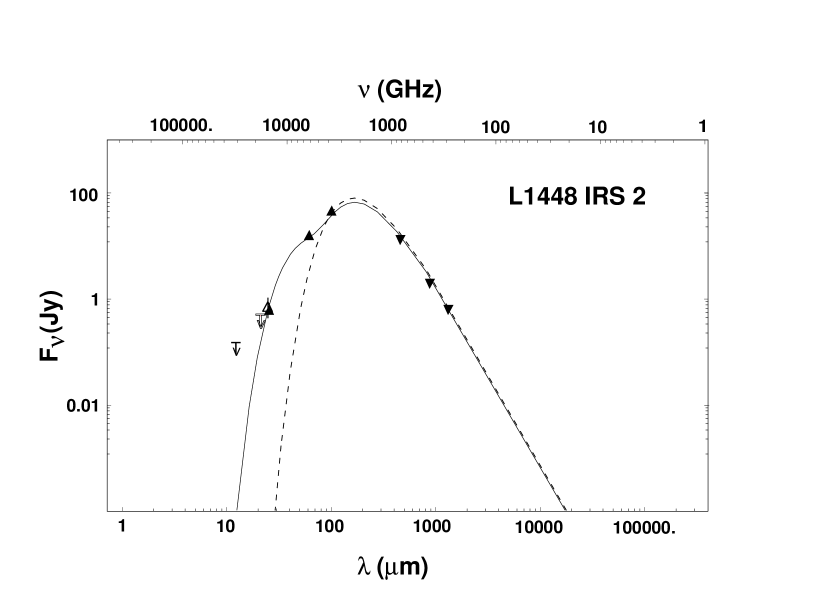
4.1.4 L1448 IRS 2
L1448 IRS 2 was identified as a Class 0 source by O’Linger et al. (1999), and first proposed as a candidate protobinary in Wolf-Chase, Barsony, & O’Linger (2000), based on CO observations which mapped two distinct molecular outflows driven by IRS 2. Volgenau et al. (2002) claimed detection of both binary components using BIMA, although the spatial separation was not reported. With the high spatial resolution of MIRLIN at the IRTF (2″ at all wavelengths), we had hoped to be able to detect and resolve both components of the system, but only a single source was found, at the 4 level in the 24.5 µm filter (see Figure 4). This suggests that either the binary components are too close together for MIRLIN to resolve (see the first paragraph of §3 for MIRLIN resolutions), or that the fluxes from one of the components are below the detection thresholds at all MIRLIN wavebands.
Figure 8 presents the SED for IRS 2, with a two-greybody fit to the data shown by the solid line. The dashed line indicates a single-temperature greybody fit to the data.
4.2 Evolutionary Status of L1448 Sources
4.2.1 Menv vs. Lbol
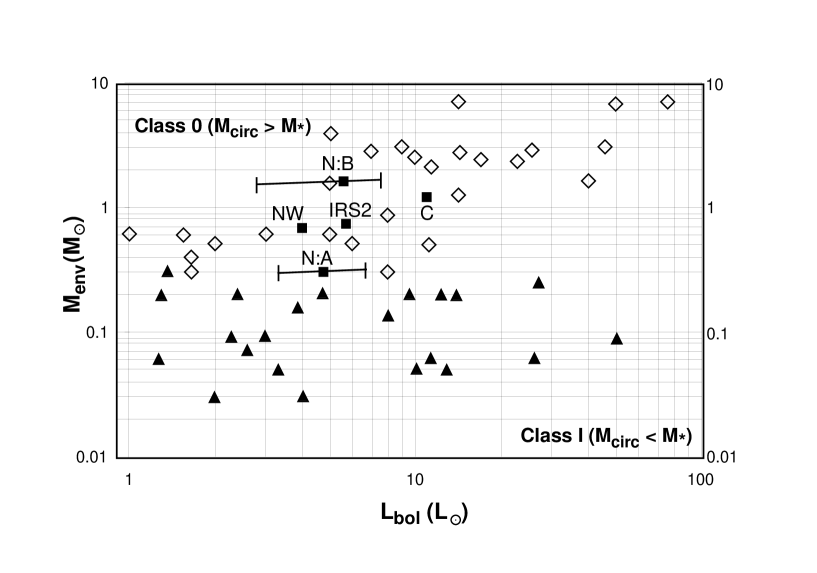
Figure 9 is a plot of Menv vs. Lbol for all of the sources in this paper (filled squares), along with all other Class 0 (open diamonds) and Class I YSOs (filled triangles) with L from Table 1 in Bontemps et al. (1996) plotted for comparison. This plot may be used as a diagnostic tool for determining the relative ages of embedded sources (André & Montmerle, 1994; Saraceno et al., 1996). The diagram shows infall envelope mass (along the vertical axis) vs. bolometric luminosity (horizontal axis). Lbol is directly related to the mass of the central protostellar core at very early stages of evolution, assuming all luminosity is generated by gravitational infall, according to:
| (4) |
where a protostellar radius of 3 R☉ is assumed (Stahler, Shu, & Taam, 1980b).
Our results depicted in Figure 9 for L1448C and L1448NW are consistent (within errors) with those presented in Barsony et al. (1998) for those two sources. The new results in the diagram presented here are (1) L1448 IRS 2 is plotted on the diagram to allow comparison with the other sources from this cloud, and (2) we have plotted the L1448N protobinary components separately on this graph, using the assumptions discussed in §4.1.2.
All of the target objects discussed in this paper lie within the Class 0 region of the evolutionary diagram in Figure 9, although L1448N:A appears to be close to the transition zone between Class 0 and Class I, indicating N:A may be the most evolved source in this cloud after the Class I source L1448 IRS 1. By the same criteria, L1448N:B is very likely the youngest source that we attempted to image in this cloud. These classifications are reflected in the values of the parameter Lsubmm/Lbol, listed in Table 2, which range from 1.7–7.3%: the value of 1.7% corresponds to L1448N:A, and 7.3% to N:B (for the case 3 scenario of equal 100 µm fluxes).
We note that recently Ciardi et al. (2003) have argued that L1448N:A is probably a Class I object. However, our smallest value of Lsubmm/Lbol for N:A, derived for case 2 (assuming 100 µm flux for N:A Jy, for N:B Jy), was 1.5%, which lies well above the lower-limit value of 0.5% established for Class 0 objects by André, Ward-Thompson, and Barsony (2000). We point out two additional factors which bolster the argument for the Class 0 status of N:A: (1) Its molecular outflow is extremely well-collimated, similar to outflows associated with other Class 0 sources (Wolf-Chase, Barsony, & O’Linger, 2000). (2) We find that it is not detected in the near-infrared by 2MASS, although the Class I source L1448 IRS 1 is strongly detected in all 2MASS bands (JHKs). Although fluxes are presented in all bands for a “source” detected by 2MASS within a few arcseconds of L1448N:A, the J-band flux is presented as an upper limit, and the H-band and K-band fluxes suffer photometric confusion. The 2MASS Quicklook images reveal a bow-shaped knot north of L1448N:A in all three bands, and an additional jet-like feature south of L1448N:A in the K-band image. Inspection of these features reveals that they correspond to H2 outflow features imaged by Eislöffel (2000). The jet-like feature in the K-band image of L1448N:A is part of the blueshifted outflow lobe associated with L1448C, which is located to the southeast of the L1448N sources. This outflow was also identified in HIRES-processed IRAS images and high-velocity CO emission (Barsony et al., 1998; Wolf-Chase, Barsony, & O’Linger, 2000) The bow-shaped knot that appears just north of L1448N:A in the J,H, & Ks 2MASS images is very prominent in the H2 image. There is no trace of a near-infrared point source counterpart to L1448N:A in the 2MASS data.
Additional near-infrared data for this source became available during a late revision of this paper: a FLAMINGOS survey of L1448 down to 17 mag (Tsujimoto, Kobyashi, & Tsuboi, 2005). Again, no near-IR counterpart to L1448N:A was found during this survey. However, these same investigators also used Chandra to observe L1448; they detected a weak X-ray source in the general vicinity of N:A. No X-ray emission was detected from any of the other Class 0 sources under discussion in this paper. Tsujimoto, Kobyashi, & Tsuboi (2005) discuss the fact that, given the non-detection in the near-infrared bands, L1448N:A must have an extremely steep near-to-mid-infrared spectral index (), and that nearly all known Class I protostars have (the single exception being the peculiar young stellar object, WL 22, with ).
We therefore contend that all currently available data for L1448N:A indicate that it is a bonafide (albeit borderline) Class 0 source; the weak X-ray detection does not rule this out, and all other data support this conclusion.
4.2.2 Effects of the L1448C Outflow on the L1448N/NW Core
Using ammonia data, Curiel et al. (1999) report that the high-velocity L1448C outflow has had a significant affect on the northern core, creating a deep “dent” in its southern edge, directly south of the protobinary. Barsony et al. (1998) suggest that the impact of the outflow from L1448C on the dense core fragmented it and actually induced the formation of the L1448N/NW system.
At first glance, this scenario of outflow-induced fragmentation appears to be at odds with our findings above that N:A is the most evolved Class 0 source in this cloud, while N:B is the youngest and most deeply embedded. Of course, if these two sources do not form a gravitationally-bound protobinary system, it is unnecessary for them to be coeval. But for the purposes of this discussion, we will assume with Terebey & Padgett (1997), Barsony et al. (1998), Eislöffel (2000), and Wolf-Chase, Barsony, & O’Linger (2000), that N:A and N:B are the bound components of a protobinary. Is it possible for presumably coeval sources, which appear to be physically similar, to travel different evolutionary paths?
One recently-proposed explanation for such a dichotemy in evolutionary status of protobinary components is found in the disintegration of unstable triple or higher-order multiple systems; such events may cause disk truncation for some of the components, subsequent episodic outflow activity linked to giant Herbig-Haro flows, and accelerated evolution of one or more components due to the rapid dissipation of circumstellar envelopes (Reipurth, 2000; Reipurth & Clarke, 2001). It is true that most of the young sources in L1448 have been identified as driving sources of parsec-scale Herbig-Haro flows (Bally et al., 1997; Barsony et al., 1998; O’Linger et al., 1999; Eislöffel, 2000; Wolf-Chase, Barsony, & O’Linger, 2000). However, at 2000 AU separation, with a rotational period on the order of 60,000 years (Terebey & Padgett, 1997), the L1448N:A,B system does not seem to fit into this particular theoretical paradigm, since a remnant binary from such a former higher-multiplicity system is predicted to have a much smaller separation. The L1448N:A,B components appear to be too young to have had time to interact with each other or with L1448NW in any significant way. Furthermore, according to the Reipurth (2000) theory, binary components that are remnants of unstable multiples having undergone ejection events might be expected to have more pronounced differences between their apparent evolutionary stages; e.g., one component may transition abruptly to Class II status, while the other remains in Class 0 or Class I. All of the L1448 sources under discussion in this paper still fall within the same evolutionary category, although N:A appears to be close to transitioning to Class I.
We propose an alternative explanation for the (admittedly minor) difference between the protobinary components: this could be nothing more than a chance side effect of the powerful L1448C outflow. Lacking a good understanding of the three-dimensional relative geometry of the sources in this cloud, we are unable to verify our hypothesis, but one possible scenario is that the outflow from L1448C has partially stripped the envelope surrounding N:A, while leaving N:B deeply embedded. This would allow N:A and N:B to be coeval sources that formed due to the impact of the L1448C outflow, while explaining the different apparent ages of these objects.
5 Summary
We have conducted a mid-infrared imaging survey of known Class 0 protostars in L1448 with MIRLIN at the IRTF, using the 12.5, 17.9, 20.8, and 24.5 µm filters. Of the five confirmed Class 0 sources in this cluster, we imaged and obtained photometry for three, including a single source that was marginally detected at 24.5 µm at the location of the protobinary in L1448 IRS 2. We report upper limits for two undetected objects.
SEDs are presented for all five sources, and are used to derive various physical properties of these sources, allowing us to place them on an evolutionary status diagram. The components of the protobinary system L1448N are plotted separately; we find that the source known as L1448N:A lies significantly closer to the Class I portion of the diagram than does its more deeply embedded companion, N:B. One possible explanation for this difference in apparent “age” may be found in the “stripping” of the envelope surrounding N:A by the L1448C outflow, which is known to be colliding with the northern core.
References
- André, Ward-Thompson, and Barsony (1993) André, Ph., Ward-Thompson, D., and Barsony, M. 1993, ApJ, 406, 122
- André & Montmerle (1994) André, Ph., and Montmerle, T. 1994, ApJ, 420, 837
- André, Ward-Thompson, and Barsony (2000) André, Ph., Ward-Thompson, D., and Barsony, M. 2000, in Protostars and Planets IV, ed. V. Mannings, A. P. Boss, and S. S. Russell
- Anglada et al. (1989) Anglada, G., Rodríguez, L., Torrelles, J., Estalella, R., Ho, P., Cantó, J., López, R., & Verdes-Montenegro, L. 1989, ApJ, 341, 208
- Aumann, Fowler, and Melnyk (1990) Aumann, H. H., Fowler, J. W., and Melnyk, M. 1990, AJ, 99, 1674
- Bachiller & Cernicharo (1986a) Bachiller, R. and Cernicharo, J. 1986a, A&A, 166, 283
- Bachiller & Cernicharo (1986b) Bachiller, R. and Cernicharo, J. 1986b, A&A, 168, 262
- Bachiller et al. (1990) Bachiller, R., Cernicharo, J., Martin-Pintado, J., Tafalla, M., and Lazareff, B. 1990, A&A, 231, 174
- Bachiller, André, & Cabrit (1991) Bachiller, R., André, P., & Cabrit, S. 1990, A&A, 241, L43
- Bachiller et al. (1995) Bachiller, R., Guilloteau, S., Dutrey, A., Planesas, P., & Martín-Pintado, J. 1995, A&A, 299, 857
- Bachiller et al. (2000) Bachiller, R., Gueth, F., Guilloteau, S., Tafalla, M., & Dutrey, A., 2000, A&A, 362, L33
- Bally et al. (1997) Bally, J., Devine, D., Alten, V., & Sutherland, R. 1997, ApJ, 478, 603
- Barsony (1994) Barsony, M. 1994, in Clouds, Cores and Low Mass Stars, ed. D. P. Clemens & R. Barvainis, ASP Conference Series, 65, 197
- Barsony et al. (1998) Barsony, M., Ward-Thompson, D., André, P., and O’Linger, J. 1998, ApJ, 509, 733
- Barsony (2000) Barsony, M. 2000, private communication
- Bontemps et al. (1996) Bontemps, S., André, P., Terebey, S., and Cabrit, S. 1996, A&A, 311, 858
- Carkner (1998) Carkner, L. 1998, Ph.D. Dissertation, Pennsylvania State University
- Chandler & Richer (2000) Chandler, C., & Richer, J. 2000, ApJ, 530, 851
- Chen et al. (1995) Chen, H., Myers, P., Ladd, E., and Wood, D. 1995, ApJ, 445, 377
- Chen et al. (1997) Chen, H., Grenfell, T., Myers, P., and Hughes, J. 1997, ApJ, 478, 295
- Ciardi et al. (2003) Ciardi, D., Telesco, C., Williams, J., Fisher, R., Packham, C., Piña, R., Radomski, J. 2003, ApJ, 585, 392
- Cohen & Kuhi (1979) Cohen, M., & Kuhi, L. 1979, ApJS, 41, 743
- Curiel et al. (1999) Curiel, S., Torrelles, J., Rodríguez, L. F., Gómez, J., & Anglada, G. 1999, ApJ, 527, 310
- Eislöffel (2000) Eislöffel, J. 2000, A&A, 354, 236
- Froebrich (2005) Froebrich, D. 2005, ApJS, 156, 169
- Greene et al. (1994) Greene, T., Wilking, B., André, P., and Young, E. 1994, ApJ, 434, 614
- Guilloteau et al. (1992) Guilloteau, S., Bachiller, R., Fuente, A., Lucas, R. 1992, A&A, 265, L49
- Hildebrand (1983) Hildebrand, R. 1983, QJRAS, 24, 267
- Hurt & Barsony (1996) Hurt, R., and Barsony, M. 1996, ApJ, 460, L45
- Lada & Wilking (1984) Lada, C. J. & Wilking, B. A. 1984, ApJ, 287, 610
- Lada (1987) Lada, C. J. 1987, in I. A. U. Symposium No. 115: Star Forming Regions, eds. M. Peimbert & J. Jugaku, (Dordrecht: Reidel), 1
- Lada (1991) Lada, C. 1991, in The Physics of Star Formation and Early Stellar Evolution, ed. C. J. Lada & N. D. Kylafis, NATO ASI Series C, 342, 329
- Ladd et al. (1991) Ladd, E., Adams, F., Casey, S., Davidson, J., Fuller, G., Harper, D., Myers, P., and Padman, R. 1991, ApJ, 366, 203
- Looney, Mundy, & Welch (2000) Looney, L., Mundy, L., and Welch, W. 2000, ApJ, 529, 477
- Molinari et al. (1998) Molinari, S., Testi, L., Brand, J., Cesaroni, R., and Palla, F. 1998, ApJ, 505, L39
- Moriarty-Schieven et al. (1994) Moriarty-Schieven, G., Wannier, P., Keene, J., and Tamura, M. 1994, ApJ, 436, 800
- Myers & Ladd (1993) Myers, P., and Ladd, E. 1993, ApJ, 413, L47
- Neckel & Staude (1984) Neckel, T., & Staude, H. 1984, A&A, 131, 200
- O’Linger et al. (1999) O’Linger, J., Wolf-Chase, G., Barsony, M., and Ward-Thompson, D. 1999, ApJ, 515, 696
- Reipurth (2000) Reipurth, B. 2000, AJ, 120, 3177
- Reipurth & Clarke (2001) Reipurth, B., & Clarke, C. 2001, AJ, 122, 432
- Ressler et al. (1994) Ressler, M. E., Werner, M. W., van Cleve, J., and Chou, H. A. 1994, Exp. Astr., 3, 277
- Saraceno et al. (1996) Saraceno, P., André, P., Ceccarelli, C., Griffin, M., & Molinari, S. 1996, A&A, 309, 827
- Stahler, Shu, & Taam (1980b) Stahler, S., Shu, F., & Taam, R. 1980, ApJ, 242, 226
- Tafalla et al. (2000) Tafalla, M., Myers, P., Mardones, D., and Bachiller, R. 2000, A&A, 359, 967
- Terebey & Padgett (1997) Terebey, S., and Padgett, D. 1997, in Herbig-Haro Flows and the Birth of Low Mass Stars, ed. B. Reipurth and C. Bertout, IAU Conference Series 182
- Tsujimoto, Kobyashi, & Tsuboi (2005) Tsujimoto, M., Kobayashi, N., and Tsuboi, Y. 2005, astro-ph 0506628 (to appear in AJ)
- Volgenau et al. (2002) Volgnau, N., Mundy, L., Evans, N., and the Spitzer c2d Legacy Project Team 2002, BAAS, 34, 1216
- Wilking, Lada, & Young (1989) Wilking, B., Lada, C., and Young, E. 1989, ApJ, 340, 823
- Wolf-Chase, Barsony, & O’Linger (2000) Wolf-Chase, G.A., Barsony, M., and O’Linger, J. 2000, AJ, 120, 1467
| Source | Coordinates (J2000.0) | F12.5 | F17.9 | F20.8 | F24.5 | |||||
|---|---|---|---|---|---|---|---|---|---|---|
| Right Ascension | Declination | |||||||||
| h | m | s | ° | ′ | ″ | (Jy) | (Jy) | (Jy) | (Jy) | |
| L1448 IRS 2 | 03 | 25 | 22.4 | 30 | 45 | 12 | 0.46 | 0.640.23 | ||
| L1448NW | 03 | 25 | 35.653 | 30 | 45 | 34.20 | 0.15 | 0.30 | 0.27 | 1.85 |
| L1448N:B | 03 | 25 | 36.339 | 30 | 45 | 14.94 | 0.15 | 0.30 | 0.27 | 1.85 |
| L1448N:A | 03 | 25 | 36.532 | 30 | 45 | 21.35 | 0.430.10 | 2.621.54 | 2.800.65 | 5.441.80 |
| L1448C | 03 | 25 | 38.8 | 30 | 44 | 05.0 | 0.290.04 | 0.730.14 | 0.550.17 | 2.371.52 |
| ††footnotetext: All upper limits are 3. | ||||||||||
| Source | Ngb | Td (K) | Lbol (L☉) | Menv (M☉) | Lsubmm/Lbol (%) |
|---|---|---|---|---|---|
| L1448 IRS 2 | 2 | 20,50 | 5.6 | 0.73 | 3.3 |
| L1448NW | 1 | 20 | 3.5 | 0.68 | 5.0 |
| L1448N:B † | 1 | 17.5 | 5.5 | 1.75 | 7.3 |
| L1448N:A † | 2 | 23,90 | 4.8 | 0.29 | 1.7 |
| L1448C | 2 | 19,85 | 10.0 | 1.10 | 3.7 |
| ††footnotetext: Parameters for L1448N:A,B are derived by assuming approximately equal 100 µm fluxes. |