RADIATIVELY INEFFICIENT ACCRETION FLOW IN THE NUCLEUS OF NGC 1097
Abstract
We present a model for the accretion flow around the supermassive black hole in the LINER nucleus of NGC 1097 which fits the optical to X-ray spectral energy distribution (SED). The X-ray segment of the SED is based on observations with the Chandra X-Ray Observatory, which are reported here for the first time. The inner part of the flow is modeled as a radiatively inefficient accretion flow (RIAF) and the outer part as a standard thin disk. The value of the transition radius (, where ) between the RIAF and outer thin disk was obtained from our previous fitting of the double-peaked Balmer emission line profile, which originates in the thin disk. The black hole mass was inferred from measurements of the stellar velocity dispersion in the host galaxy. When these parameters are used in the accretion flow model, the SED can be successfully reproduced, which shows that the line profile model and the accretion flow model are consistent with each other. A small remaining excess in the near-UV is accounted by the contribution of an obscured starburst located within 9 pc from the nucleus, as we reported in an earlier paper. The radio flux is consistent with synchrotron emission of a relativistic jet modeled by means of the internal shock scenario. In an appendix we also analyze the Chandra X-ray observations of the 1 kpc circumnuclear star-forming ring and of an ultraluminous compact X-ray source located outside the ring.
Subject headings:
accretion, accretion disks — black hole physics — galaxies: individual (NGC 1097) — galaxies: active — galaxies: nuclei1. INTRODUCTION
Active galactic nuclei (hereafter AGNs) are thought to be powered by accretion onto a supermassive black hole. The accreting matter is thought to form a thin, equatorial accretion disk, which may reveal itself observationally via its continuum emission (the “big blue bump”, produced by the sum of black body spectra from annuli in the disk at different temperatures; e.g., Frank, King & Raine 2002; Koratkar & Blaes 1999). Another possible signature of a thin accretion disk is the profile of the Fe K X-ray line, which is emitted from the inner parts of the disk and distorted by strong relativistic effects (see, for example, Fabian et al., 1989; Tanaka et al., 1995). An alternative signature, broad, double-peaked Balmer emission lines from the outer accretion disk (analogous to the lines of cataclysmic variables) has been observed in the optical spectra of some AGNs (see review by Eracleous, 1998).
Many AGNs with double-peaked Balmer lines (hereafter “double-peakers”) were discovered in the spectroscopic survey of radio-loud AGNs (Eracleous & Halpern, 1994, 2003) and by the Sloan Digital Sky Survey (Strateva et al., 2003; Wang et al., 2005). However, NGC 1097 is an important object because it was the first (and the best studied yet) case of a low-luminosity LINER nucleus to display broad, double-peaked H and H emission lines (Storchi-Bergmann, Baldwin & Wilson, 1993), with a full width at half maximum of km s-1. This discovery was followed by observations of such lines in other low-luminosity AGNs (LLAGNs), mostly with the Hubble Space Telescope (HST, Bower et al. 1996; Shields et al. 2000; Ho et al. 2000; Barth et al. 2001). The appearance of the disklike emission lines of NGC 1097 is thought to be a transient event because they were not seen in previous observations. This transient event was possibly a tidal disruption of a star by a nuclear supermassive black hole, where the debris of the disrupted star feeds the accretion flow, although other possibilities were also discussed by Storchi-Bergmann et al. (1997). Since NGC 1097 is a LLAGN, this transient phenomenon opened up the possibility that we could witness variations in the disklike emission lines on a timescale of years or even months, and the variability of the broad H lines was indeed monitored (Storchi-Bergmann et al. 1995, 2003, hereafter SB03). The observed H profiles of NGC 1097 were reproduced by kinematical models of non-axisymmetric thin accretion disks by Storchi-Bergmann et al. (1997), who inferred that the line-emitting disk is truncated at an inner radius of , where is the Schwarzschild radius and is the black hole mass, the black hole mass was measured by Lewis & Eracleous (2005) as from the stellar velocity dispersion using the Ca II near-IR triplet lines.
On the assumption that the broad double-peaked emission lines observed in AGNs originate in a thin accretion disk, an external source of illumination is needed to power them. Some compelling arguments for this have been put forward by different authors, involving the energy budget of the line-emitting region (e.g., Chen, Halpern & Filippenko 1989) and the low temperatures achieved by the disk under local viscous dissipation (Collin-Souffrin, 1987). For instance, considering the energy budget of the thin disk in a small sample of radio-loud double-peakers (Eracleous & Halpern, 1994, 2003), the disk can power its own lines only if virtually all the energy available locally is converted into recombination lines, which is unlikely (Chen, Halpern & Filippenko 1989). The presence of an inner, inflated, radiatively inefficient accretion flow (RIAF, see reviews by Quataert 2001; Narayan, Mahadevan & Quataert 1998, hereafter NMQ98) emitting an X-ray continuum which illuminates the outer thin disk solves all these energetic problems, as was proposed initially by Chen & Halpern (1989) in the form of the ion torus (an early version of current RIAF models; see Rees et al., 1982).
While spectral models of RIAFs have successfully accounted for the spectral energy distributions (hereafter SEDs) of a handful of LINERs (Lasota et al. 1996; Quataert et al. 1999; Ptak et al. 2004, but see Yuan et al. 2002; Herrnstein et al. 2005 in the case of NGC 4258), RIAFs have yet to be studied in a double-peaker LLAGN. The reason for this is that there was no object until now which had both good observations of the nuclear SED and displayed disklike broad emission lines. We have now such observations for NGC 1097, which have allowed us to investigate the structure of the accretion flow in the nucleus by comparing the observed broadband SED with predictions from theoretical models in which the plasma at small radii is in the form of a RIAF and the outer parts of the flow are a standard thin disk. We explore the conditions under which the parameters of the thin disk inferred from the H profile model presented by SB03 are consistent with the modelling of the continuum. In § 2 we describe the multiwavelength data comprising the SED, including new X-ray observations as well as previously published data in the optical/ultraviolet, infrared and radio wavebands. In § 3 we derive several properties of the SED, such as the degree of radio-loudness and the bolometric and X-ray luminosities, and we compare the SED of NGC 1097 with the typical SEDs of quasars and LLAGNs. In § 4 we discuss the accretion flow model and compare its predictions with the observations. We discuss our results in § 5 and present our conclusions in § 6. Throughout this paper we assume a distance111We note that Storchi-Bergmann et al. (2005) assumed a distance to NGC 1097 of 17 Mpc. We choose the distance 14.5 Mpc in order to compare directly our results for the SED with those of Ho et al. (2000), who adopt the latter distance to NGC 1097. Furthermore, this difference in the assumed distance does not change our conclusions and its effect is within flux calibration uncertainties. to NGC 1097 of 14.5 Mpc, thus pc. In an appendix, we present a spectral analysis of the 1 kpc starforming ring and of an ultraluminous compact X-ray source located outside the ring.
2. OBSERVATIONS
In order to construct the SED of the nucleus of NGC 1097, we have used X-ray observations from the Chandra X-ray Observatory and near-UV and optical observations from the Hubble Space Telescope (HST). We have also collected infrared and radio fluxes from the literature. The sections below describe the data in detail.
2.1. X-RAY DATA
NGC 1097 was observed with the backside illuminated ACIS-S3 CCD aboard the Chandra X-ray Observatory on June 28, 2001. Table 1 gives a log of the Chandra observations.
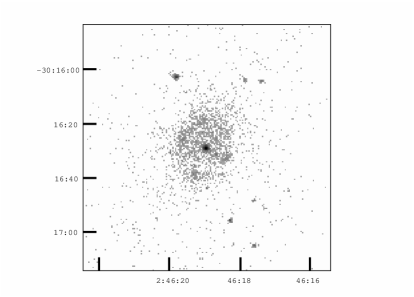
Figure 1 shows the image of the central region of the galaxy in the 0.5–8.0 keV band, which illustrates the extended emission morphology. The nucleus (black spot in the center) and circumnuclear region (including the star-forming ring at ) are clearly seen in the image. An ultraluminous compact X-ray source (ULX) is observed at NNE from the nucleus. The properties of the star-forming ring and ULX are discussed in the Appendix.
An X-ray spectrum of the nucleus was extracted from a circular region of radius . The effect of pile up is too large in the first observation to measure reliable spectral shape and flux. The second observation is also affected by pile up, but the effect was relatively small because the detector was operated in 1/8 sub-array mode. We accounted for pile-up by applying the pile-up model implemented in the XSPEC222http://heasarc.gsfc.nasa.gov/docs/xanadu/xspec spectral-fitting package.
Spectral fits were performed to the X-ray spectrum, using a minimization technique. Acceptable fits were obtained using a power-law model (, where is a photon flux in units of and is the photon index) modified by photoelectric absorption along the line of sight. Figure 2 shows the observed spectrum of the nucleus with the best-fit model superposed. The model parameters for this fit are listed in Table 2, where is the hydrogen column density and is the observed flux in the 2–10 keV band corrected for absorption. The value of the photon index is consistent with the typical values observed in LLAGNs (; see, e.g.,Terashima et al. 2002; Terashima & Wilson 2003). The X-ray spectrum of the nucleus does not have a high enough signal-to-noise ratio to constrain spectral features such as Fe K emission.

The ASCA observation (Iyomoto et al., 1996; Terashima et al., 2002) includes all of the nucleus, the starforming ring and the ULX due to its poor angular resolution. The hard component detected with ASCA is most likely dominated by the nucleus, because the number of 2–8 keV photons from a few faint off-nuclear sources and the weak hard emission from the starforming ring is about 10% that of the nucleus, thus the ASCA spectral fits are reliable measures of the spectral shape of the nucleus. The hard band flux obtained with ASCA ( in the 2–10 keV band or in the 2–8 keV band, corrected for absorption) is consistent with the Chandra nuclear flux if the ASCA calibration uncertainty (10 %) and a small contribution from the off-nuclear hard X-ray emission are taken into account.
2.2. OPTICAL/UV DATA
The nucleus of NGC 1097 was observed with the Space Telescope Imaging Spectrograph (STIS) in February 2001 in the wavelength range 1000 Å–1 m, using a wide and long slit. The details of these observations are described in Storchi-Bergmann et al. (2005) (hereafter SB05), who have used these data to infer the presence of a starburst within 9 pc from the nucleus. The nuclear spectrum used in the present work was extracted using a window of , the latter corresponding to 12 pixels along the slit. Figure 1 of SB05 shows the nuclear spectrum, where the characteristic broad double-peaked emission lines can be seen.
In order to obtain the intrinsic optical-to-UV (OUV) nuclear continuum, we have to correct the spectrum for the effects of dust extinction. The Galactic extinction affecting the HST spectrum is (Schlegel, Finkbeiner & Davis, 1998). On the other hand, the neutral hydrogen column density measured from the X-ray spectral fit is (§ 2.1). Using the relation mag (Bohlin, Savage & Drake, 1978) we obtain mag. Subtracting the contribution of the Galactic reddening above, the resulting internal reddening is mag, which is very small. Adopting the total reddening affecting the observations is mag, which implies only small extinction corrections to the spectrum using the Galactic reddening law.
2.3. INFRARED AND RADIO DATA
Data in the infrared (IR) and radio were collected from the literature and are listed in Table RADIATIVELY INEFFICIENT ACCRETION FLOW IN THE NUCLEUS OF NGC 1097. NGC 1097 has a luminous circumnuclear ring of star formation of radius (Storchi-Bergmann, Wilson & Baldwin, 1996). Most data available in the literature were obtained using an aperture which includes this circumnuclear ring, and the fluxes so measured can only be considered as upper limits to the nuclear emission. Therefore we decided not to include such observations in the SED, including those made with the IRAS and ISO satellites (apertures in the range ). The only data points we include in the SED are those corresponding to apertures smaller than .
3. THE SPECTRAL ENERGY DISTRIBUTION
We show in Figure 3 the complete SED obtained by combining the Chandra, HST, infrared and radio data obtained through apertures smaller than . We notice that there is a discontinuity between the IR and optical data. We believe this is due to additional components not included in our HST data (e.g. hot dust), and thus these points are treated as upper limits to the nuclear emission and are represented by open circles. The filled circle is a radio data point observed with a small beam ().

In order to estimate the various quantities which characterize the SED, we must deal with regions of the spectrum for which we have no data available. Thus, we interpolate the SED with six power-laws of the form , one for each relevant frequency interval, as shown by the long-dashed line in Figure 3. The radio to infrared power-law was obtained by connecting the radio luminosity value at 8.4 GHz to the average value of the normalized LLAGN SED at Hz. The infrared to optical power-law was obtained by connecting the former point to the optical luminosity value at 1 m. The OUV power-laws were obtained by fitting the data using least squares. The power-law between Hz and 2 keV was obtained by connecting the former point to the latter one. The best-fit X-ray power-law is used between 2 keV and 100 keV, above 100 keV the SED is described by an exponential cutoff.
3.1. Properties of the SED
We use the interpolated piece-wise power-law described in the previous section to calculate several properties of the SED: the radio loudness, bolometric luminosity, X-ray luminosity and various useful spectral indices, as follows.
Radio loudness – The radio loudness can be quantified using two different parameters: an optical to radio ratio defined as (Kellermann et al., 1989) and a radio to X-ray ratio defined as , where is the luminosity in the 2 – 10 keV band (Terashima & Wilson, 2003). The boundary between radio-loud and radio-quiet objects corresponds to and . NGC 1097 is marginally radio-loud according to both criteria (, ), much like other LLAGNs previously studied (Ho, 1999; Ho & Peng, 2001; Ho, 2002a; Terashima & Wilson, 2003). Ho et al. (2000) have quoted a value of , indicating a somewhat larger degree of radio-loudness, but they do not specify what data they used to derive this value.
Bolometric luminosity – The bolometric luminosity is . This value is well within the range observed for other LLAGNs (, from Ho 1999). Adopting a black hole mass of (Lewis & Eracleous, 2005), we obtain an Eddington ratio of , where , (where is the black hole mass in units of ). For comparison, Ho (1999) quotes a value for this ratio in the interval for LLAGNs. and are approximately two times smaller than the values quoted by Ho et al. (2000).
X-ray luminosity – The X-ray luminosity in the 2 – 10 keV band is , which is in the interval of X-ray luminosities of LLAGNs studied by Terashima & Wilson (2003), . The ratio of to narrow H luminosity is 300, where the narrow H luminosity is , measured from the HST spectrum. This ratio somewhat exceeds the range of values estimated by Terashima & Wilson (2003), 0.27 – 104. The ratio of X-ray luminosity in the 0.5 – 10 keV band to is 0.08, which is within the range of values found by Ho (1999) for LLAGNs, 0.06 – 0.33.
Spectral indices – The value of the energy index of the continuum in the hard X-ray band (2–10 keV) can be obtained from the photon index (§ 2.1) using the relation . We measured the value of the power-law index of the OUV continuum in § 2.2 as being 1.87. The two-point spectral index from 2500 Å– 2 keV is 1.14, which is similar to the mean value found by Ho (1999) for LLAGNs, .
3.2. Comparison with SEDs of other AGNs
Figure 3 shows the SED of NGC 1097 together with the average SED of LLAGNs from Ho (2005) and average SEDs of radio-loud and radio-quiet quasars from Elvis (1994). All curves are normalized at the 2 keV luminosity of NGC 1097.
In Figure 3 it can be seen that in spite of NGC 1097’s SED being more radio-quiet than the average SED of LLAGNs, the general shape of NGC 1097’s SED is similar to this mean SED. This result has been verified quantitatively in the previous section through the similarity between the values of the spectral indices from the two SEDs. It can also be seen in Figure 3 that the continuum of NGC 1097 lacks the canonical UV bump commonly present in quasars, which is associated with emission from a geometrically thin, optically thick accretion disk (Frank, King & Raine, 2002). This was already noted in the particular case of NGC 1097 by Ho et al. (2000) and more generally in LLAGNs by Ho (1999), and indicates an absence or truncation of the inner thin accretion disk in these objects. The latter interpretation will be favored in the modelling of the next section.
4. MODELS FOR THE SED
The observational characteristics of NGC 1097 described in Section § 3 (and in general of LLAGNs; see Ho 2005 for a review) can be understood within the theoretical framework of RIAFs (see reviews by Quataert 2001; Narayan 2005; early versions of RIAF models were called ADAFs or “ion tori”; see NMQ98, Kato, Fukue & Mineshige 1998 for reviews). RIAFs are optically thin, geometrically thick accretion flows that have radiative efficiencies much less than the canonical 10% of thin disks and thus naturally generate low luminosities. RIAFs are thought to arise when the mass accretion rate is below a critical value (NMQ98). A low Eddington ratio is a requirement for the existence of RIAFs (; see, e.g., NMQ98) and the low ionizing luminosities produced by RIAFs coupled with the typical densities of the narrow line region lead naturally to low values of the ionization parameter , which consequently give rise to LINER-like spectra (Halpern & Steiner, 1983; Ferland & Netzer, 1983).
In view of these indications, the model we adopt consists of an inner RIAF plus an outer standard thin disk, which has been successful in reproducing the SEDs of different kinds of sources, including black hole X-ray binaries, Sgr A*, LLAGNs in elliptical galaxies and LINERs (for reviews, see Quataert 2001; Narayan 2005). We incorporate in the modelling of the RIAF recent theoretical advances. As already predicted in the pioneering papers Narayan & Yi (1994, 1995), and confirmed by recent numerical simulations (Stone et al., 1999; Hawley & Balbus, 2002; Igumenshchev et al., 2003; Proga & Begelman, 2003) and analytical calculations (Blandford & Begelman, 1999; Narayan et al., 2000; Quataert & Gruzinov, 2000a), only a small fraction of the gas supplied at large distances from the RIAF actually falls on to the black hole, the rest of the gas is either ejected in an outflow (advection-dominated inflow/outflow solution [“ADIOS”]) or is prevented from accreting by convective motions (convection-dominated accretion flow [CDAF]).
Given the theoretical uncertainties on the structure and microphysics of the flow, we follow Blandford & Begelman (1999) and assume that the mass accretion rate varies with radius as , where is the accretion rate at the transition radius between the inner RIAF and the outer thin disk. The exponent and the fraction of the turbulent energy that heats the electrons, , are free parameters in our model. This assumption has been recently confirmed by MHD simulations (e.g., Proga & Begelman 2003).
We assume (Lewis & Eracleous, 2005), , where is the outer radius of the thin disk, and (SB03) is the inclination of the axis of the disk to the line of sight. We set the plasma parameter (ratio of gas to total pressure) to the value (for motivation, see Quataert & Narayan 1999b) and we determine the value of the viscosity parameter from using the equation (NMQ98, Hawley, Gammie & Balbus 1996). We adjust the accretion rate to reproduce the observed X-ray flux, and hereafter we use the accretion rate in Eddington units (). We solve the radiative transfer and hydrodynamical equations of the RIAF self-consistently, obtaining the emergent spectrum (see Yuan, Quataert & Narayan 2003 for details). The radiative processes considered in the RIAF are synchrotron and bremsstrahlung emission, and Comptonization of these photons and the soft photons from the outer thin disk. The thin disk is assumed to emit locally as a blackbody and reprocesses X-ray photons from the RIAF.
The value of the transition radius was obtained from fitting the double-peaked H line profile with disk models as (SB03). On the other hand, there is also an independent constraint on from fitting the SED with the accretion flow model, i.e. the value of must be suitable to fit the OUV spectrum. We set the value of to be that obtained from the line profile fitting, i.e. .
In Figure 4 we show the predicted spectrum of the accretion flow for ( in Eddington units), and ; the solid line shows the RIAF contribution and the dashed line shows the emission of the truncated thin disk. It is encouraging that we obtain a good fit of the optical and X-ray portion of the SED using the value of derived from the line profile model, i.e. our models for the SED and the line profile are consistent with each other!

As shown by Quataert & Narayan (1999a), when comparing spectral models of RIAFs with observations, there are degeneracies between the mass-loss rate in the wind (parameter ) and parameters describing the microphysics of the RIAF, particularly , so the fits to the data presented here are not unique; instead they should be treated as representative models. For example, we can fit the SED equally well with an ADAF model, where and . It is worth noting that there are theoretical uncertainties on the value of (Quataert & Gruzinov, 1999), and that as the accretion rate increases, it is expected that outflows/convection become less well developed, because the Bernoulli parameter decreases with increasing .
The accretion flow model severely underpredicts the radio emission and underpredicts to a small degree the higher frequency UV data. Underprediction of radio data is common in RIAF models (e.g., Quataert et al., 1999; Ptak et al., 2004; Ulvestad & Ho, 2001; Anderson et al., 2004; Wu & Cao, 2005), and the radio emission would be enhanced if the source has a jet (e.g., Yuan, Markoff & Falcke 2002; Yuan et al. 2002; Yuan, Cui & Narayan 2005, hereafter YCN05) or if the RIAF has nonthermal electrons (Mahadevan, 1999; Özel, Psaltis & Narayan, 2000; Yuan, Quataert & Narayan, 2003). To test the possibility that the observed radio emission comes from a jet, we use the model for the jet emission of YCN05, which adopts the internal shock scenario widely employed in the interpretation of gamma-ray burst afterglows. Since the only constraint on the jet emission is the observed radio flux at 8.4 GHz, we assume that the most basic parameters have the same values as in YCN05. Namely the half-opening angle is , the energy density of accelerated electrons is , and the amplified magnetic field energy density is . The bulk Lorentz factor of the jet is , the viewing angle is (same as the inclination angle of the thin accretion disk inferred by SB03) and the mass-loss rate in the jet is , which is about 0.5% of the mass accretion rate of the ADIOS at 5 . The resulting jet spectrum is shown in Figure 4 as the dotted line. We see that this jet model accounts for the available high-resolution radio data. The radio band is dominated by the jet, and the jet emission becomes less important in the rest of the SED compared to the accretion flow emission. We note that as we have so few constraints on the jet emission, the jet parameters are not as well constrained as those of the accretion flow models, although the results are not very dependent on the values of the jet parameters.
The discrepancy between the model and the observed UV flux can be resolved by invoking the contribution of a compact starburst to the observed UV spectrum, as found by SB05. The starburst has a mass of approximately 106 solar masses, an age of at most a few 106 yrs and is obscured by . The signatures of the starburst include a number of absorption features in the 1000–1600 Å spectral region and the continuum contribution illustrated in Figure 4 as the dot-dashed line. Included in the theoretical SED is an Fe II template broadened according to the width of the Balmer lines, which accounts for the observed bump around 2500 Å (see SB05 for details). This UV Fe II emission presumably comes from the thin disk.
We note that while the starburst is reddened by mag, the X-ray data, the double-peaked lines (including the UV Mg II lines) and our successful modelling suggest that the AGN is unobscured, supporting the suggestion by SB05 that the starburst could be in a circumnuclear dusty structure, which does not intercept our line of sight to the nucleus.
We also notice (see Figure 4) that our best model somewhat overpredicts the luminosity of the UV end of the HST spectrum. This part of the spectrum is very sensitive to the amount of dust extinction. If the value of is slightly larger, then the intrinsic UV flux would be higher than the adopted one and would agree better with the model. Interestingly enough, Prieto et al. (2005) measured within the central pc region, a higher extinction than the value adopted in this work. We can obtain a small improvement in the fit of the UV end varying the parameters and of the RIAF model, but in that case the quality of the fit at the red end of the HST spectrum will worsen.
5. DISCUSSION
The adopted transition radius () is similar to the typical values found in available RIAF + thin disk models of LINER SEDs (NGC 4579 and M81: , Quataert et al. 1999; NGC 4258: , Gammie, Narayan & Blandford 1999; NGC 3998: , Ptak et al. 2004).
We tried to fit the OUV data with a model of a thin disk extending down to the ISCO at 3 . Although a model with fits the UV data, it cannot account for lower frequency optical data and it would imply that of is due to X-rays (possibly emitted by a corona above the disk), something very unusual for an AGN (e.g., Haardt & Maraschi 1993). This fit shows that truncation of the thin disk is definitely needed in order to obtain a consistent picture for the nature of the low optical flux, as found in similar models of other LINERs (e.g., Quataert et al. 1999; Ptak et al. 2004).
Yuan & Narayan (2004) (hereafter YN04) assembled a plot showing the dependence of on for many accreting black hole sources fitted with RIAF models, including for example Sgr A∗, X-ray binaries and LLAGNs (Figure 3 of YN04). This plot relates two fundamental properties of accreting black holes and provides a way of putting in context these sources. Interestingly enough, when the corresponding values of NGC 1097 are inserted in this plot, we find that NGC 1097 falls within the relation found by YN04, and is located very close to other LINERs previously modeled with RIAFs (M81 and NGC 4579, Quataert et al. 1999).
Using the estimated accretion rate from the accretion flow model and the black hole mass, we can make an estimate of the gravitational power output of the thin disk as , which is higher than the H luminosity by two orders of magnitude. Although this calculation suggests that in the particular case of NGC 1097 the energy budget of the thin disk is such that the disk could power locally its own emission lines, the direct conversion of gravitational energy into line emission is improbable, because most of the binding energy of the thin disk is radiated in the form of a weakly ionizing IR/optical bump which is not capable of photoionizing the atmosphere of the thin disk and therefore cannot contribute to the formation of the broad double-peaked emission lines. Furthermore, there are theoretical uncertainties in the accretion flow model which affect the determination of .
Current observations do not allow us to distinguish between the different RIAF models, although there are strong theoretical reasons favoring ADIOS / CDAF (e.g., Quataert 2001) over to ADAF models. There are some future observations that may help us assess the importance of outflows in RIAFs. For instance, the absence of linear polarization in the high-frequency radio spectrum of NGC 1097 would argue in favor of ADIOS/CDAF models, even in the presence of a jet (Quataert & Gruzinov, 2000b). This would be attainable with high-frequency VLBI interferometry. More radio observations to constrain the shape of the radio spectrum are also needed to verify whether it is consistent with the predictions of the assumed jet model.
6. SUMMARY AND CONCLUSIONS
We have reproduced the nuclear optical to X-ray SED of NGC 1097, composed of HST and Chandra observations, using a model in which the accretion flow consists of an optically thin, geometrically thick RIAF for radii smaller than the transition radius and an optically thick, geometrically thin disk for larger radii. The value of is the same as the inner disk radius obtained from fitting the double-peaked H line profile (SB03) and the value of the black hole mass is that inferred from the stellar velocity dispersion of the host galaxy. Thus, an important result of this work is the consistency between the result of fitting the SED with the accretion flow model and the double-peaked Balmer line with the thin disk model, i.e. we obtain acceptable fits of these two different data sets with the same transition radius.
The accretion flow model underpredicts slightly the UV continuum, but the added contribution of a young and obscured starburst of mass (SB05) can account for the excess UV emission. The accretion model also underpredicts the radio emission, suggesting the need for a jet component. We have been able to reproduce the radio data with a jet model employing the internal shock scenario (YCN05), although the jet parameters are not as well constrained as those of the accretion flow models, because we have few constraints on the jet emission.
The results of this work support the proposal that the basic components of the nuclei of LLAGNs are a RIAF, a truncated thin disk and a jet (e.g., Ho 2005), with the possibly important role of starbursts presumably obscured by the circumnuclear torus predicted in the unified model of AGNs.
Appendix A X-RAY SPECTRA OF CIRCUMNUCLEAR STAR-FORMING REGION AND ULTRALUMINOUS COMPACT X-RAY SOURCE
X-ray spectra of the circumnuclear star-forming region at from the nucleus333Note that this is not the nuclear starburst found by SB05 and the ULX were taken with the Chandra X-ray Observatory. These were analyzed as described in the main text, with the following results.
Figure 5 shows the spectrum of the circumnuclear star-forming region. Since the emission is diffuse, the effect of pile up is negligible for both observations. We performed spectral fits to the combined spectrum of the two observations. We applied a MEKAL plasma model to the spectrum, but the resulting fit was unacceptable, with significant positive residuals remaining above 2 keV. For this fit, we obtained , , and an abundance of times solar (with for 62 dof).
Since the simple MEKAL model fit was poor, we added a hard component to the model, represented by a thermal bremsstrahlung model with . This model has been successfully applied in the case of superposition of emission from low-mass X-ray binaries (Makishima et al., 1989) and results in a better fit to the spectrum, as illustrated in Figure 5. The parameters for the spectral fit are listed in Table 2.
The ULX has a spectral shape and flux in the two observations which are consistent with each other within statistical errors. Figure 6 shows the spectrum of the ULX. Spectral fits were performed to the combined spectrum of the two observations using a maximum-likelihood method. A power law model gives a better fit than a multi-color disk blackbody model (MCD). The resulting parameters for the power law model are listed in Table 2, assuming the object is associated with NGC 1097.


References
- Anderson et al. (2004) Anderson, J. M., Ulvestad, J. S., & Ho, L. C. 2004, ApJ, 603, 42
- Antonucci (1993) Antonucci, R. 1993, ARA&A, 31, 473
- Barth et al. (2001) Barth, A. J., Ho, L. C., Filippenko, A. V., Rix, H.-W., & Sargent, W. L. W. 2001, ApJ, 546, 205
- Blandford & Begelman (1999) Blandford, R. D., & Begelman, M. C. 1999, MNRAS, 303, L1
- Bohlin, Savage & Drake (1978) Bohlin, R. C., Savage, B. D., & Drake, J. K. 1978, ApJ, 224, 132
- Bower et al. (1996) Bower, G. A., Wilson, A. S., Heckman, T. M., & Richstone, D. O. 1996, AJ, 111, 1901
- Chen, Halpern & Filippenko (1989) Chen, K., Halpern, J. P., & Filippenko, A. V. 1989, ApJ, 339, 742 (CHF89)
- Chen & Halpern (1989) Chen, K., & Halpern, J. P. 1989, ApJ, 344, 115
- Collin-Souffrin (1987) Collin-Souffrin, S. 1987, A&A, 179, 60
- Elvis (1994) Elvis, M., et al. 1994, ApJS, 95, 1
- Eracleous & Halpern (1994) Eracleous, M., & Halpern, J. P. 1994, ApJS, 90, 1
- Eracleous & Halpern (2003) ———. 2003, ApJ, 599, 886
- Eracleous (1998) Eracleous, M. 1998, Adv. Space Res., 21, 33
- Fabian et al. (1989) Fabian, A. C., Rees, M. J., Stella, L., & White, N. E 1989, MNRAS, 238, 729
- Ferland & Netzer (1983) Ferland, G. J., & Netzer, H. 1983, ApJ, 264, 105
- Frank, King & Raine (2002) Frank, J., King, A. R., & Raine, D. J. 2002, in Accretion Power in Astrophysics (3d ed.; Cambridge: Cambridge Univ. Press)
- Gammie, Narayan & Blandford (1999) Gammie, C. F., Narayan, R., & Blandford, R. 1999, ApJ, 516, 177
- Glass & Moorwood (1985) Glass, I. S., & Moorwood, A. F. M. 1985, MNRAS, 214, 429
- Haardt & Maraschi (1993) Haardt, F., & Maraschi, L. 1993, ApJ, 413, 507
- Halpern et al. (1996) Halpern, J. P., Eracleous, M., Filippenko, A. V., & Chen, K. 1996, ApJ, 464, 704
- Halpern & Steiner (1983) Halpern, J. P., & Steiner, J. E. 1983, ApJ, 269, L37
- Hawley & Balbus (2002) Hawley, J. F., & Balbus, S. A. 2002, ApJ, 573, 738
- Hawley, Gammie & Balbus (1996) Hawley, J. F., Gammie, C. F., & Balbus, S. A. 1996, ApJ, 464, 690
- Herrnstein et al. (2005) Herrnstein, J. R., et al. 2005, ApJ, in press (astro-ph/0504405)
- Ho (1999) Ho, L. C. 1999, ApJ, 516, 672
- Ho (2002a) ———. 2002, ApJ, 564, 120
- Ho (2005) ———. 2005, To appear in From X-ray Binaries to Quasars: Black Hole Accretion on All Mass Scales, ed. T. J. Maccarone, R. P. Fender, and L. C. Ho (Dordrecht: Kluwer) (astro-ph/0504643)
- Ho et al. (2000) Ho, L. C., et al. 2000, ApJ, 541, 120
- Ho & Peng (2001) Ho, L. C., & Peng, C. Y. 2001, ApJ, 555, 650
- Igumenshchev et al. (2003) Igumenshchev, I. V., Narayan, R., & Abramowicz, M. A. 2003, ApJ, 592, 1042
- Iyomoto et al. (1996) Iyomoto, N., Makishima, K., Fukazawa, Y., Tashiro, M., Ishisaki, Y., Nakai, N., & Taniguchi, Y. 1996, PASJ, 48, 231
- Kato, Fukue & Mineshige (1998) Kato, S., Fukue, J., & Mineshige, S. 1998, Black-Hole Accretion Disks (Japan: Kyoto Univ. Press)
- Kellermann et al. (1989) Kellermann, K. I., Sramek, R. A., Schmidt, M., Shaffer, D. B., & Green, R. F. 1989, AJ, 98, 1195
- Koratkar & Blaes (1999) Koratkar, A., & Blaes, O. 1999, PASP, 111, 1
- Lasota et al. (1996) Lasota, J.-P., Abramowicz, M. A., Chen, X., Krolik, J, Narayan, R., & Yi, I. 1996, ApJ, 462, 142
- Lewis & Eracleous (2005) Lewis, K., & Eracleous, M. 2005, ApJ, submitted
- Mahadevan (1999) Mahadevan, R. 1999, MNRAS, 304, 501
- Makishima et al. (1989) Makishima, K., et al. 1989, PASJ, 41, 697
- Narayan & Yi (1994) Narayan, R., & Yi, I. 1994, ApJ, 428, L13
- Narayan & Yi (1995) ———. 1995, ApJ, 444, 231
- Narayan et al. (2000) Narayan, R., Igumenshchev, I. V., & Abramowicz, M. 2000, ApJ, 539, 798
- Narayan, Mahadevan & Quataert (1998) Narayan, R., Mahadevan, R., & Quataert, E. 1998, in The Theory of Black Hole Accretion Disks, ed. M. A. Abramowicz, G. Björnsson, & J. E. Pringle (Cambridge: Cambridge Univ. Press), 148 (NMQ98)
- Narayan (2005) Narayan, R. 2005, To appear in From X-ray Binaries to Quasars: Black Hole Accretion on All Mass Scales, ed. T. J. Maccarone, R. P. Fender, and L. C. Ho (Dordrecht: Kluwer) (astro-ph/0411385)
- Özel, Psaltis & Narayan (2000) Özel, F., Psaltis, D., & Narayan, R. 2000, ApJ, 541, 234
- Prieto et al. (2005) Prieto, M. A., Maciejewski, W., & Reunanen, J. 2005, AJ, 130, 1472
- Proga & Begelman (2003) Proga, D., & Begelman, M. C. 2003, ApJ, 592, 767
- Ptak et al. (2004) Ptak, A., Terashima, Y., Ho, L. C., & Quataert, E. 2004, ApJ, 606, 173
- Quataert et al. (1999) Quataert, E., Di Matteo, T., Narayan, R., & Ho, L. C. 1999, ApJ, 525, L89
- Quataert & Gruzinov (1999) Quataert, E., & Gruzinov, A. 1999, ApJ, 520, 248
- Quataert & Gruzinov (2000a) ———. 2000a, ApJ, 539, 809
- Quataert & Gruzinov (2000b) ———. 2000b, ApJ, 545, 842
- Quataert (2001) Quataert, E. 2001, in Probing the Physics of Active Galactic Nuclei by Multiwavelength Monitoring, ed. B. M. Peterson, R. S. Polidan, & R. W. Pogge (San Francisco: ASP), 71
- Quataert & Narayan (1999a) Quataert, E., & Narayan, R. 1999a, ApJ, 516, 399
- Quataert & Narayan (1999b) Quataert, E., & Narayan, R. 1999b, ApJ, 520, 298
- Rees et al. (1982) Rees, M. J., Begelman, M. C., Blandford, R. D., & Phinney, E. S. 1982, Nature, 295, 17
- Schlegel, Finkbeiner & Davis (1998) Schlegel, D. J., Finkbeiner, D. P., & Davis, M. 1998, ApJ, 500, 525
- Shields et al. (2000) Shields, J. C., et al. 2000, ApJ, 534, L27
- Stone et al. (1999) Stone, J. M., Pringle, J. E., & Begelman, M. C. 1999, MNRAS, 310, 1002
- Storchi-Bergmann, Baldwin & Wilson (1993) Storchi-Bergmann, T., Baldwin, J. A., & Wilson, A. S. 1993, ApJ, 410, L11
- Storchi-Bergmann, Wilson & Baldwin (1996) Storchi-Bergmann, T., Wilson, A. S., & Baldwin, J. A. 1996, ApJ, 460, 252
- Storchi-Bergmann et al. (1995) Storchi-Bergmann, T., Eracleous, M., Livio, M., Wilson, A. S., Filippenko, A. V., & Halpern, J. P. 1995, ApJ, 443, 617
- Storchi-Bergmann et al. (1997) Storchi-Bergmann, T., Eracleous, M., Ruiz, M. T., Livio, M., Wilson, A. S., & Filippenko, A. V. 1997, ApJ, 489, 87
- Storchi-Bergmann et al. (2003) Storchi-Bergmann, T., Nemmen, R. S., Eracleous, M., Halpern, J. P., Wilson, A. S., Filippenko, A. V., Ruiz, M. T., Smith, R. C., & Nagar, N. M. 2003, ApJ, 598, 956 (SB03)
- Storchi-Bergmann et al. (2005) Storchi-Bergmann, T., Nemmen, R. S., Spinelli, P. F., Eracleous, M., Wilson, A. S., Filippenko, A. V., & Livio, M. 2005, ApJ, 624, L13 (SB05)
- Strateva et al. (2003) Strateva, I. V., et al. 2003, AJ, 126, 1720
- Tanaka et al. (1995) Tanaka, Y. et al. 1995, Nature, 375, 659
- Telesco & Gatley (1981) Telesco, C. M., & Gatley, Ian. 1981, ApJ, 247, L11
- Terashima et al. (2002) Terashima, Y., Iyomoto, N., Ho, L. C., & Ptak, A. F. 2002, ApJS, 139, 1
- Terashima & Wilson (2003) Terashima, Y., & Wilson, A. 2003, ApJ, 583, 145
- Thean et al. (2000) Thean, A., et al. 2000, MNRAS, 314, 573
- Ulvestad & Ho (2001) Ulvestad, J. S., & Ho, L. C. 2001, ApJ, 562, L133
- Wu & Cao (2005) Wu, Q., & Cao, X. 2005, ApJ, 621, 130
- Wang et al. (2005) Wang, T. G., et al. 2005, ApJ, 625, L35
- Yuan, Markoff & Falcke (2002) Yuan, F., Markoff, S., & Falcke, H. 2002a, A&A, 383, 854
- Yuan et al. (2002) Yuan, F., Markoff, S., Falcke, H., & Biermann, P. L. 2002b, A&A, 391, 139
- Yuan, Quataert & Narayan (2003) Yuan, F., Quataert, E., & Narayan, R. 2003, ApJ, 598, 301
- Yuan & Narayan (2004) Yuan, F., & Narayan, R. 2004, ApJ, 612, 724 (YN04)
- Yuan, Cui & Narayan (2005) Yuan, F., Cui, W., & Narayan, R. 2005, ApJ, 620, 905 (YCN05)
| Count Rate | ||||
|---|---|---|---|---|
| Observation ID | Exposure (s)aaEffective exposure time after data screening. | CCD Mode | Nuclear CountsbbCounts obtained in the nuclear region (), not corrected for pile up. The number of counts in the first observation is small because of significant pile up. | per Second |
| 1611 | 5343 | Full array | 755 | 0.14 |
| 2339 | 5442 | 1/8 sub-array | 1690 | 0.31 |
| Component | () | () | ||
|---|---|---|---|---|
| NucleusaaCorrected for pileup. The normalization constant is at 1 keV (after correction for absorption). The errors quoted represent the 90% confidence level for one parameter of interest (). | 1.73 | 60.5/70 | ||
| Star-forming ringbbMEKAL plasma + thermal bremsstrahlung model. The best-fit parameters for the MEKAL component are and an abundance of . = 7 keV is assumed for the thermal bremsstrahlung component. | – | 0.151ccBremsstrahlung component only. The MEKAL component contributes an observed flux in the 0.5 – 4 keV band of (corrected for absorption). | 63.4/61 | |
| ULX | 0.14 | 11.9/13 |
| (Hz) | (Jy) | Uncertainty (Jy) | (erg s-1) | Resolution (”) | Reference |
|---|---|---|---|---|---|
| 0.0031 | 0.25 | 1 | |||
| 0.240 | 0.073 | 5 | 2 | ||
| 0.065 | 0.009 | 5 | 2 | ||
| 0.0731 | – | 6 | 3 | ||
| 0.0409 | – | 6 | 3 | ||
| 0.0802 | – | aaThe quoted aperture is the FWHM of the achieved spatial resolution in the respective band. | 4 | ||
| 0.0878 | – | 6 | 3 | ||
| 0.049 | – | aaThe quoted aperture is the FWHM of the achieved spatial resolution in the respective band. | 4 | ||
| 0.0604 | – | 6 | 3 | ||
| 0.023 | – | aaThe quoted aperture is the FWHM of the achieved spatial resolution in the respective band. | 4 |