Fine-Structure Fe II and Si II Absorption in the Spectrum of GRB 051111: Implications for the Burst Environment
Abstract
We present an analysis of fine-structure transitions of Fe II and Si II detected in a high-resolution optical spectrum of the afterglow of GRB 051111 (). The fine-structure absorption features arising from Fe II* to Fe II****, as well as Si II*, are confined to a narrow velocity structure extending over km s-1, which we interpret as the burst local environment, most likely a star forming region. We investigate two scenarios for the excitation of the fine-structure levels by collisions with electrons and radiative pumping by an infra-red or ultra-violet radiation field produced by intense star formation in the GRB environment, or by the GRB afterglow itself. We find that the conditions required for collisional excitation of Fe II fine-structure states cannot be easily reconciled with the relatively weak Si II* absorption. Radiative pumping by either IR or UV emission requires massive hot OB stars within a compact star-forming region a few pc in size, and in the case of IR pumping a large dust content. On the other hand, it is possible that the GRB itself provides the source of IR and/or UV radiation, in which case we estimate that the excitation takes place at a distance of pc from the burst. Detailed radiative transfer calculations are required in order to verify that excitation of the low-ionization fine-structure states is possible given the intense UV flux from the burst. Still, it is clear that GRB absorption spectroscopy can provide direct information on the mode and conditions of star formation at high redshift.
Subject headings:
gamma-rays:bursts — ISM:abundances — ISM:kinematics1. Introduction
Understanding the physical conditions in star forming regions at high redshift plays a crucial role in our ability to trace the evolution of star formation and the associated production of metals. Unfortunately, it is exceedingly difficult to probe these regions using background quasars because of their compact size, and possible dust extinction. Absorption studies of bright star forming galaxies (e.g., the lensed Lyman break galaxy MS 1512cB58; Pettini et al. 2002) provide greater promise because they probe the regions where star formation is taking place, but even in these rare cases information is only available on the integrated properties and individual regions cannot be probed.
Gamma-ray bursts (GRBs), on the other hand, are known to be the end product of massive stars, and as a result their bright afterglows can be used to trace the interstellar medium of their host galaxies. More importantly, since GRB progenitors are short-lived, they are likely to be buried within star-forming regions undergoing active star formation (Bloom et al. 2002). As a result, GRBs may provide an ideal direct probe of the physical conditions in high redshift star forming regions. Over the last several years, and particularly with the advent of the Swift satellite, several GRB absorption spectra have been obtained revealing a large fraction of objects with unusually large neutral hydrogen column densities even for damped Ly (DLA) systems, cm-2 (e.g., Vreeswijk et al. 2004; Berger et al. 2005). In addition, it has been noted in several cases that the column densities of non-refractory elements (e.g., Zn) are higher than in QSO-DLAs, with a depletion pattern suggestive of a large dust content (Savaglio & Fall 2004). These properties suggest that at least some GRB-DLAs are physically different from QSO-DLAs, and that they may represent individual star-forming regions with at least a modest dust obscuration.
Given the possible association with star-forming regions, several authors have also investigated the impact of the GRB prompt and afterglow emission on the local environment, particularly in the context of dust destruction, photo-ionization, and dissociation and excitation of molecules (Draine & Hao 2002). The basic conclusion of these studies is that bright afterglows are capable of significantly modifying their local environment on a scale of about cm. The detection of such effects can therefore provide a unique diagnostic of the immediate environment of the burst, and in addition may address the issue of relatively low dust extinction in GRB optical afterglows.
In this Letter we present a high-resolution absorption spectrum of GRB 051111, which reveals strong absorption features from Fe II and Si II fine-structure states at a redshift . This is the first example of an extra-galactic sight line that reveals the full range of Fe II ground-level fine-structure transitions, suggesting that their excitation is intimately related to the burst environment or the burst itself. We investigate both possibilities and their implications in the following sections.
2. Observations
GRB 051111 was detected by Swift on 2005 November 11.250 UT (H. Krimm et al. 2005), and the optical afterglow was discovered with the ROTSE-IIIb robotic telescope 27 s after the burst with an unfiltered magnitude of about 13 (Rujopakarn et al. 2005). Follow-up observations in the first hour after the burst indicate an optical flux evolution, Jy (Smith & Swan 2005).
Spectroscopic observations of GRB 051111 were initiated approximately 1 hr after the burst, using the High Resolution Echelle Spectrometer (HIRES) mounted on the Keck I 10-m telescope (Hill et al. 2005). A total of 5400 s were obtained in three exposures using a wide slit. The wavelength range is Å. The spectra were reduced using the Makee pipeline routines (Version 4.0.1 of May 2005), which includes optimal extraction of orders, sky subtraction, and wavelength calibration from Th-Ar arc lamp exposures, including a heliocentric velocity correction. The orders within individual frames were traced using a median combined total of the exposures, and atmospheric absorption features were removed with the Makee pipeline. A final resampling of the spectrum and continuum fitting was performed using the IRAF task continuum.
The spectrum reveals strong absorption features at a redshift, , which we interpret to arise in the host galaxy (see also Prochaska 2005111A GRB Coordinates Network Circular by Prochaska (2005) provides a cursory list of some properties of the host galaxy absorption system, including the detection of fine-structure lines.). A full analysis of the host galaxy and intervening absorption systems is presented in a companion paper (Penprase et al. 2005). Here we focus on the detection of Fe II and Si II fine-structure transitions.
3. Fe II and Si II Fine-Structure Transitions
In Figures 1–5 we plot the absorption profiles of all transitions of the Fe II ground and fine-structure states as a function of velocity relative to the systemic redshift of . The line identifications, observed wavelengths, and equivalent widths are summarized in Table 1. Also included in the Table are the absorption lines from the ground-state and fine-strcuture level of Si II. We detect absorption features from all four fine-structure levels of the Fe II level, (Fe II* to Fe II****), correspoding to -values of , , , and (see also Prochaska 2005). The absorption profiles exhibit a simple and symmetric velocity structure extending from about to km s-1 and centered on the systemic velocity of the burst. Strong lines of the Fe II ground-state level exhibit an overall velocity range of about to km s-1, but about of the gas is contained in the narrow velocity component (Prochaska 2005, Penprase et al. 2005). We interpret the dominant component to arise from the local environment of the burst based both on the kinematic coincidence and the unusual detection of fine-strcuture transitions.
The detection of the full range of Fe II ground-level fine-structure states is highly unusual, and to our knowledge represents the first such example in an extra-galactic source222Absorption from Fe II* alone was detected in the spectrum of GRB 050730 (Chen et al. 2005).. In the Milky Way, such transitions have been detected in the context of a few dense environments such as in the circumstellar disks around Pictoris (Kondo & Bruhweiler 1985) and 2 Andromedae (Cheng et al. 1997), and the HH 47A bow shock (Hartigan et al. 1999). Absorption from Si II*, on the other hand, is more prevalent and has been previously detected in several GRB-DLAs (Savaglio & Fall 2004; Vreeswijk et al. 2004; Berger et al. 2005), as well as in the lensed Lyman break galaxy MS 1512cB58 (Pettini et al. 2002), but not in any QSO-DLAs (Howk et al. 2005). This suggests that Si II* may trace regions of intense star formation, which tend to be missed in quasar sight lines due to the cross-section selection effect or possibly the associated dust extinction.
We measure the column densities of the various levels using the apparent optical depth method (Savage & Sembach 1991). This method has the advantage that it makes no a priori assumptions about the functional form of the velocity distribution, and at the same time it incorporates information from a wide variety of lines with different oscillator strengths, allowing a robust measure of the column density in the line cores. The column densities derived from this method by integrating over the velocity range of km s-1, as well as the ratios of the fine-structure levels compared to the ground state, are summarized in Table 2.
3.1. Collisional Excitation
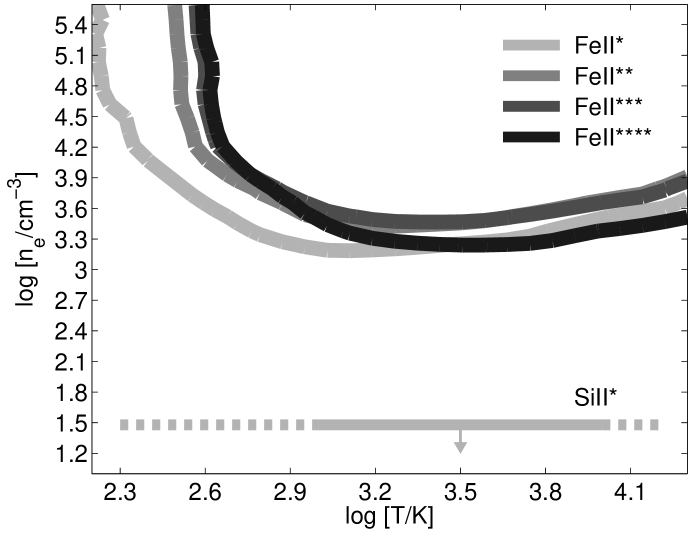
The excitation of the fine-structure levels can be achieved either by collisions with ambient electrons, or by radiative pumping due to a local radiation field. Collisional excitation of Fe II into its fine-structure states has been studied by Keenan et al. (1988), and more recently by Silva & Viegas (2002); the latter authors also investigate the conditions for Si II* collisional excitation. In Figure 6 we plot contours of the observed ratios of Fe II fine-structure columns relative to the ground-state in the space, and find that the required electron density is at least cm-3. Similarly, the detection of Fe II**** lines requires a temperature of at least K. Taking into account all four ratios we find that the best-fit density and temperature are and . We note, however, that the ratio of Fe II* to Fe II is about a factor of two lower than expected based on the ratios of the three other excited states.
A more significant discrepancy is observed in the ratio of the Si II* column relative to that of the ground state, . This is an upper limit since the single Si II line detected in the spectrum is saturated. A comparison to other absorption features from which we can determine the Doppler parameter (Penprase et al. 2005) suggests that the ratio is about . Using the analysis of Silva & Viegas (2002) we find that for the tempearure range of K, the observed ratio indicates an electron density of only cm-3. Conversely, using the electron density inferred from the Fe II transitions we find an expected column density ratio for Si II* of about , at least an order of magnitude larger than detected.
The significant difference in physical conditions derived from the Fe II and Si II fine-strcuture absorption suggests that they either arise in different regions of the absorbing cloud, or that a different mechanism, namely radiative pumping is at play. We consider the former possibility unlikely since there is no clear reason why Fe II and Si II should be segregated within the absorber, particularly in light of their similar velocity structure.
3.2. Excitation by Radiative Pumping
In the context of radiative pumping two possibilities exist. First, the fine-structure states can be directly excited by infra-red radiation. Successive levels starting with Fe II* require energies of , , , and cm-1, respectively, for excitation. The Si II* level requires an energy of cm-1. In the case of IR pumping the ratio of the fine-structure states relative to the ground state is given by (e.g., Srianand & Petitjean 2001),
| (1) |
where the number of photons at the appropriate excitation energy is,
| (2) |
Based on the observed column density ratios listed in Table 2 and the energies of the various excitation levels we infer the following specific intensities at the location of the Si II and Fe II absorbers:
| (3) | |||
| (4) | |||
| (5) | |||
| (6) | |||
| (7) |
These values roughly define a spectrum with a possible turn-over at Hz.
A second possibility is indirect UV pumping in which decays from short-lived excited UV levels populate the fine-structure levels in addition to the ground level. Flannery et al. (1980) investigate this process for the Si II ion and find that UV pumping dominates over collisional excitation as long as333The expression assumes a flat spectrum which may not be directly applicable if the UV pumping is due to the GRB UV flash or afterglow emission, but we expect the difference to be minor. . A detailed investigation of this process for Fe II has not been performed to date.
4. Star Formation versus GRB Excitation of the Fine-Structure Levels
As discussed above, the mis-match in electron densities required to explain the observerd ratios of Si II and Fe II fine-strcuture levels relative to the ground state suggest that collisional excitation is unlikely to be the source of the observed fine-structure population. In addition, we expect that if the excitation is due to electron collisions produced as a result of the GRB shock wave, then the velocity widths of the fine-structure lines should be significantly broader than the observed km s-1. Thus, excitation due to radiative pumping appears to be a more likely scenario. In this context it is instructive to consider two sources for the IR or UV photons: star formation and the GRB afterglow itself.
In the context of IR emission from stars, the inferred spectrum with a possible turn-over at Hz may be indicative of a thermal spectrum with a peak of about K (or greater if the turnover is not real), arising from dust re-radiation of absorbed star light. The much higher temperature compared to, for example, the IR emission from Arp 220 with K, as well as the required large luminosity, erg s-1 Hz-1 (approaching L⊙), indicate an intense radiation field in the environment of GRB 051111 compared to those in local star-forming regions. The star formation rate required to produce the inferred luminosity is in excess of 100 M⊙ yr-1 (Kennicutt 1998), and the high temperature requires a large fraction of hot OB stars and a large dust content. Perhaps a similar analogue is the super star cluster in the dwarf galaxy NGC 5253 ( L⊙), which contains massive O stars within a region of pc. We note that if this is the correct scenario, then it is likely that the GRB had to destroy dust along the line of sight in order for the optical afterglow to be detected on Earth.
In the context of UV radiative pumping the condition for Si II* excitation described in §3.2 may be satisfied in the vicinity ( pc) of OB stars (Flannery et al. 1980). Thus, a large concentration of such stars may lead to the observed Si II* column density. The conditions for UV pumping of Fe II fine-structure states have not been investigated previously and are beyond the scope of this paper, but we expect that a more intense UV radiation field is required for excitation of Fe II**** compared to Si II*. Given that UV and IR pumping require similar star formation conditions, it is likely that both mechanisms operate within the star-forming region.
Finally, it is possible that the radiative pumping is due to the GRB afterglow emission. In this context we use the observed flux of the afterglow, mJy in the first hour, along with the IR fluxes inferred in §3.2, to find that the burst-absorber distance is about pc, which is reasonable for the size of a star-forming region. On the other hand, it is difficult to reconcile the observed shape of the spectrum () with that of a GRB afterglow (), unless the excitation takes place in different layers within the absorber. In the case of UV pumping by the GRB afterglow we find that for the observed flux this process dominates over collisional excitation within a region of about 10 pc unless the electron density exceeds cm-3.
One possibility in the case of excitation by the GRB and afterglow radiation is that the line strengths will change as a function of time. We repeated the column density calculation for each individual exposure and found no significant evolution from to 2.2 hours after the burst.
5. Conclusions
The high-resolution spectrum of GRB 051111 reveals a wide range of absorption features from fine-structure states of Fe II and Si II at . We associate the absorption with the local environment of the burst based on the fact that the excitation of these fine-structure states requires large densities or intense IR/UV radiation fields, which are not common in typical interstellar environments. This conclusion is also supported by the kinematic coincidence with the burst systemic redshift.
A comparison of the conditions required to excite the Fe II and Si II fine-structure levels indicates that collisional excitation is not likely to be the dominant mechanism, unless the two ions are segregated in different regions of the absorber. A more likely mechanuism is direct IR pumping or indirect UV pumping. In this scenario we find that if the radiation field is due to star formation activity in the burst environment, then this requires a large concentration of several thousand OB stars in a compact region ( pc), perhaps reminiscent of the super star cluster in the dwarf galaxy NGC 5253. If the UV and/or IR radiation are supplied by the GRB, on the other hand, then the distance to the absorber is likely to be about pc. This is consistent with calculations by Draine & Hao (2002), which indicate that within pc, the burst will ionize its environment, leading to a very low column of low-ionization states such as Fe II and Si II; outside of this region it is likely that Fe II and Si II survive and may be excited to fine-structure levels instead.
Clearly, detailed radiative transfer calculations, along with refined calculations of Fe II fine-structure excitation, are required in order to distinguish between the different scenarios. Still, regardless of the exact details it is clear that GRB afterglows allow us to directly probe the conditions within individual star forming regions, and may therefore provide direct information on the mode of star formation across a wide redshift range. The absorption spectrum of GRB 051111 seems to indicate that compact, dusty, and dense star forming regions may be prevalent, at least in the context of GRB progenitor formation.
References
- Berger et al. (2005) Berger, E., Penprase, B. E., Cenko, S. B., Kulkarni, S. R., Fox, D. B., Steidel, C. C., & Reddy, N. A. 2005, ArXiv Astrophysics e-prints
- Bloom et al. (2002) Bloom, J. S., Kulkarni, S. R., & Djorgovski, S. G. 2002, AJ, 123, 1111
- Chen et al. (2005) Chen, H.-W., Prochaska, J. X., Bloom, J. S., & Thompson, I. B. 2005, ArXiv Astrophysics e-prints
- Cheng et al. (1997) Cheng, K.-P., Bruhweiler, F. C., & Neff, J. E. 1997, ApJ, 481, 866
- Draine & Hao (2002) Draine, B. T., & Hao, L. 2002, ApJ, 569, 780
- Flannery et al. (1980) Flannery, B. P., Rybicki, G. B., & Sarazin, C. L. 1980, ApJS, 44, 539
- H. Krimm et al. (2005) H. Krimm, H., et al. 2005, GRB Circular Network, 4260, 1
- Hartigan et al. (1999) Hartigan, P., Morse, J. A., Tumlinson, J., Raymond, J., & Heathcote, S. 1999, ApJ, 512, 901
- Hill et al. (2005) Hill, G., Prochaska, J. X., Fox, D., Schaefer, B., & Reed, M. 2005, GRB Circular Network, 4255, 1
- Howk et al. (2005) Howk, J. C., Wolfe, A. M., & Prochaska, J. X. 2005, ApJ, 622, L81
- Keenan et al. (1988) Keenan, F. P., Hibbert, A., Burke, P. G., & Berrington, K. A. 1988, ApJ, 332, 539
- Kennicutt (1998) Kennicutt, R. C. 1998, ARA&A, 36, 189
- Kondo & Bruhweiler (1985) Kondo, Y., & Bruhweiler, F. C. 1985, ApJ, 291, L1
- Pettini et al. (2002) Pettini, M., Rix, S. A., Steidel, C. C., Adelberger, K. L., Hunt, M. P., & Shapley, A. E. 2002, ApJ, 569, 742
- Prochaska (2005) Prochaska, J. X. 2005, GRB Circular Network, 4271, 1
- Prochaska et al. (2003) Prochaska, J. X., Gawiser, E., Wolfe, A. M., Cooke, J., & Gelino, D. 2003, ApJS, 147, 227
- Rujopakarn et al. (2005) Rujopakarn, W., Swan, H., Rykoff, E. S., & Schaefer, B. 2005, GRB Circular Network, 4247, 1
- Savage & Sembach (1991) Savage, B. D., & Sembach, K. R. 1991, ApJ, 379, 245
- Savaglio & Fall (2004) Savaglio, S., & Fall, S. M. 2004, ApJ, 614, 293
- Silva & Viegas (2002) Silva, A. I., & Viegas, S. M. 2002, MNRAS, 329, 135
- Smith & Swan (2005) Smith, I. A., & Swan, H. F. 2005, GRB Circular Network, 4267, 1
- Srianand & Petitjean (2001) Srianand, R., & Petitjean, P. 2001, A&A, 373, 816
- Vreeswijk et al. (2004) Vreeswijk, P. M., et al. 2004, A&A, 419, 927
| Line | ||||
|---|---|---|---|---|
| (Å) | (Å) | (Å) | ||
| 4609.49 | Si II 1808.0130 | 0.00219 | 0.22796 | |
| 4632.22 | Si II* 1816.9285 | 0.00166 | 0.03723 | |
| 5736.02 | Fe II 2249.8768 | 0.00182 | 0.09490 | |
| 5763.81 | Fe II 2260.7805 | 0.00244 | 0.13672 | |
| 5935.47 | Fe II** 2328.1112 | 0.03450 | 0.07175 | |
| 5949.25 | Fe II* 2333.5156 | 0.07780 | 0.15565 | |
| 5962.53 | Fe II*** 2338.7248 | 0.08970 | 0.10608 | |
| 5976.53 | Fe II 2344.2140 | 0.11400 | 0.37211 | |
| 5978.53 | Fe II**** 2345.0011 | 0.15300 | 0.10861 | |
| 6016.33 | Fe II*** 2359.8278 | 0.06790 | 0.07552 | |
| 6030.93 | Fe II* 2365.5518 | 0.04950 | 0.13941 | |
| 6053.64 | Fe II 2374.4612 | 0.03130 | 0.29999 | |
| 6074.81 | Fe II 2382.7650 | 0.32000 | 0.41259 | |
| 6091.62 | Fe II* 2389.3582 | 0.08250 | 0.19033 | |
| 6131.92 | Fe II*** 2405.1638 | 0.02600 | 0.05041 | |
| 6133.08 | Fe II** 2405.6186 | 0.23700 | 0.25156 | |
| 6147.44 | Fe II*** 2411.2533 | 0.21000 | 0.18791 | |
| 6148.84 | Fe II**** 2411.8023 | 0.21000 | 0.10497 | |
| 6154.56 | Fe II**** 2414.0450 | 0.17500 | 0.10723 | |
| 6629.09 | Fe II 2600.1730 | 0.22390 | 0.44168 | |
| 6648.70 | Fe II** 2607.8664 | 0.11800 | 0.20213 | |
| 6660.91 | Fe II* 2612.6542 | 0.12600 | 0.25575 | |
| 6675.56 | Fe II** 2618.3991 | 0.05050 | 0.10022 | |
| 6685.89 | Fe II**** 2622.4518 | 0.05600 | 0.04794 | |
| 6696.08 | Fe II* 2626.4511 | 0.04410 | 0.15064 | |
| 6702.78 | Fe II**** 2629.0777 | 0.17300 | 0.12269 |
Note. — Absorption features of Fe II and Si II ground and fine-structure states identified in the spectrum of GRB 051111. The columns are (left to right): (i) Observed wavelength, (ii) line identification, (iii) oscillator strength (Prochaska et al. 2003), (iv) redshift of the line, and (v) rest-frame equivalent width.
| Ion | ||
|---|---|---|
| Si II | ||
| Si II* | ||
| Fe II | ||
| Fe II* | ||
| Fe II** | ||
| Fe II*** | ||
| Fe II**** |
Note. — Ionic column densities of Fe II and Si II ground and fine-structure state. The columns are (left to right): (i) Ion, (ii) logarithm of the column density, and (iii) logarithm of the ratio of fine-structure to ground state column density.