The Impact of Box Size on the Properties of Dark Matter Haloes in Cosmological Simulations
Abstract
We investigate the impact finite simulation box size has on the structural and kinematic properties of Cold Dark Matter haloes forming in cosmological simulations. Our approach involves generating a single realisation of the initial power spectrum of density perturbations and studying how truncation of this power spectrum on scales larger than affects the structure of dark matter haloes at . In particular, we have examined the cases of with (i.e. no truncation) and . In common with previous studies, we find that the suppression of long wavelength perturbations reduces the strength of clustering, as measured by a suppression of the 2-point correlation function , and reduces the numbers of the most massive haloes, as reflected in the depletion of the high mass end of the mass function . Interestingly, we find that truncation has little impact on the internal properties of haloes. The masses of high mass haloes decrease in a systematic manner as is reduced, but the distribution of concentrations is unaffected. On the other hand, the median spin parameter is lower in runs with . We argue that this is an imprint of the linear growth phase of the halo’s angular momentum by tidal torquing, and that the absence of any measurable trend in concentration and the weak trend observed in halo shape reflect the importance of virialisation and complex mass accretion histories for these quantities. These results are of interest for studies that require high mass resolution and statistical samples of simulated haloes, such as simulations of the population of first stars. Our analysis shows that large-scale tidal fields have relatively little effect on the internal properties of Cold Dark Matter haloes and hence may be ignored in such studies.
keywords:
cosmology:theory - dark matter - gravitation1 Introduction
Over the last twenty years, the cosmological N-Body simulation has come to be firmly established as the preeminent tool for theoretical studies of the formation and evolution of structure in the Universe (see Bertschinger (1998) for a relatively recent review). Whereas early studies explored the gross features of different cosmological models and led to the emergence of the Cold Dark Matter (CDM) paradigm (Frenk et al., 1983; White, Frenk & Davis, 1983; Davis et al., 1985), the most recent generation of simulations are being used to provide detailed predictions of the CDM model and in particular its CDM variant. These include the behaviour of CDM halo mass profiles on scales that can be directly compared with observations (e.g. Hayashi et al., 2004; Navarro et al., 2004; Diemand et al., 2004) and sophisticated semi-analytical models of galaxy formation built upon merger trees harvested from high resolution simulations (c.f. the Millennium Simulation described in Springel et al., 2005). The N-Body approach is not without its limitations, however, and given its significance, it is of fundamental importance to understand what these limitations are and how they affect the interpretation of the results of simulations.
Such considerations generally lead to “convergence” studies that seek to
quantify the degree to which the results of a simulation are affected by
choices made in its setting up and running. For example, both Navarro, Frenk & White (1996)
and Moore et al. (1998) demonstrated that their results on the form of CDM halo
mass profiles were not compromised by force resolution (or “softening”) as
well as starting redshift (Navarro, Frenk & White, 1996) and particle number
(Moore et al., 1998). The recent study of Power et al. (2003) established a set of
convergence criteria (reaffirmed by Hayashi et al., 2004) that determine the
radial range over which the circular velocity profile of a simulated CDM halo
is reliable to better than accuracy, for a number of simulation
parameters including softening, time integration accuracy, and particle
number (see also Diemand et al., 2004; Binney, 2004). More generally, Knebe et al. (2000)
investigated how properties such as the correlation function, mass function
and central densities of dark matter haloes varied with softening and time
integration accuracy at fixed particle mass in simulations run with different
N-Body codes.
Recently, Bagla & Ray (2005, hereafter BR05) have demonstrated that size of simulation box can also affect certain properties of the dark matter halo population, in particular the 2-point correlation function and the mass function . sets the longest wavelength perturbation that can be resolved in a simulation and it follows that reducing suppresses the contribution of large scale perturbations to the power spectrum. The effect of this suppression was highlighted by Gelb & Bertschinger (1994b, hereafter GB94), who examined the importance of long wavelength perturbations in the initial conditions for and the correlation length in the context of the SCDM model. They investigated how (the linear mass variance in a sphere of radius ) and consequently varied with (see their figures 1 and 2), and found that (or for ) was required to correctly recover both and the amplitude of . In other words, studies that wish to accurately characterise the clustering properties of dark matter haloes require large simulation boxes.
How large the simulation box must be to accurately recover was the question addressed by BR05. They noted that finite box size can affect not only but also the high mass end of the mass function ; as is reduced below some threshold value, the numbers of the most massive haloes decrease in a systematic fashion. The mass function can be characterised by the Press & Schechter (1974) form which is a relatively simple function of the linear mass variance . For a given mass with mean density,
| (1) |
where is the linear power spectrum, is the top-hat
filter, and the lower limit of the integral
corresponds to the fundamental mode in the simulation box. BR05
investigated how varying impacted on the form of
and used this as a simple criterion for determining how large
must be to recover (and consequently ) to a given
accuracy.
The studies of GB94 and BR05 clearly indicate that large simulation boxes are required if we wish to recover accurate mass and two point correlation functions of the dark matter halo population, but does the choice of also affect the internal properties of the haloes? This question is of interest for studies that require the high spatial resolution offered by simulations of small volumes but that may not require accurate clustering information, such as studies of the first objects at high redshift (e.g. Abel et al., 2002), and it is one that we shall address in the present study.
Why might we expect finite to be of importance for the
internal structure of haloes? The suppression of long wavelength
perturbations will modify the “global” tidal field that a dark
matter halo is subject to, which may have an impact on the halo’s
shape, its angular momentum content (e.g. White, 1984) and the
infall pattern of substructures (e.g. Aubert et al., 2004; Benson, 2005).
Similarly, the linear mass variance controls the formation time of dark
matter haloes (Navarro, Frenk & White, 1996; Bullock et al., 2001; Eke et al., 2001) and so we might expect
haloes to form at systematically later times in smaller boxes with
lower “effective” values of ; this may then affect both the
mass of the halo and its central density (or concentration) measured at .
We also note that small- and large-scale modes are coupled during the
non-linear clustering phase and there is a transfer of power from
large scales down to small scales (e.g. Bagla & Padmanabhan, 1997); neglecting
this power may leave an imprint on the formation and evolution of
gravitationally bound objects. On the other hand, dark matter haloes are, by
definition, virialised systems and much of the information that was
present during the initial stages of their collapse will be erased
during virialisation (c.f. the universal mass
profile of Navarro, Frenk & White, 1996, 1997), so it is not clear whether a finite will have an effect at all. Nevertheless, it is important to
investigate this question and determine how severe a limitation it
might be.
The outline of this paper is as follows; in the next section, we briefly describe the simulations we have used in this study before presenting our results (§ 3). We confirm the findings of GB94 and BR05 (§ 3.2) before examining how various characteristic properties of the halo population – concentrations, shapes and spins – are affected by the suppression of long wavelength perturbations on scales larger than . Finally, we discuss our results in § 4 and offering some concluding remarks in § 5.
2 The Simulations
We have run a set of cosmological N-body simulations following the formation and evolution of structure in a set of simulation boxes of side , assuming a flat cosmology with , , and . Each simulation is single-mass and contains particles, implying a particle mass of ; we adopt a starting redshift of in each case. For each of the runs, we use the same realisation (i.e. the same amplitudes and phases) of the power spectrum222Generated using CMBFAST (Seljak & Zaldarriaga, 1996) but we truncate the power on scales , where is a fraction of and (i.e. no truncation), and . These correspond to cut-offs of and or and respectively. Truncating the power spectrum in this way mimics the effect of varying while allowing the impact of the truncation on individual haloes to be investigated.
The simulations were performed using the parallel TreePM code GADGET2 (Springel et al., 2005) with a fixed comoving softening of and a timestep parameter of .
Groups were identified using AHF333AHF can be downloaded from the following web page http://www.aip.de/People/aknebe/AMIGA, a modification of the MHF algorithm that was presented in Gill et al. (2004). Haloes are located as peaks in an adaptively smoothed density field of the simulation using MLAPM’s grid hierarchy and a refinement criterion that matches the force resolution of the actual simulation carried out with GADGET2 (i.e. 5 particles per cell); local potential minima are computed for each of these peaks and the set of particles that are gravitationally bound to the halo are returned. For every halo (either host or satellite) we calculate a suite of canonical properties (e.g. velocity, mass, spin, shape, concentration, etc.) based upon the particles within the virial radius. The virial radius is defined as the point where the density profile (measured in terms of the cosmological background density ) drops below the virial overdensity , i.e. . This threshold is based upon the dissipationless spherical top-hat collapse model and is a function of both cosmological model and time. For it amounts to .
3 Results

We now present the results of our analysis. Firstly, we give a visual impression of the impact of truncating the power spectrum at large scales on the overall clustering pattern within the simulation volume. Secondly, we consider some bulk measures of the dark matter halo population, including the mass function , 2-point correlation function and power spectrum . Finally we examine the internal properties of haloes, including concentrations, shapes and spin parameters.
In what follows, we compare and contrast the runs in which the initial power spectrum is truncated with the fiducial run ChopNo, whose initial power spectrum was not truncated (i.e. ). The “truncated” runs are called Chop64 (i.e. ), Chop43 (i.e. ) and Chop32 (i.e. ), respectively.
3.1 Spatial Distribution at : A Visual Impression
Figure 1 shows projected maps of the dark matter density distribution within a thin slice taken through each of the four simulations at ; for clarity, we have chosen a slice thickness of the box length (i.e. ) taken through the centre of the box.
Although it is possible to pick out features that are common to all four runs, the magnitudes of the corresponding overdensities decrease as is decreased. The network of filaments in the fiducial run is more striking than in the “truncated” runs – that is, the fraction of volume that is at or above a given overdensity threshold is smaller in the runs in which large scale power was suppressed The central overdensities of individual haloes are comparable in the respective runs, but these haloes tend to occupy regions that are less overdense in the “truncated” runs. Similarly, the local mean number density of haloes appears lower in the “truncated” runs. Both of these latter observations are consistent with the GB94 and BR05 results that finite box size impacts on and consequently the correlation length .
3.2 Bulk Properties of the Halo Population
The projected maps of the dark matter density distribution suggest that
haloes are less clustered and that there are fewer massive haloes in
the “truncated” runs. We now quantify these differences by
studying the halo mass function , the correlation function
and the non-linear power spectrum .
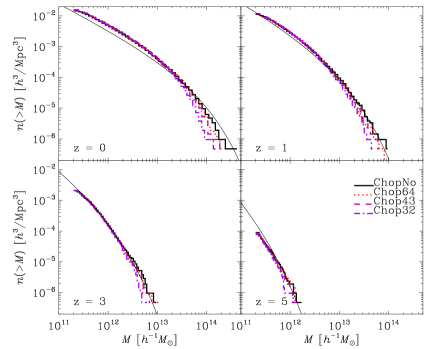
We begin by comparing cumulative halo mass functions for each of the runs in figure 2; these mass functions have been constructed from the AHF halo catalogues at redshifts and . The heavy solid curves correspond to the fiducial ChopNo run while the dotted, dashed and dotted-dashed curves correspond to the Chop64, Chop43 and Chop32 runs respectively. For reference, we also plot the appropriate Press-Schechter mass function for the given redshift (light solid curve in each of the panels).
This figure demonstrates that truncating the power on large spatial scales leads to a suppression of the number of high mass systems that form, and the effect is most noticeable in the runs where the truncation is most severe. We note that the effect is most pronounced at but it is apparent at all redshifts.
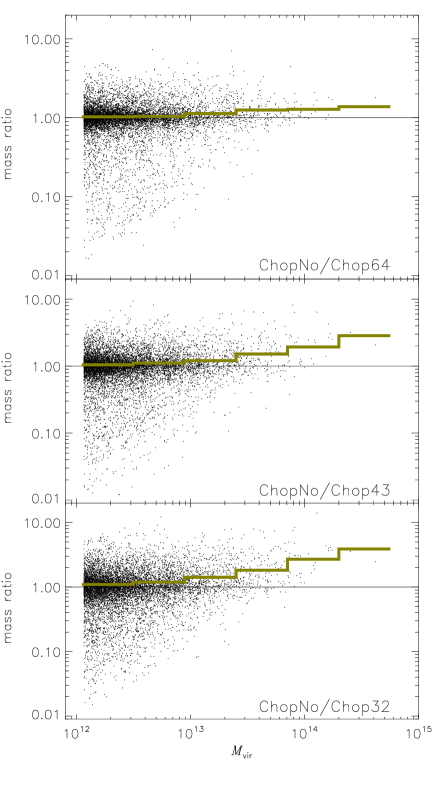
We investigate this effect further in figure 3, where we cross correlate the masses of individual haloes that have been matched in the fiducial and truncated runs, i.e. we plot the mass ratio of corresponding haloes against the mass in the fiducial run. This is achieved by identifying its most bound particles in the ChopNo model and locating those haloes in the truncated runs that contain the largest fraction of these particles; this allows for unique matching.
Here we observe a clear trend – the masses of the high mass systems
are systematically smaller in the truncated runs relative to the
fiducial run, and the effect becomes more pronounced as the truncation
is applied more aggressively (compare the upper and lower panels). However,
as we go to lower masses (), we
find that the median halo mass is unaffected, although we note that the mass
of any given halo can change by as much as a factor of 10 (with a rms variation
of a factor of 2).
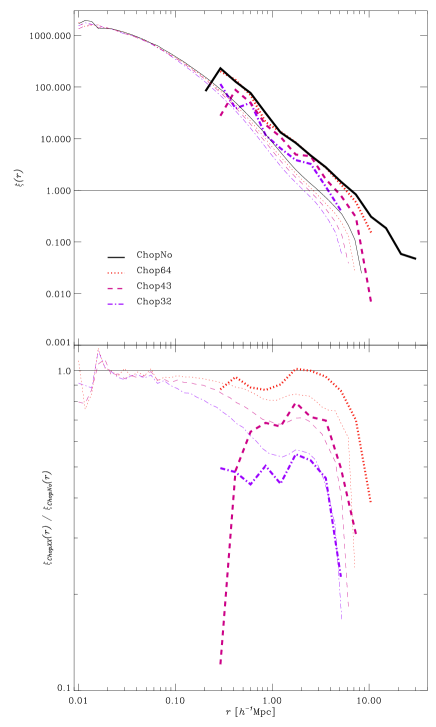
Figure 4 shows how clustering as measured by the correlation
function varies between different runs. The heavy lines correspond to
the 850 most massive haloes within the simulation volume (according to
a number density of roughly ), while the
light lines correspond to the dark matter. Solid, dotted, dashed,
dotted-dashed curves represent the fiducial runs and the truncated runs
respectively. The upper panel shows while the lower panel
shows the ratio of measured for each of the truncated runs
relative to the fiducial run. The first point to note is that the
haloes are more clustered than the dark matter – a well-known result. The
second point is that the amplitude of for both the dark matter
and the haloes decreases as the cut-off scale
decreases; the extent of the effect is clearly illustrated in the
lower panel.
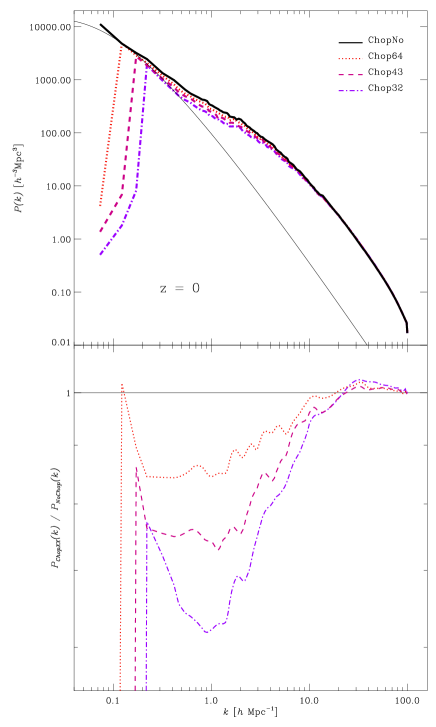
As a final measure of the impact of truncating the initial power spectrum, we measure the non-linear dark matter power spectrum at for each of the runs, shown in figure 5. At small scales there is good agreement but deviations from the fiducial run become apparent at , at which point the amplitude of the power spectrum is suppressed in the truncated runs relative to the fiducial run. This is clear in the lower panel where we show the ratio of the power spectra to the fiducial case.
3.3 The Internal Properties of the Halo Population
We have so far considered bulk properties of the halo population
and shown that our results are consistent with those of GB94 and BR05.
However, our primary motivation for this study is to determine whether
the choice of box size influences the structural and kinematic
properties of haloes, and this is the subject of this section.
To this extent we are focusing on three relevant integral properties
of dark matter haloes, namely concentration, spin parameter, and triaxiality.
We begin by investigating the impact of the finite box size on concentration, which provides a measure of the central density of a halo. Typically a concentration is defined;
| (2) |
where is a “scale” radius (c.f. Navarro, Frenk & White, 1997, defined as the radius at which the logarithmic slope of the density profile is ). In this study, we have adopted (e.g. Colin et al., 2000; Knebe et al., 2002), defined as
| (3) |
is the radius enclosing the virial mass of the halo. This is a convenient, robust and model-independent measure of concentration, although it is a non-trivial function of ; for example, corresponds to while is approximately . However, this is unimportant because we are interested in relative variations in concentration.
We argued in § 1 that the suppression of long wavelength perturbations affects the linear mass variance , which should affect when the halo forms and hence what its concentration at will be. Furthermore, previous studies have shown that is a function of halo mass (Navarro, Frenk & White, 1997; Eke et al., 2001; Bullock et al., 2001) and the density of the environment in which the halo resides (Bullock et al., 2001, hereafter B01). It follows that might be influenced by the finite box size;
-
•
The relation between halo mass and is such that is a decreasing function of increasing halo mass. Higher mass systems tend to form at later times when the mean density of the Universe was lower, and so the central densities and hence concentrations of these haloes are smaller. Suppressing the contribution from long wavelength perturbations results in a lower effective , which should delay the formation time of haloes and hence reduce . We expect this effect to be more dramatic for higher mass systems (c.f. figure 3).
-
•
Haloes in less dense environments tend to have lower concentrations than haloes of similar mass in higher density environments (B01). Figure 4 shows that both the dark matter and haloes are less clustered in the truncated runs and thus reside in lower density environments relative to their counterparts in the fiducial run.
Although there are two competing effects, we note that B01 observed that the trend with environment is stronger than the trend with mass. Moreover, it is the masses of the higher mass systems () that are most affected, where the effect on clustering affects both the dark matter and the haloes in a similar manner. Based on these observations, we might expect a shift towards higher concentrations.
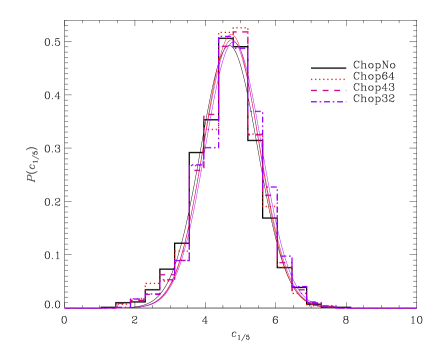
In figure 6, we show the distributions of for the four runs. Each peaks at (), and while there are small differences in amplitude and offset in the position of the peak, there is no indication that the differences between the distributions are significant. This is confirmed by computing the KS statistic for the truncated runs compared with the fiducial run; the probability that the differences are significant is small () and negligible compared to the variation between runs with different realisations of the (untruncated) power spectrum. Restricting our analysis to only those haloes more massive than does not affect the result.
We checked for differences in both the mass accretion histories and the mean
local density of haloes (c.f. figure 6 of B01) between the
truncated and fiducial runs, but again the differences are negligible.
Haloes in each of the runs accrete similar fractions of their final mass
between and (e.g. for haloes) and the mean local density with a sphere of
centred on each halo in the different runs correlates
with as we would expect. It seems that the concentration of
individual haloes are sensitive to the suppression of long wavelength
perturbations in the initial conditions (as we shall see in
§ 3.4), but those of a “typical” halo do not.
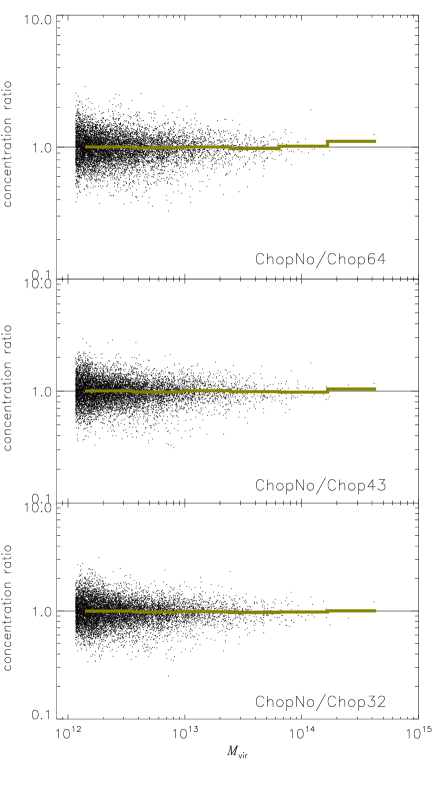
This result is further confirmed when plotting the analogue to figure 3, i.e. the cross-correlation between the individual halo concentrations as shown in figure 7. We again observe a scatter about the mean ratio, but on average this ratio is found to be unity.
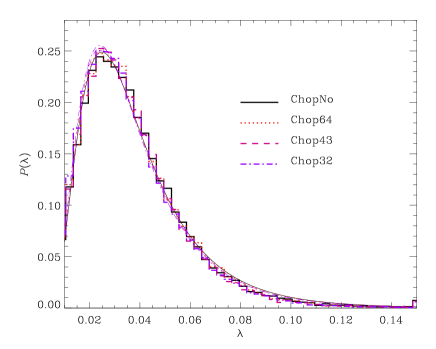
We have concentrated on the mass profile so far, but we also argued that the angular momenta and the shapes of haloes should be affected by the suppression of long wavelength perturbations in the initial conditions. Figure 8 shows the distribution of spin parameters in the truncated and fiducial runs. Note that we have adopted the Bullock et al. (2001a, hereafter B01a) definition in this figure;
| (4) |
The light curves correspond to fits to the lognormal distribution advocated by B01a444We confirm that these distributions are in good agreement with those derived for spins defined by ..
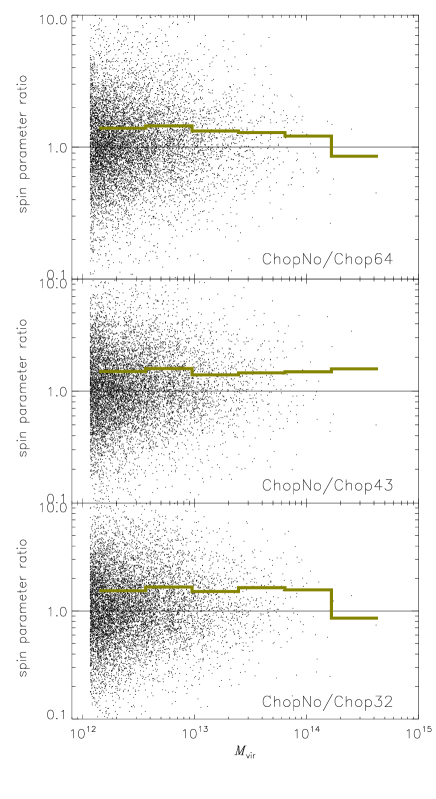
The shapes and amplitudes of the distributions are all well described by the B01a lognormal functional form. And as the truncated models only display a marginal shift towards smaller spin parameters in figure 8, the effects of the (missing) large-scale modes are better revealed in figure 9, which can be considered an analogue to
figure 3 again; we match haloes in the truncated runs with their
counterparts in the fiducial run that share the largest fraction of the
most bound particles of the halo. We can now see that there is an offset of between the fiducial run and the truncated runs, independent of halo
mass; that is, the median spin is larger in the fiducial run
for haloes of all masses. We also note that the spin of an individual halo
can vary by as much as a factor of 10 (rms variation of a factor of )
between truncated and fiducial runs.
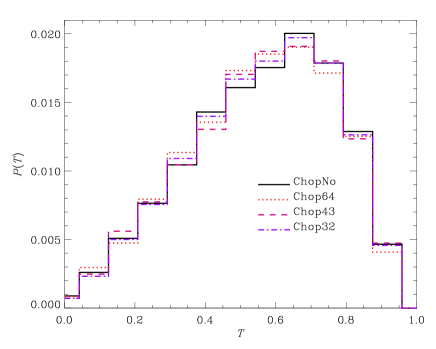
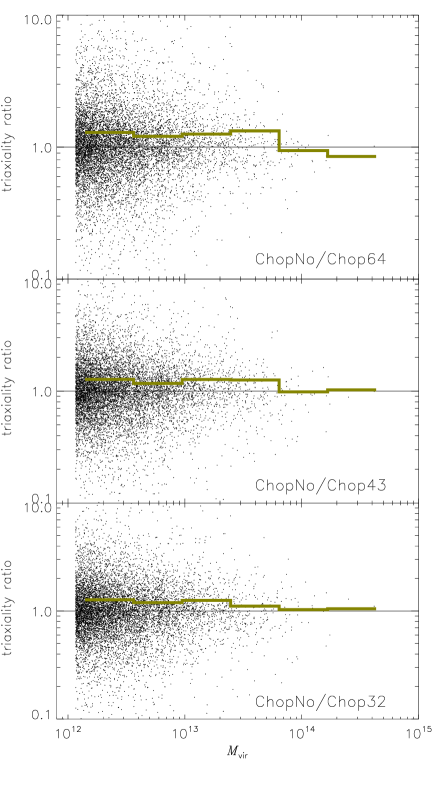
Finally, we examine the shapes of haloes forming in the truncated runs and compare with those that form in the fiducial run. For convenience, we compute the triaxiality parameter that was introduced by Franx et al. (1991), defined as
| (5) |
where are the lengths of the major, intermediate and minor axes, respectively, as defined by all particles interior to . The resulting distributions are shown in figure 10. We observe again a trend for a marginal decrease in triaxiality when reducing the power on large scales. This is further confirmed by figure 11 where we plot the ratio of triaxiality for all cross-identified halos. The signal is similar (yet weaker) to the one already reported for the spin parameter: the more large-scale power has been ignored the smaller the triaxiality. However, it is not as pronounced, especially not for the ratio of ChopNo to Chop32.
3.4 Case Study
| (,) | T | |||||||
|---|---|---|---|---|---|---|---|---|
| [ | [] | [] | ||||||
| 1 | 5.336 | 1.65 | 0.32 | 1384 | 8.3 | 0.0089 | (0.73,0.43) | 0.57 |
| 1/2 | 2.625 | 1.30 | 0.35 | 1023 | 6.3 | 0.0132 | (0.63,0.42) | 0.73 |
| 1/3 | 2.475 | 1.28 | 0.41 | 1033 | 7.1 | 0.0166 | (0.53,0.42) | 0.87 |
| 1/4 | 2.195 | 1.22 | 0.53 | 946 | 5.2 | 0.0194 | (0.46,0.44) | 0.98 |
We have found that the internal properties of haloes are robust in the sense that the concentrations and widths of their distributions and the values of their medians are practically unaffected as the “effective” box size is varied. However, we have also found that properties such as the triaxiality and spin of individual haloes can vary by a factor of several between those truncated runs and the fiducial run. In this short case study, we illustrate how changing the effective box size impacts on an individual halo.
We considered a number of characteristic internal properties of a single well resolved halo that we have identified in each of the runs; these are summarised in table 1, while projections of the particle distribution within 1.5 times the virial radius are shown in figure 12. We have chosen the most massive halo in the fiducial simulation for our analysis because we expect the differences to be most pronounced on this mass scale.
Inspection of table 1 reveals that truncation of the power spectrum has a dramatic effect on the halo’s mass, as expected from figure 3 – a factor of between the fiducial run and the three truncated runs. This is reflected in the decrease in concentration (by ). Interestingly, the spin parameter increases steadily by up to a factor of between the fiducial and the Chop32 truncated run. Also, we note that the semi-minor axis remains fixed (at ) but the semi-major axis steadily decreases (from 0.73 to 0.46), leading to an increase in triaxiality (from T=0.57 to T=0.98).

4 Discussion
The results presented in the previous show that the size of simulation box has little impact, if any, on the internal structure and kinematics of simulated Cold Dark Matter haloes. At first, this result is a little surprising, for reasons given in § 1. Although we focused on concentration, shape and spin parameter because we expect these quantities to be most susceptible to the contribution of long wavelength perturbations, we also examined a number of other quantities, including radial velocities, velocity anisotropies and the virial ratio . In all cases, the distributions recovered from the truncated runs are indistinguishable from those derived from the fiducial run.
However, it can be argued that this result is not so surprising. The impact of large scale perturbations on the value of noted by GB94 is certainly noticeable – of order a reduction for a box size of relative to the “true” value – but the effect is less pronounced as we probe smaller mass scales. For example, the difference is less than at for the same box size. In other words, large scale perturbations become less important as we probe smaller masses. We can understand this in figure 3, which both confirms the result of BR05 that it is the higher mass systems that are most affected by the truncation of long wavelength perturbations and also highlights that the typical or median halo mass below is unaffected by truncation.
Perhaps more pertinently, the existence of a universal mass profile (Navarro, Frenk & White, 1996, 1997) that provides an adequate characterisation of haloes in a range of hierarchical cosmologies implies that large scale perturbations have little effect on the inner structure of dark matter haloes. Indeed, truncating the power spectrum at short wavelengths produces a halo mass profile that is well described by the Navarro, Frenk & White (1996, 1997) form (Moore et al., 1999; Knebe et al., 2002). Nevertheless, our results show that the internal structure of haloes (in the spherically averaged sense) are unaffected by the introduction of a long wavelength cut-off in the power spectrum (see also Tormen & Bertschinger, 1996; Cole, 1997).
Similarly, the weakness of the trend in the distribution of halo shapes most likely reflects the relevance of the dependence of shape on merging history. While the infall of material on the halo is sensitive to the global tidal field, and therefore long wavelength perturbations, a change in the tidal field does not necessarily suppress infall; rather it will change the time at which it occurs and therefore will not affect halo shape in an average sense.
The small effect noted in the spin distributions – an offset in the median values of the truncated and fiducial values – suggests that long wavelength perturbations play some role in shaping the spin and consequently the angular momentum content of the halo. Tidal torques make an important contribution to the acquisition of angular momentum of the halo during its growth in the linear regime (White, 1984) but we do not expect the halo’s subsequent non-linear evolution to depend on the large scale tidal field. The small difference likely represents an imprint of the angular momentum acquired during the haloes linear growth.
5 Conclusions
The aim of this study has been to establish whether finite box size has a measurable effect on the internal properties of simulated Cold Dark Matter haloes. The results of our analysis suggest that the effects, if present, are small and not statistically significant in most cases. Of the principal quantities we have examined – concentration, shape and the spin parameter – we find that spin shows the most prominent effect; the median spin parameter is smaller in our truncated runs, independent of the mass of the system. We argue that this is an imprint of the linear growth phase of the halo’s angular momentum by tidal torquing, and that the absence of any measurable trend in concentration or strong trend in shape reflect the importance of virialisation and complex mass accretion histories for these quantities respectively.
These results are useful because they clarify what properties of simulated dark matter haloes are affected by finite box size, and the severity of these effects. Indeed, they are of some importance because they reveal that studies of the internal properties of statistical samples of haloes that do not require clustering information that are based on high resolution simulations of small volumes are not compromised. The abundance of high mass systems will be underestimated, but the properties of low- to intermediate-mass systems are reliable. This is of interest to studies of, for example, the formation of the first generation of population III stars at high redshift (e.g. Abel et al., 2002); in these cases, clustering information is not as important (although it would be for reionisation studies, say).
In conclusion, our study has demonstrated that the effects of finite box size are negligible for the internal properties of dark matter haloes.
Acknowledgements
The simulations presented in this paper were carried out on the Beowulf cluster at the Centre for Astrophysics & Supercomputing, Swinburne University. The financial support of the Australian Research Council is gratefully acknowledged.
References
- Abel et al. (2002) Abel T., Bryan G. L., & Norman M. L., 2002, Science, 295, 93
- Aubert et al. (2004) Aubert D., Pichon C., & Colombi S., 2004, MNRAS, 352, 376
- Bagla & Padmanabhan (1997) Bagla J. S., & Padmanabhan T. 1997, MNRAS, 286, 1023
- Bagla & Ray (2005) Bagla J. S., & Ray S. 2005, MNRAS, 358, 1076 (BR05)
- Benson (2005) Benson A. J., 2005, MNRAS, 358, 551
- Bertschinger (1998) Bertschinger E., 1998, ARA&A, 36, 599
- Binney (2004) Binney J., 2004, MNRAS, 350, 939
- Bullock et al. (2001) Bullock J. S., Dekel A., Kolatt T. S., Kravtsov A. V., Klypin A. A., Porciani C. & Primack J. R. 2001, ApJ, 555, 240 (B01)
- Bullock et al. (2001a) Bullock J. S., Dekel A., Kolatt T. S., Kravtsov A. V., Klypin A. A., Porciani C. & Primack J. R. 2001, ApJ, 555, 240 (B01a)
- Cole (1997) Cole S. 1997, MNRAS, 286, 38
- Colin et al. (2000) Colin P., Avila-Reese V., Valenzuela O., 2000, ApJ, 542, 622
- Davis et al. (1985) Davis M., Efstathiou G., Frenk C. S., & White S. D. M., 1985, ApJ, 292, 371
- Diemand et al. (2004) Diemand J., Moore B., Stadel J. & Kazantzidis S., 2004, MNRAS, 348, 977
- Diemand et al. (2004a) Diemand J., Moore B., & Stadel J., 2004, MNRAS, 353, 624
- Efstathiou et al. (1985) Efstathiou G., Davis M., White S. D. M., & Frenk C. S., 1985, ApJS, 57, 241
- Eke et al. (2001) Eke V. R., Navarro J. F., & Steinmetz M. 2001, ApJ, 554, 114
- Franx et al. (1991) Franx M., Illingworth G., & de Zeeuw T. 1991, ApJ, 383, 112
- Frenk et al. (1983) Frenk C. S., White S. D. M., & Davis M. 1983, ApJ, 271, 417
- Gelb & Bertschinger (1994a) Gelb J. M. & Bertschinger E. 1994a, ApJ, 436, 467
- Gelb & Bertschinger (1994b) Gelb J. M. & Bertschinger E. 1994b, ApJ, 436, 491 (GB94)
- Gill et al. (2004) Gill S. P. D., Knebe A., & Gibson B. K. 2004, MNRAS, 351, 399
- Hayashi et al. (2004) Hayashi E., Navarro J. F., Power C. Jenkins A., Frenk C. S., White S. D. M., Springel V., Stadel J., & Quinn T., 2004, MNRAS, 355, 794
- Knebe et al. (2000) Knebe A., Kravtsov A. V., Gottlöber S., & Klypin A. A., 2000, MNRAS, 317, 630
- Knebe et al. (2001) Knebe A., Green A., & Binney J., 2001, MNRAS, 325, 845
- Knebe et al. (2002) Knebe A., Devriendt J., Mahmood A., Silk J., 2002, MNRAS, 329, 813
- Moore et al. (1998) Moore B., Governato F., Quinn T., Stadel J. & Lake G. 1998, ApJL, 499, L5
- Moore et al. (1999) Moore B., Quinn T., Governato F., Stadel J. & Lake G. 1999, MNRAS, 310, 1147
- Navarro, Frenk & White (1996) Navarro J. F., Frenk C. S. & White S. D. M. 1996, ApJ, 462, 563 (NFW)
- Navarro, Frenk & White (1997) Navarro J. F., Frenk C. S. & White S. D. M. 1997, ApJ, 487, 73
- Navarro et al. (2004) Navarro J. F., Hayashi E., Power C., Jenkins A., Frenk C. S., White S. D. M., Springel V., Stadel J. & Quinn T. R. 2004, MNRAS, 349, 1039
- Power et al. (2003) Power C., Navarro J. F., Jenkins A., Frenk C. S., White S. D. M., Springel V., Stadel J., & Quinn T., 2003, MNRAS, 338, 14
- Press & Schechter (1974) Press W. H. & Schechter P., 1974, ApJ, 187, 425
- Seljak & Zaldarriaga (1996) Seljak U. & Zaldarriaga M., 1996, ApJ, 469, 437
- Springel et al. (2001a) Springel V., White S. D. M., Tormen G. & Kauffmann G. 2001, MNRAS, 328, 726
- Springel et al. (2005) Springel et al., 2005, Nature, 435, 629
- Springel (2005a) Springel V. 2005a, preprint (astro-ph/0505010)
- Tormen & Bertschinger (1996) Tormen G., & Bertschinger E. 1996, ApJ, 472, 14
- White, Frenk & Davis (1983) White S. D. M., Frenk C. S., & Davis M., 1983, ApJ, 274, L1
- White (1984) White S. D. M. 1984, ApJ