Cluster Formation in Protostellar Outflow-Driven Turbulence
Abstract
Most, perhaps all, stars go through a phase of vigorous outflow during formation. We examine, through 3D MHD simulation, the effects of protostellar outflows on cluster formation. We find that the initial turbulence in the cluster-forming region is quickly replaced by motions generated by outflows. The protostellar outflow-driven turbulence (“protostellar turbulence” for short) can keep the region close to a virial equilibrium long after the initial turbulence has decayed away. We argue that there exist two types of turbulence in star-forming clouds: a primordial (or “interstellar”) turbulence and a protostellar turbulence, with the former transformed into the latter mostly in embedded clusters such as NGC 1333. Since the majority of stars are thought to form in clusters, an implication is that the stellar initial mass function is determined to a large extent by the stars themselves, through outflows which individually limit the mass accretion onto forming stars and collectively shape the environments (density structure and velocity field) in which most cluster members form. We speculate that massive cluster-forming clumps supported by protostellar turbulence gradually evolve towards a highly centrally condensed “pivotal” state, culminating in rapid formation of massive stars in the densest part through accretion.
1 Introduction
The origin of the stellar initial mass function (IMF) is a fundamental unsolved problem in star formation. An important clue comes from millimeter and submillimeter observations of the nearby cluster-forming region, rho Oph cloud core, which uncovered prestellar condensations with a mass spectrum that resembles the Salpeter IMF (Motte et al. 1998; Johnstone et al. 2000; Stanke et al. 2005; see Testi & Sargent 1998 for a similar result for the Serpens core). The implication is that the IMF may be determined to a large extent by the core mass distribution from cloud fragmentation. An attractive scenario is turbulent fragmentation. Padoan & Nordlund (2002) showed analytically that, under plausible assumptions, an IMF-like core mass distribution can arise naturally from random turbulent compression. This result is corroborated by numerical simulations that include either driven (Li et al. 2004) or decaying turbulence (Tilley & Pudritz 2005; see, however, Ballesteros-Paredes et al. 2005). In this picture, the IMF is determined largely by the properties of the turbulence. Since most stars are thought to form in clusters (Lada & Lada 2003), the origin of the majority of stars boils down to the origin of turbulence in cluster-forming regions.
It is established that supersonic turbulence decays quickly, on a time scale comparable to the turbulence crossing time on the dominant energy-carrying scale, with or without a strong magnetic field (Mac Low et al. 1998; Stone, Ostriker & Gammie 1998; Padoan & Nordlund 1999). In a turbulent cluster-forming region, if the dissipated energy is not replenished quickly, the cloud would be in a state of low level of turbulence and/or global free-fall collapse, neither of which is commonly observed (Evans 1999; Garay 2005). The turbulence must therefore be replenished somehow. The most likely mechanism is through (proto)stellar outflows, which are observed in abundance in nearby embedded clusters such as NGC 1333 (Knee & Sandell 2000; Bally et al. 1996).
The idea of outflow-regulated star formation goes back to Norman & Silk (1980). They envisioned that star-forming clouds are constantly stirred up by the winds of optically revealed T Tauri stars. This scenario was strengthened by the discovery of molecular outflows, which point to even more powerful winds from the stellar vicinity during the protostellar phase of star formation (Lada 1985; Bontemps et al. 1996). The protostellar outflows were incorporated into a general theory of photoionization-regulated star formation in magnetic clouds by McKee (1989). Their effects on cluster formation were examined by Matzner & McKee (2000) using a parametrized rate of turbulence decay and a time dependent form of the virial theorem that treats the cloud as a whole. The cloud internal dynamics, such as mass distribution and velocity field, remain to be quantified.
In this letter, we present a 3D MHD simulation of cluster formation in turbulent, magnetized clouds including protostellar outflows. In agreement with previous work, we find that the initially imposed turbulence decays away quickly. We demonstrate that it is replaced by outflow-generated motions, which keep the cluster-forming region in an approximate virial equilibrium and allow for gradual star formation long after the decay of initial turbulence (§ 2). We argue in § 3 that it is the protostellar outflow-generated turbulence (“protostellar turbulence” hereafter), as opposed to the primordial (or “interstellar”) turbulence that prevails in regions of molecular clouds that are little affected by local star formation activities, that is directly relevant to the formation of the majority of stars, including massive stars.
2 Protostellar Turbulence: An Example
We illustrate the outflow-generated protostellar turbulence associated with cluster formation using a specific numerical example. Extensive parameter exploration is described in Nakamura & Li (2006).
We consider a centrally condensed cloud of density profile inside a sphere of radius (where is the size of our cubic computational box) and constant density outside. We pick a box size 9 times the Jeans length where is the central density and km/s the isothermal sound speed. Scaling by pc, we have a cloud size pc, central number density , and mass , all typical of nearby cluster-forming clumps (e.g., Ridge et al. 2003). We use as time unit the gravitational collapse time It is 3.27 times the free fall time at the cloud center and about longer than that at the average cloud density. Periodic conditions are imposed at the cloud boundaries.
At the beginning of simulation, we impose on the cloud a uniform field along the axis, a moderate rotation along the axis, and a strong turbulence. The field strength is chosen to be The cloud is magnetically supercritical as a whole, with a flux-to-mass ratio 0.19 times the critical value in the central flux tube. The cloud rotation is specified by inside the sphere of radius (where is the distance from the rotation axis) and zero outside. The maximum rotation speed is 1.5 times the sound speed. The cloud is stirred with a turbulent velocity field of power spectrum and rms Mach number . Following the standard practice (e.g., Ostriker et al. 1999), random realization of the power spectrum is done in Fourier space. The turbulence is allowed to decay freely, except for feedback from protostellar outflows.
The evolution of the turbulent, rotating, magnetized cloud is followed using a 3D MHD code based on an upwind TVD scheme (see Nakamura & Li 2006). Our simulation has a relatively modest resolution of . When the density in a cell crosses the threshold , we define around it a “core” that includes all cells in direct contact with the cell, either through a surface, a line or a point. The core is a cubic region having 3 cells on each side. We extract of mass and momentum from the core, and put them in a Lagrangian particle at the core center. The particle represents a formed “star”, whose subsequent motion in the cluster potential is followed numerically. The mass remaining in the core is assumed to be driven radially away in an outflow, with a momentum proportional to the stellar mass . The proportionality constant (outflow momentum per unit stellar mass) is uncertain. Nakamura & Li (2006) estimated a plausible range of km/s. We adopt km/s, which is close to the value 40 km/s adopted by Matzner & McKee (2000) in their semi-analytic model of cluster formation. Our recipe for mass extraction and protostellar outflow, while schematic, enables us to follow the cloud evolution well beyond the run-away collapse of the first density peak without violating the Jeans criterion (Truelove et al. 1997).
In Fig. 1, we plot the total kinetic energy of the gas as a function of time (in unit of gravitational collapse time ). In agreement with previous calculations, the turbulent energy decays quickly, to of its initial value in as little as . The decrease slows down at later times, partly because the decay time lengthens as the gas moves more slowly, and partly because of cloud contraction, which feeds gravitational binding energy into kinetic energy. By , the first star has formed. It injects energy (and momentum) into the surrounding gas through an outflow, which shows up as the first spike on the kinetic energy curve in Fig. 1. Each of the subsequently formed stars also produces a spike. Together they reverse the decline of kinetic energy. The rms flow speed of the cloud reaches km/s toward the end of the simulation. The kinetic energy is to be compared with the gravitational energy of the system (also plotted in Fig. 1), which increases gradually with time as the cloud contracts. After the onset of star formation the kinetic energy remains comparable to the potential energy, indicating that the cloud is close to a virial equilibrium.
The quasi-equilibrium state is achieved through a realistic level of star formation. At the time , there are 38 stars formed, with an efficiency (defined as the fraction of cloud mass turned into stars) of . The average mass of these stars is , which is typical of low-mass stars. The efficiency increases to at , and to at . The latter values are typical of the efficiencies inferred for nearby embedded clusters (Lada & Lada 2003). Note that star formation can be rather bursty, particularly at late times, when stars are formed at a relatively high rate.
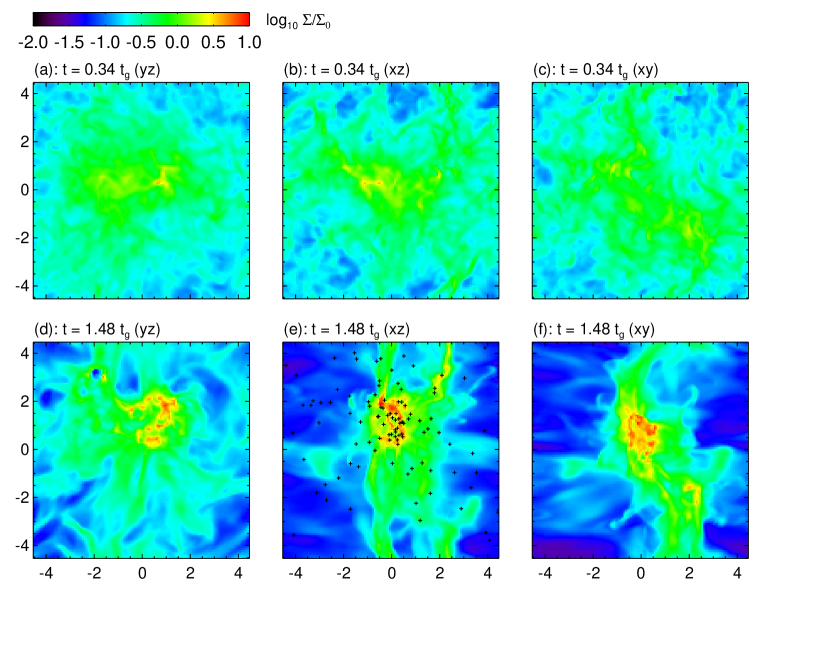
The cloud morphology is transformed by active star formation. In Fig. 2, we show maps of column density at two representative times: one before star formation at , and the other at , when 102 stars have formed. Before star formation the cloud appears relatively diffuse, with substructures created mostly by the (“interstellar”) turbulent velocity field imposed at the beginning of cloud evolution and, to a lesser extent, by moderate gravitational contraction. As time progresses, the initial turbulence dissipates, leading to more and more dense gas accumulating near the bottom of the gravitational potential well. The bulk of the dense gas is prevented from collapsing promptly into stars by protostellar outflows. While waiting to collapse, it is stirred up repeatedly, and often shredded into pieces, some of which coalesce into larger fragments. The abundance of dense, highly fragmented gas in the lower panels attests to the churning of cluster-forming gas by protostellar outflows. The churning results in a “protostellar turbulence” that appears distinct from the “interstellar turbulence” found before significant star formation or outside cluster-forming regions. The difference is quantified in Nakamura & Li (2006).
3 Implications on IMF and Massive Star Formation
The protostellar turbulence found in our simulation may be identified with the nonthermal gas motions observed in embedded clusters such as NGC 1333, where stars have already formed (Lada et al. 1996). Molecular line (e.g., Walsh et al. 2005) and dust continuum observations of the region (Sandell & Knee 2001) have revealed an abundance of dense fragmented gas, which broadly resembles the distribution shown in panel (f) of Fig. 2. There is also plenty of evidence for outflow activities, both current and past. Knee & Sandell (2000) mapped overlapping CO molecular outflows in the central part of the region. They suggested that the dense star-forming gas is fragmented by outflows, as seen in our simulation. Bally et al. (1996) identified more than one dozen HH flows. These collimated jets, to be simulated in near future, can propagate far from the YSOs that drive them and deposit part of their energy and momentum outside the dense ridge where active star formation is taking place. Quillen et al. (2005) uncovered CO shells in 13CO data cube, which they interpret as “fossil” outflows from earlier star formation. In addition, there are filaments emanating from the dense ridge into the lower density envelope (A. Goodman, priv. comm.), similar to those shown in panel (f) of Fig. 2. They could be associated with the blowouts of outflow-driven shells, akin to Galactic HI chimneys. Taken together, these observations leave little doubt that the star formation in NGC 1333 is strongly affected by outflows.
In cluster-forming regions like NGC1333, the initial “interstellar” turbulence dissipates quickly, and is replaced by protostellar turbulence. The initial turbulence sets the conditions for the formation of the first stars in a cluster. The majority of the cluster members are produced, however, after the initial turbulence has already decayed away, and replaced by protostellar turbulence (see Fig. 1). Therefore, it is the protostellar, rather than interstellar, turbulence that is more directly relevant to cluster formation. Since most stars are thought to form in clusters (Lada & Lada 2003), we conclude that the majority of all stars form in environments shaped by protostellar turbulence. In this picture, protostellar outflows play a dual role in determining stellar masses: individually, they limit the mass accretion onto their driving protostars (Matzner & McKee 2000; Shu et al. 2004). Collectively, they quickly replace the interstellar turbulence in controlling the velocity field and mass distribution of the cluster-forming gas. In our view, the protostellar turbulence holds the key to understanding of the origin of the masses of the majority of stars, including perhaps massive stars.
Massive stars are observed to form in clusters. The current debate centers on the scenarios of competitive accretion and stellar merger (Bonnell et al. 1998) and turbulent core accretion (McKee & Tan 2002). Our calculations demonstrated that, in the presence of protostellar outflows of reasonable strength, the gas in a cluster forming region can be kept close a virial equilibrium (see also Matzner & McKee 2000). The virialized gas would be difficult to capture efficiently by the stellar seeds envisioned in the competitive accretion scenario, as emphasized by Krumhotz et al. (2005), although higher resolution and refined treatment of outflows are needed to draw a firmer conclusion.
McKee & Tan (2002) envisioned the formation of individual massive stars (of say ) in discrete massive cores (of say ). The cores are assumed to be part of a mass spectrum determined by a turbulence of unspecified origin. If the formation of massive stars in a cluster is preceded by a period of vigorous low-mass star formation, it is likely that the outflows from the low mass stars would quickly transform the turbulence in the cluster into a protostellar turbulence. Some support for this assertion comes from observations of infrared dark clouds, which are thought to be progenitors of massive stars and clusters (Menten 2005). The majority do not show clear evidence of free-fall collapse (Garay 2005; see however Wu & Evans 2003 and Peretto et al. 2005 for examples of rapid infall), indicating quick replenishment of decayed turbulence, most likely by outflows. In some sources, outflow activities associated with low mass star formation are clearly detected (for recent examples, see Rathborne et al. 2005 and Beuther et al. 2005). If this is the case in general, protostellar turbulence may hold the key to understanding the origin of massive stars as well.
We offer a speculative scenario of massive star formation in protostellar turbulence that has conceptual parallels to the standard picture of isolated low-mass star formation (Shu et al. 1987; Mouschovias & Ciolek 1999), where a magnetically supported clump gradually evolves towards a “pivotal” state of power-law density distribution through ambipolar diffusion. The “pivotal” state separates the gradual phase of core formation from the more dynamic phase of protostellar collapse and mass accretion (Li & Shu 1996). We postulate that if a cluster-forming clump is massive and tightly bound enough to withstand the disruption by outflows from low and intermediate mass stars, it may gradually evolve towards a similar “pivotal” state. The protostellar turbulence may play the role of clump-supporting magnetic field envisioned in the standard picture. The gravitational settling of clump mass towards the bottom of potential well between outflows may play the role of ambipolar diffusion in driving the (clumpy) clump-wide density distribution towards a power-law – the initial (t=0) condition for massive star formation, by accretion, from inside out.
In this picture, there is no need for a pre-existing massive core to form a massive star, although one can plausibly identify the highest density peak at the bottom of the cluster potential well as a McKee-Tan core, once the region has become observationally distinguishable from the background. By this time, the (small) core may already be well on its way to dynamical collapse (and thus short-lived), accelerated perhaps by outflow trapping at high densities which effectively shuts off turbulence replenishment. In this interpretation, the core is automatically created at a privileged location - near the clump’s (gravitational) center. The formation of massive stars may then be regarded as the culminating event of the (dissipative) gas evolution in massive cluster-forming clumps, perhaps not dissimilar to the formation of massive black holes at the centers of galaxies. This picture is consistent with the observations that ultracompact HII regions are usually found at the peaks of massive dust cores (Garay 2005), and hot molecular cores are often surrounded by more massive clumps of approximately power-law density distribution (Cesaroni 2005). Detailed calculations, now underway, will be used to test this scenario.
References
- (1) Ballesteros-Paredes, J., Gazol, A., Kim, J. et al. 2005, astro-ph/050959
- (2) Bally, J., Devine, D. & Reipurth, B. 1996, 473, L49
- (3) Bonnell, I. A., Bate, M. R. & Zinnecker, H. 1998, MNRAS, 298, 93
- (4) Bontemps, S., Andre, P., Tereby, S. & Cabrit, S. 1996, AA, 314, 477
- (5) Cesaroni, R. 2005, in “Massive Star Birth: A Crossroads of Astrophysics,” IAU No. 227, eds. R. Cesaroni, M. Felli, E. Churchwell & C. M. Walmsley, p.59
- (6) Evans, N. J. 1999, ARAA, 37, 311
- (7) Garay, G. 2005, in “Massive Star Birth: A Crossroads of Astrophysics,” IAU No. 227, eds. R. Cesaroni, M. Felli, E. Churchwell & C. M. Walmsley, p86
- (8) Johnstone, D., Wilson, C. D., Moriarty-Schieven, G., et al. 2000, ApJ, 545, 327
- (9) Krumhotz, M., McKee, C. F. & Klein, R. 2005, nature, in press
- (10) Knee, L. B. G. & Sandell, G. 2000, AA, 361, 671
- (11) Lada, C. J. 1985, ARAA, 23, 26
- (12) Lada, C. J. & Lada, E. A. 2003, ARAA, 41, 57
- (13) Li, P. S., Norman, M. L., Mac Low, M.-M., & Heitsch, F. 2004, ApJ, 605, 800
- (14) Mac Low, M.-M., Klessen, R. S., Burkert, A., & Smith, M. D. 1998, Phys. Rev. Lett., 80, 2754
- (15) McKee, C. F. 1989, ApJ, 345, 782
- (16) McKee, C. F. & Tan, J. C. 2002, nature, 416, 59
- (17) Matzner, C. D. & McKee, C. F. 2000, ApJ, 545, 364
- (18) Menten, K., Pillai, T. & Wyrowski, F. 2005, in “Massive Star Birth: A Crossroads of Astrophysics,” IAU No. 227, eds. R. Cesaroni, M. Felli, E. Churchwell & C. M. Walmsley, p.23
- (19) Motte, F., Andre, P. & Neri, R. 1998, AA, 336, 150
- (20) Mouschovias, T. & Ciolek, G. 1999, in The Origins of Stars and Planetary Systems, ed. C. Lada & N. Kylafis (Kluwer), p. 305
- (21) Nakamura, F. & Li, Z.-Y. 2006, ApJ, to be submitted
- (22) Norman, C. & Silk, J. 1980, ApJ, 238, 158
- (23) Ostriker, E. C., Gammie, C. F. & Stone, J. M. 1999, ApJ, 513, 259
- (24) Padoan, P. & Nordlund, A. 1999, ApJ, 526, 279
- (25) Padoan, P. & Nordlund, A. 2002, ApJ, 576, 870
- (26) Peretto, N., Andre, P. & Belloche, A. 2005, AA, astro-ph/0508619
- (27) Quillen, A. C., Thorndike, S. L., Cunningham, A. et al. 2005, ApJ, 632, 941
- (28) Ridge, N. A., Wilson, T. L., Megeath, S. T., Allen, L. E. & Myers, P. C. 2003, AJ, 126, 286
- (29) Sandell, G. & Knee, L. 2001, ApJ, 546, L49
- (30) Shu, F. H., Adams, F. C., & Lizano, S. 1987, ARA&A, 25, 23
- (31) Shu, F. H., Li, Z.-Y. & Allen, A. 2004, ApJ, 601, 930
- (32) Stone, J. M., Ostriker, E. C., & Gammie, C. F. 1998, ApJ, 508, L99
- (33) Stanke, T., Smith, M. D., Gredel, R. & Khanzadyan, T. 2005, astro-ph/0511093
- (34) Testi, L. & Sargent, A. I. 1998, ApJ, 508, L91
- (35) Tilley, D. & Pudritz, R. 2005, astro-ph/058562
- (36) Truelove, J. K., Klein, R. I., McKee, C. F., et al. 1997, ApJ, 489, 179
- (37) Rathborne, J. M., Jackson, J. M., Chambers, E. T. et al. 2005, ApJ, 630, L181
- (38) Walsh, A. J., Bourke, T. L. & Myers, P. C. 2005, astro-ph/0510066
- (39) Wu, J. & Evans, N. J. 2003, ApJ, 592, L79