Correlations of near-infrared, optical and X-ray luminosity for early-type galaxies
Abstract
The relation between X-ray luminosity and near-infrared luminosity for early-type galaxies has been examined. Near-infrared (NIR) luminosities should provide a superior measure of stellar mass compared to optical luminosities used in previous studies, especially if there is significant star-formation or dust present in the galaxies. However, we show that the X-ray-NIR relations are remarkably consistent with the X-ray-optical relations. This indicates that the large scatter of the relations is dominated by scatter in the X-ray properties of early-type galaxies, and is consistent with early-types consisting of old, quiescent stellar populations.
We have investigated scatter in terms of environment, surface brightness profile, Mg2, H, H line strength indices, spectroscopic age, and nuclear H emission. We found that galaxies with high Mg2 index, low H and H indices or a ‘core’ profile have a large scatter in , whereas galaxies with low Mg2, high H and H indices or ‘power-law’ profiles, generally have erg s-1. There is no clear trend in the scatter with environment or nuclear H emission.
keywords:
galaxies:general–galaxies:fundamental parameters1 Introduction
Early-type galaxies are known to emit X-rays via discrete populations of low-mass X-ray binaries and via a hot thermal plasma (Fabbiano & Trinchieri 1984; Forman et al. 1985; Fabbiano 1989). The correlation of X-ray luminosity () and B-band optical luminosity () has been studied to examine the variation of gas properties as a function of galaxy mass (see e.g. O’Sullivan et al. 2001a; Mathews & Brighenti 2003 for a review). It is found that there is a transition in the X-ray emission, and hence the hot gas content, of galaxies at . Galaxies less luminous than this threshold have X-ray emission dominated by discrete sources, and display a relation . Above this threshold, there is an excess of X-ray emission attributed to hot gas emitting via thermal Bremsstrahlung, and hence a steeper relation of ∼2 (O’Sullivan et al. 2001a).
The scatter of the : relation is very large, varying by orders of magnitude for galaxies of similar (Mathews & Brighenti 2003). Several physical phenomena have been examined to account for this scatter. Mathews & Brighenti (2003) list: environmental and intrinsic galaxy properties (White & Sarazin 1991; Eskridge et al. 1995a; Eskridge et al. 1995b; Eskridge et al. 1995c; Henriksen & Cousineau 1999; Brown & Bregman 2000), differences between power-law ellipticals and core ellipticals due to their different location within groups and the additional contribution of intragroup gas to centrally located ellipticals (Pellegrini 1999; Helsdon et al. 2001; Matsushita 2001), the influence of rotation and flattening (Nulsen et al. 1984; Kley & Mathews 1995; Brighenti & Mathews 1996; Pellegrini et al. 1997; D’Ercole & Ciotti 1998), the influence of type Ia supernovæ and cooling flows (Ciotti et al. 1991), the extent of the diffuse gas (Mathews & Brighenti 1998) and ram-pressure stripping (Toniazzo & Schindler 2001). Recently Pipino et al. (2005) have shown that a late secondary accretion of gas can account for the : relation of massive galaxies, and the large observed scatter.
These phenomena play a role in contributing to the large scatter in the : relation, but there is often conflicting evidence and/or too little scatter explained.
All the phenomena above relate to an increase in scatter of the X-ray luminosity. The assumption that the scatter is due to variance in rather than is reasonable, since the stellar populations of early-type galaxies are generally thought to be old, passively evolving systems, especially for galaxies in clusters (e.g. Stanford et al. 1998; De Propris et al. 1999; Bell et al. 2004; Holden et al. 2004; Ellis & Jones 2004). However, some authors find that there is some evolution of early-type galaxies not attributable to purely passive evolution (e.g. Butcher & Oemler 1984; Dressler et al. 1997; Drory et al. 2003; van de Ven et al. 2003; Reda et al. 2004) in agreement with models of structure formation which predict a merger origin for elliptical galaxies (e.g. Baugh et al. 1996).
If elliptical galaxies are not all old and quiescent then there may be significant inconsistencies between the optical B-band luminosity and the mass of a galaxy. The presence of young stars can significantly enhance the blue luminosity of a galaxy, and hence the B-band would yield an inaccurate estimate of galaxy mass in the presence of young stellar populations. Thus, the assumption that the B-band luminosity contributes an insignificant scatter to the : relation needs to be tested.
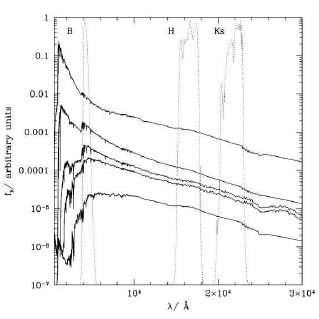
Near-infrared (NIR) luminosities are much more closely correlated with dynamical and total galaxy mass than optical luminosities (Gavazzi et al. 1996), since NIR emission is dominated by longer lived stellar populations, and has little contribution from young, bright stars. Figure 1 shows the model spectral energy distribution of a simple stellar population at ages, 10Myr, 100Myr, 500Myr, 1Gyr and 9Gyr, from the libraries of Bruzual & Charlot (2003). Also shown are the transmission profiles of the B, H and Ks bands. The difference between the two stellar populations due to the massive, short lived stars will clearly have a much stronger effect on the B-band luminosity than the H or Ks luminosities, e.g. between the ages of 100Myr and 9Gyr, the B band luminosity of a simple stellar population decreases by times more than the decrease in the K band luminosity, or times between 1Gyr and 9Gyr.
The NIR is also much less affected by the presence of dust. Galactic extinction in the K band is typically a factor of times the B-band extinction (Schlegel et al. 1998). Thus if some elliptical galaxies contain significant amounts of dust the NIR will be a better indicator of the underlying stellar mass. About 80% of early-type galaxies contain dust, though this is mainly confined to the central kpc (Mathews & Brighenti 2003). Theoretical work suggests that more widely distributed dust will be rapidly sputtered (e.g. Tsai & Mathews 1995), therefore the presence of dust is unlikely to affect global NIRoptical colours. However, more extended filaments of dust have been observed in some galaxies (Tran et al. 2001). Any effect due to dust, though expected to be small, will be much reduced in the NIR.
The improved measure of galaxy mass attainable through NIR photometry provides an opportunity to recast the : relation as an : relation (or :). Doing so will test the importance of variance in in contributing to the scatter of the : relation. In turn the comparison of the : and : relations may yield information on the stellar populations of elliptical galaxies, in particular the presence of young stars. Accordingly we have reanalysed the X-ray catalogue of early-type galaxies of O’Sullivan et al. (2001a), supplemented with H and Ks band luminosities from the Two Micron All Sky Survey (2MASS).
The paper is organised as follows. Section 2 introduces the X-ray catalogue of O’Sullivan et al. (2001a), and section 3 describes the NIR data. Section 4 describes the statistical analyses used to fit the relations. Section 5 describes the correlations, and the new measurements of the scatter as a function of environment, surface brightness profile, Mg2, H and H emission line strength and nuclear H emission. Finally section 6 discusses the results in terms of the origin of the scatter and the stellar populations of early-type galaxies.
2 Sample
O’Sullivan et al. (2001a) present a catalogue of X-ray luminosities for 425 galaxies, of which 401 are early-types. The galaxies were selected from the Lyon-Meudon Extragalactic Data Archive (LEDA) to satisfy the following criteria.
-
1.
Morphological type (i.e. E and S0 galaxies).
-
2.
Virgo-corrected recession velocity km s-1.
-
3.
Apparent magnitude .
Since LEDA is complete at , criteria (ii) and (iii) should provide a sample with high statistical completeness. This selection yielded galaxies. For 136 of these, O’Sullivan et al. (2001a) used PSPC data from archival ROSAT pointings to derive X-ray luminosities. Circular extraction regions were chosen, with cut-off radii set at the point where the source emission dropped to the background level. In the case of groups and clusters, the surrounding intra-cluster medium was considered as the background. Spectra were extracted and fit with a fixed 1 keV, solar abundance MEKAL model (Kaastra & Mewe 1993; Liedahl et al. 1995). Hydrogen absorption column densities were fixed at galactic values using the survey of Stark et al. (1992). Such a model is clearly an over-simplification of the actual spectrum of emission from early-type galaxies, but was chosen to allow easy comparison with other catalogues which use similar models, to be relatively representative of the majority of early-type galaxies, and to allow fitting of a simple model to the entire dataset. While more complicated multi-component models would have provided more accurate estimates of the properties of the best-observed systems, they would not have been applicable to those systems with few counts, and would have made direct comparisons difficult. Bolometric X-ray luminosities were determined, and the authors note that if the lowest luminosity galaxies were in fact better fitted by a 10 keV bremsstrahlung model (an approximation of the spectrum expected from a galaxy dominated by X-ray binaries), these luminosities would be underestimated by only a factor of 2.
For another 265 galaxies, X-ray luminosities were available from the surveys of Beuing et al. (1999), Fabbiano et al. 1992 or Roberts et al. (1991). These surveys were based on ROSAT All-Sky Survey data or on Einstein Imaging Proportional Counter pointed data, and made use of a range of spectral models, wavebands and distance scales. Corrections were therefore made to bring the X-ray luminosities from these catalogues into line with those of O’Sullivan et al. (2001a), and tests performed using galaxies listed in more than one sample, to ensure that the final luminosities were comparable. A small number of objects with divergent luminosities were excluded, but these were mainly found to be AGN, or confused with other sources. After correction, the X-ray luminosities from the literature were found to be in good agreement with those derived by O’Sullivan et al., producing a final sample of 401 galaxies (of which 50% have only X-ray upper limits) , the most extensive catalogue of its type to date. Further details of this sample and its construction can be found in O’Sullivan et al. (2001a). The size of the catalogue is its main strength for our purposes; searching for correlations with other properties requires a large sample in order to ensure statistical accuracy, particularly when working with upper limits. The main weaknesses of the catalogue are the inherent inaccuracies associated with the estimation of the values. Both the choice of model and the definition of extraction region could potentially lead to errors in the final . However, in the vast majority of cases, neither factor should cause severe inaccuracies. It should also be noted that improving on the sample is not currently possible; other samples of the ROSAT/Einstein era are smaller and in some case less well defined, and while the Chandra and XMM Newton observatories could provide the collecting area, spectral and spatial resolution required for a superior catalogue, the number of suitable ellipticals available in their archives is as yet too small for our purpose.
3 Near-infrared data
Near-infrared photometry has several advantages over optical photometry as an indicator of galaxy mass. The flux in the NIR is dominated by old, long-lived stellar populations, whereas blue luminosities can be greatly enhanced by a relatively small number of young, bright, massive stars. Furthermore the galactic extinction in the NIR is much smaller than at optical wavelengths, reducing the uncertainty introduced in correcting for extinction.
The 2MASS covers 99.998% of the sky in the J, H and Ks bands. Sensitivity for extended sources is 14.7, 13.9 and 13.1 mag at J, H and Ks respectively (Jarrett et al. 2000). H and Ks band magnitudes have been extracted from the Extended Source Catalogue (XSC, Jarrett et al. 2000) and the Large Galaxy Atlas (LGA, Jarrett et al. 2003) using the NASA Extragalactic Database (NED). Where magnitudes were available from both catalogues the LGA was preferred since it accounts for the incompleteness of the XSC for galaxies greater than diameter, which may be incorrectly sampled if they are located close to the edge of a 2MASS scan, since they are larger than the overlap between scans, and consequently may be truncated. Thus the LGA constructs mosaics of the largest galaxies and derives magnitudes from these. Throughout we have used Kron (1980) magnitudes as reported from NED queries.
NIR photometry has been obtained for 400 of the 425 galaxies catalogued by O’Sullivan et al. (2001a), of which 376 are early-types. Magnitudes have been converted to units of H and Ks solar luminosities assuming (Cox 2000), (Colina & Bohlin 1997) and (Toft et al. 2003). Note that while the conversion to units of solar luminosity may not be absolutely calibrated for the 2MASS filters used (although they should not be very different from the values quoted), any error in the value of and will only result in an error in the normalisation of the : and : relationships. The slope and scatter will be unaffected. Since we are mainly concerned with the slope and scatter of the relation, absolute calibration of the magnitude of the sun in the 2MASS filters is not needed.
The X-ray, NIR and optical luminosities are listed, along with other data used in this paper, in Table LABEL:tab:bigtab.
4 Statistical analysis
The fitting of :, : and : relations is complicated by the fact that many of the X-ray detections are upper limits. To deal with this the method of O’Sullivan et al. (2001a) has been repeated for the NIR relations, and is summarised here.
Survival analysis has been used to estimate the true values associated with the upper limits. Survival analysis assumes that the upper limits are unrelated to the true values, and uses the distribution of detections in the catalogue below each upper limit to model the probability distribution of the true value associated with that upper limit. O’Sullivan et al. (2001a) show that this is a reasonable assumption for the catalogue since for the majority of the galaxies there is no relation between the luminosity of the source and the sensitivity of the observation due to the large number of serendipitous detections. See O’Sullivan et al. (2001a) for a full discussion of potential sources of bias in the sample and the benefits and weaknesses of the fitting methods used.
To fit lines to the relations two methods have been used: the expectation and maximisation algorithm (EM) and the Buckley-James algorithm (BJ)111See iraf task stsdas.analysis.statistics.survival for an introduction to survival analysis. using the asurv software package (Lavalley et al. 1992). The EM method is parametric and assumes the residuals to the line follow a Gaussian distribution. The BJ method is non-parametric and calculates the regression using the Kaplan & Meier (1958) estimator for the residuals (see Feigelson & Nelson 1985). In principal the two methods should agree, disagreement would suggest the fits are not robust. We find very good agreement between the two methods in all cases, and hence we only show the EM fits in the plots throughout the paper.
5 Results
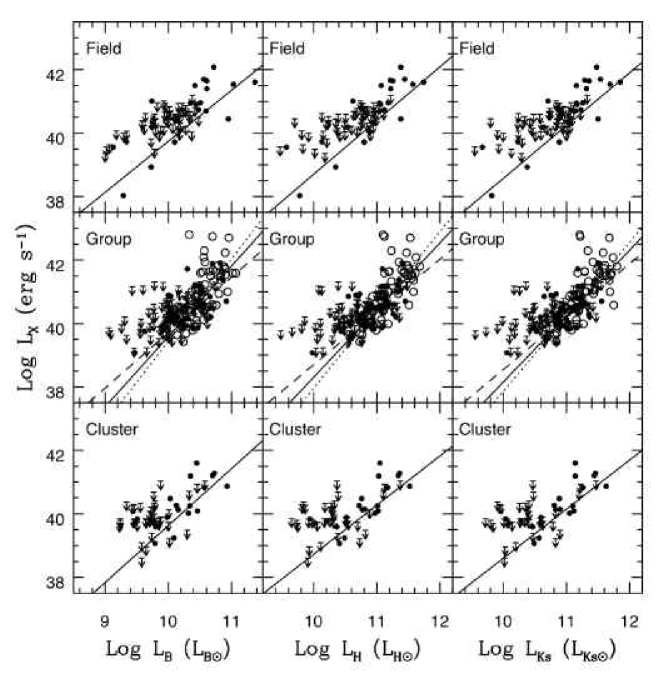
The relation between and , , has been investigated for all early-type galaxies for which NIR data have been obtained. Plots of log vs. log, log and log are shown in Figures 2, 3 and 4 respectively. Galaxies were sub-divided into brightest cluster galaxies (BCGs), brightest group galaxies (BGGs), AGN and dwarfs (log (/) ). Fits have been made using three groups.
-
1.
All galaxies excluding late-types, AGN, BCGs and dwarfs (solid line).
-
2.
As (i) but also excluding BGGs (dashed line).
-
3.
As (ii) but also excluding galaxies at a distance Mpc (for which environment is not robust), NGC 5102 and NGC 4782 (dotted line). NGC 5102 (which has very low /) and NGC 4782 (which has very high ) drive the fits unless excluded (see O’Sullivan et al. 2001a for a discussion of the unusual / values for these galaxies).
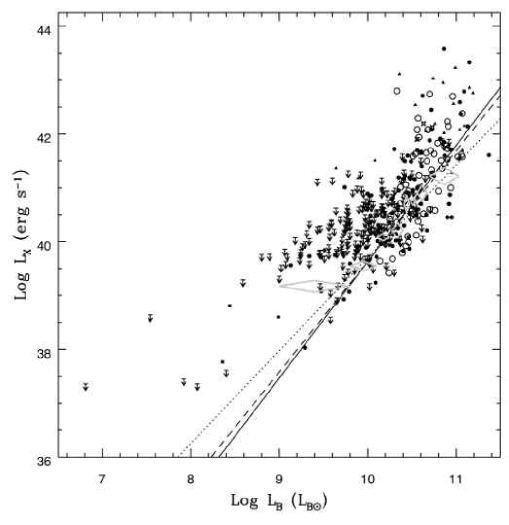
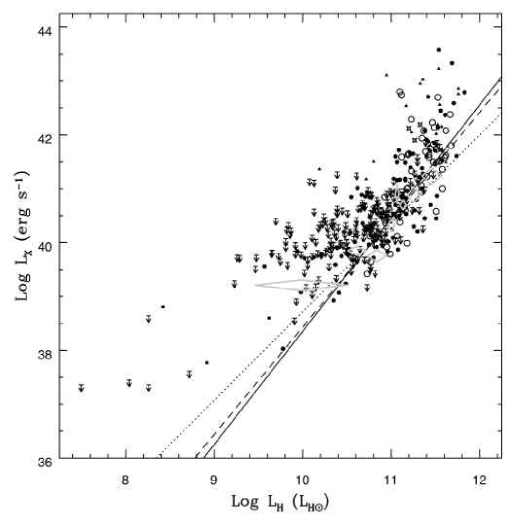
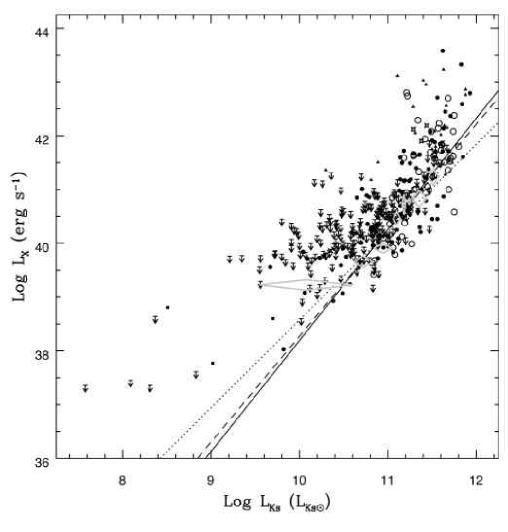
The best fits for each subsample are listed in Table 1 showing the strong agreement between colours. The different subsamples are all in good agreement with the exception of the BGGs, which show a steeper relation, in agreement with previous work (O’Sullivan et al. 2001a; Helsdon et al. 2001). All three plots are remarkably similar. Each shows the characteristic transition to steeper slopes for optically brighter (more massive) galaxies, as the hot gas contribution to the X-ray luminosity becomes more significant. This is apparent in comparing the average values of as denoted by the grey diamonds to the best fit lines, which match well at high , , , but not at lower values where the contribution to from discrete sources dominates. The scatter appears similar in each band, with the H-band possibly giving the best fits, since the agreement between the different fitting algorithms is strongest.
| Sample | Ndet | NUL | Band | Method | Slope (error) | Intercept (error) | Std. Dev. |
|---|---|---|---|---|---|---|---|
| Combined (i) | 155 | 173 | EM | 2.16 (0.12) | 18.03 (1.25) | 0.69 | |
| BJ | 2.19 (0.14) | 17.74 | 0.67 | ||||
| EM | 2.10 (0.11) | 17.33 (1.20) | 0.64 | ||||
| BJ | 2.09 (0.12) | 17.46 | 0.61 | ||||
| EM | 2.07 (0.11) | 17.53 (1.19) | 0.63 | ||||
| BJ | 2.21 (0.12) | 15.90 | 0.63 | ||||
| Combined (ii) | 99 | 153 | EM | 2.05 (0.14) | 19.10 (1.41) | 0.69 | |
| BJ | 2.05 (0.15) | 19.17 | 0.67 | ||||
| EM | 1.99 (0.12) | 18.48 (1.36) | 0.64 | ||||
| BJ | 1.99 (0.14) | 18.58 | 0.60 | ||||
| EM | 1.98 (0.12) | 18.55 (1.33) | 0.63 | ||||
| BJ | 1.97 (0.13) | 18.65 | 0.59 | ||||
| Combined (iii) | 83 | 153 | EM | 1.72 (0.14) | 22.47 (1.48) | 0.60 | |
| BJ | 1.71 (0.16) | 22.60 | 0.56 | ||||
| EM | 1.64 (0.13) | 22.28 (1.38) | 0.56 | ||||
| BJ | 1.63 (0.14) | 22.41 | 0.51 | ||||
| EM | 1.63 (0.12) | 22.23 (1.37) | 0.55 | ||||
| BJ | 1.76 (0.14) | 20.83 | 0.52 | ||||
| Cluster | 20 | 35 | EM | 1.80 (0.28) | 21.68 (2.80) | 0.57 | |
| BJ | 1.79 (0.30) | 21.73 | 0.52 | ||||
| EM | 1.55 (0.24) | 23.21 (2.55) | 0.56 | ||||
| BJ | 1.54 (0.25) | 23.41 | 0.49 | ||||
| EM | 1.55 (0.23) | 23.13 (2.53) | 0.56 | ||||
| BJ | 1.53 (0.25) | 23.34 | 0.48 | ||||
| Field | 21 | 52 | EM | 1.61 (0.23) | 23.64 (2.40) | 0.68 | |
| BJ | 1.60 (0.26) | 23.71 | 0.70 | ||||
| EM | 1.67 (0.20) | 21.89 (2.26) | 0.59 | ||||
| BJ | 1.67 (0.22) | 21.89 | 0.58 | ||||
| EM | 1.70 (0.21) | 21.71 (2.31) | 0.59 | ||||
| BJ | 1.70 (0.23) | 21.70 | 0.59 | ||||
| Group (total) | 96 | 82 | EM | 2.20 (0.19) | 17.64 (1.95) | 0.64 | |
| BJ | 2.18 (0.22) | 17.78 | 0.62 | ||||
| EM | 2.10 (0.16) | 17.34 (1.82) | 0.60 | ||||
| BJ | 2.09 (0.19) | 17.51 | 0.57 | ||||
| EM | 2.06 (0.16) | 17.59 (1.80) | 0.60 | ||||
| BJ | 2.04 (0.19) | 17.82 | 0.57 | ||||
| Group (non-BGG) | 44 | 66 | EM | 1.75 (0.22) | 22.22 (2.29) | 0.55 | |
| BJ | 1.73 (0.26) | 22.46 | 0.59 | ||||
| EM | 1.67 (0.20) | 22.04 (2.16) | 0.51 | ||||
| BJ | 1.65 (0.23) | 22.23 | 0.48 | ||||
| EM | 1.67 (0.20) | 21.86 (2.16) | 0.51 | ||||
| BJ | 1.65 (0.23) | 22.05 | 0.48 | ||||
| Group (BGG only) | 53 | 16 | EM | 2.58 (0.36) | 13.60 (3.76) | 0.69 | |
| BJ | 2.57 (0.40) | 13.71 | 0.68 | ||||
| EM | 2.47 (0.30) | 13.23 (3.32) | 0.63 | ||||
| BJ | 2.43 (0.32) | 13.69 | 0.62 | ||||
| EM | 2.35 (0.29) | 14.32 (3.24) | 0.64 | ||||
| BJ | 2.31 (0.32) | 14.87 | 0.63 |
5.1 Environment
The correlations between luminosities have been repeated for galaxies segregated according to environment. Figure 5 shows plots for , and respectively split into field, group and cluster galaxies. Cluster membership has been determined from Abell et al. (1989) and Faber et al. (1989) and group membership has been determined from Garcia (1993). The sample is limited to galaxies within km s-1 by the Garcia (1993) catalogue. Comparison of the panels in Figure 5 again reveals consistency between the different wavebands.
The large scatter around the : relation has often been speculated to be a consequence of environment (Mathews & Brighenti 2003). could be reduced in high density environments due to mechanisms such as ram-pressure stripping of the gaseous haloes. Alternatively an enhancement of is possible due to the stifling of galactic winds by the surrounding intragroup or intracluster gas, and an increase of the gas density due to the surrounding ICM, or due to accretion of gas and/or dark matter from the surrounding medium. The evidence for such effects is inconclusive. Some galaxies located in the central regions of groups or clusters have enhanced due to a contribution from the intragroup or intracluster medium (Helsdon et al. 2001; Matsushita 2001). On the other hand, White & Sarazin (1991) and Henriksen & Cousineau (1999) find that galaxies have lower / if the local galaxy density is high. However Brown & Bregman (2000) find the opposite effect with galaxies in high density regions having higher /. O’Sullivan et al. (2001a), in their larger sample, find no trend with environment except for BGGs, which have larger /, which is thought to drive the result of Brown & Bregman (2000) due to the large fraction of BGGs in their sample (Helsdon et al. 2001).
The effect of environment has been re-examined in the NIR bandpasses. The scatter around the relations of Figure 6 has been calculated using the Kaplan-Meier estimate of the means, and are listed in Table 2 for different environment and waveband. For samples in which the lowest point is an upper-limit, the results may be biased low, since the Kaplan-Meier estimate assumes that the point is a detection. Where this is the case the lower limits have also been given.
| Relation | Mean | Error on mean | Limit |
|---|---|---|---|
| Field | |||
| / | 29.783 | 0.144 | — |
| / | 29.073 | 0.127 | — |
| / | 29.146 | 0.136 | — |
| Clusters | |||
| / | 29.710 | 0.097 | 29.020 |
| / | 29.023 | 0.093 | 28.390 |
| / | 29.111 | 0.091 | 28.490 |
| Groups - total | |||
| / | 30.069 | 0.052 | — |
| / | 29.365 | 0.049 | — |
| / | 29.461 | 0.049 | — |
| Groups - excluding BGGs | |||
| / | 29.936 | 0.055 | 29.390 |
| / | 29.232 | 0.053 | 28.700 |
| / | 29.321 | 0.053 | 28.780 |
| Groups - BGGs only | |||
| / | 30.298 | 0.091 | — |
| / | 29.576 | 0.086 | — |
| / | 29.677 | 0.086 | — |
The scatter in the NIR bands is only marginally smaller than the B-band scatter, implying that the variance in X-ray emission dominates the scatter. This is expected if ellipticals are largely composed of old, quiescent stellar populations possessing relatively little dust. In such a case ellipticals will be optically thin, and both NIR and optical light will be dominated by emission from old, long-lived stars.
There is no clear trend in the mean luminosity ratios with environment. Means are similar throughout all environments examined, with the exception of BGGs. The extremes of the environments investigated, viz. field galaxies and cluster galaxies, are consistent. However, the group environment has slightly higher average values in all bands, and the BGGs have the highest ratios of all.
The high X-ray emission of BGGs may be due to a unique formation mechanism (Bhavsar & Barrow 1985) or may be indicative that processes such as accretion or stifling of galactic winds are active in the group environment. The slightly higher X-ray emission of the group galaxies in general, if real, is supportive of the idea that IGM influences the X-ray emission of galaxies in groups, but the enhancement is stronger for BGGs due their typical location at the centre of the group potential well, where the IGM is densest. However, no such enhancement is seen for cluster galaxies, which would be expected to have a similar enhancement due to the ICM, unless some counter-acting process is responsible such as ram-pressure stripping, which may only be effective in the denser environments of clusters (Fujita 2001).
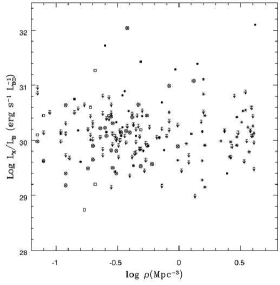
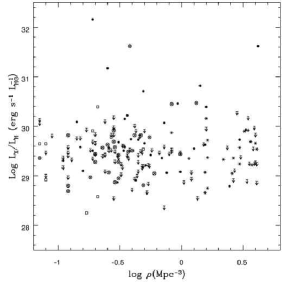
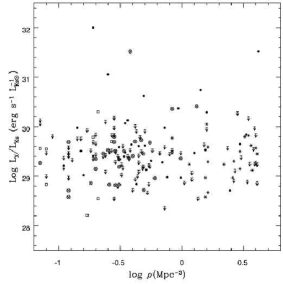
A further test of the influence of environment on the scatter is illustrated in Figure 6. The ratios of log/, log/ and log/ are plotted as a function of Tully (1988) density parameter, for all galaxies in the Tully Nearby Galaxy Catalogue. There is no clear relation in any of the luminosity ratios with local galaxy density, and the scatter appears similar in all wavebands.
As a caveat, we note that this sample does not contain any very high density environments such as rich clusters. Recent Chandra observations presented by Sun & Vikhlinin (2005) show that in the dense environment of A1367 it is likely that only the most massive galaxies are able to retain their X-ray haloes. The haloes of less massive galaxies are probably stripped through interaction with the dense surrounding medium.
5.2 Scatter as a function of core profile
Pellegrini (1999) shows that the global X-ray emission of early-type galaxies is correlated with their internal central properties. Specifically ‘core’ galaxies, defined as having an inner slope of , where , show a large scatter in values of whereas ‘power-law’ galaxies with are restricted to erg s-1. Furthermore core galaxies are associated with boxy, slowly rotating, optically luminous galaxies, whereas power-law galaxies are discy, rapidly rotating systems, which are generally fainter.
It is unlikely that the central stellar components of early-type galaxies are directly influencing the surrounding X-ray haloes. Rather the link between and is more likely to be indirect, since both properties are known to be correlated with . However, since both and could also be linked with formation processes, the form of the relation between the two properties is important.
This correlation has been investigated here, taking determinations of core/power-law and values of and from the work of Pellegrini (1999), Rest et al. (2001), Ravindranath et al. (2002), Michard (1998), Faber et al. (1997) and Bender et al. (1989). For galaxies appearing in more than one paper, preference was in the order of the papers as listed, with the following exceptions. NGC3377 and NGC4564 appear in Pellegrini (1999) as power-law galaxies with , so updated values from Rest et al. (2001) are preferred. Similarly for the core galaxy NGC4374, Pellegrini (1999) quote a value of , which has been replaced by the value of from Ravindranath et al. (2002). In total there are 54 power-law galaxies, 30 core galaxies, 74 galaxies have measured and 93 galaxies have measured .
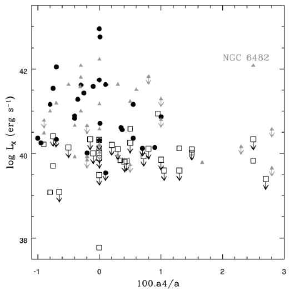
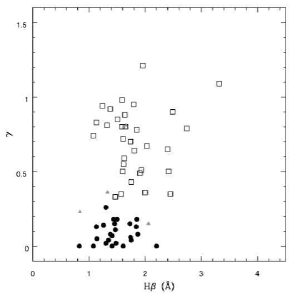
Figure 7, shows as a function of . The trend reported by Pellegrini (1999) is confirmed here, with core galaxies having a much larger range in than power-law galaxies which are restricted to lower values. The same trend is seen in Figure 8 which shows as a function of the deviation from from a pure ellipse, quantified by (Bender et al. 1989), where is the semi-major axis and is the fourth cosine coefficient of the Fourier transform of the azimuthal variations of the isophotes — characterises a galaxy’s boxy or discy nature. It is worth noting that the outlying point at and , is NGC6482, a classic fossil-group galaxy. The high value of is confirmed in a detailed study of Chandra data by Khosroshahi et al. (2004). The galaxy at log in both plots is M32, the only detection in the whole sample fainter than erg s-1.
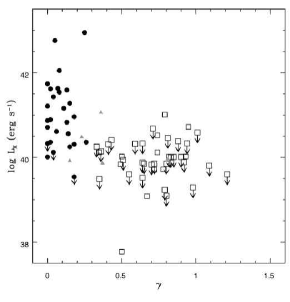
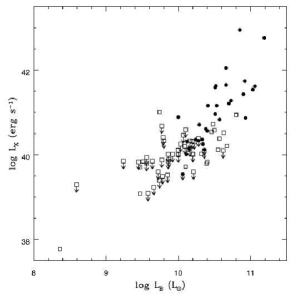
Categorising galaxies as core or power-law galaxies, the : relation has been replotted in Figure 9. The core galaxies are seen to populate the steeper part of the relation, whilst the power-law galaxies are mainly confined to the shallower relation. This is because the power-law galaxies are generally fainter, and therefore less massive systems, whereas the core galaxies are bright and massive. This may go someway to explaining the relation between and ; as both properties are related to , the fact that they are correlated with each other is not surprising. However, it seems unlikely that alone is entirely responsible for the variation in and . No power-law galaxies in the sample have erg s-1, however, some of the power-law galaxies are bright enough in that higher may be expected (see Fig. 9). All the brightest power-law galaxies have lower than would be expected from the : relation, i.e. there seems to be an extra factor other than which also influences the X-ray luminosity and core-profile. Thus it is possible that the : relation may be influenced by both optical luminosity (and therefore stellar mass) and formation mechanism.
Thus the dichotomy in the shape of the low and high / galaxies may be revealing important information about the formation processes at work. Differences in core profile shape could be due to major or minor mergers (Burkert & Naab 2003; Khochfar & Burkert 2003), dissipative or dissipationless mergers (Faber et al. 1997; Ryden et al. 2001), the mass of the central black hole (van der Marel 1999), also monolithic collapse would produce ellipticals with core profiles. It may be possible to discern the more likely of these scenarios by requiring that whatever processes are responsible for the differences in core profile, also produce the observed relations in .
5.3 Line strength indices and galaxy age
Absorption line strengths have been collated for the sample in order to investigate the effects of metallicity and age on the scatter of /. Specifically Mg2, H and H line strength indices have been examined. Mg2 index is degenerate in age and metallicity, but has the advantage that a large sample was available. H and H are sensitive indicators of age, but also suffer from age-metallicity degeneracy. The age-metallicity degeneracy considerable hampers interpretation of the results for all the line indices studied. Values have been collated for 290 galaxies with Mg2 (from HyperLeda), 176 galaxies with H and 62 galaxies with H (from Trager 1997; Kuntschner 2000 and Denicoló et al. 2005).
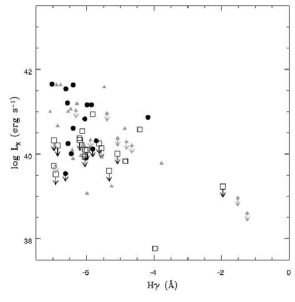
A similar trend to those displayed above by core profile slope, , is found in the Mg2 line strength index, and illustrated in Figure 10. It can be seen that galaxies with weak Mg2 absorption are generally confined to log (erg s-1), whereas high Mg2 galaxies having generally high X-ray emission. Mg2 line strength is degenerate with age and metallicity, with older stellar populations and more metal rich populations both giving rise to high Mg2 index (Casuso et al. 1996). Thus the trend in Figure 10, could be attributed to both the age- relation (O’Sullivan et al. 2001b) or a mass-metallicity relation, which is believed to drive the colour-magnitude relation of elliptical galaxies (Kodama et al. 1998), or a combination of the two.

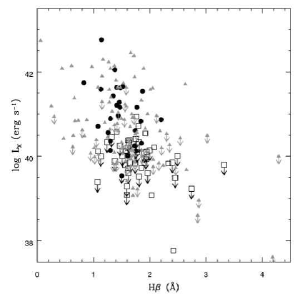
Similarly the trends with H and H have also been investigated. H is a sensitive indicator of age (although the effects of metallicity are not negligible) but may suffer from nebular emission filling in the line in some cases, H is less susceptible to this problem but is also less sensitive to age (Terlevich & Forbes 2002). as function of H and H is plotted in Figures 11 and 12 respectively. Both show similar trends to that found for Mg2, implying that age and/or metallicity is important in accounting for the large values of core galaxies. A plot of as a function of H, reveals only a marginal trend with inner profile slope, and little difference between core and power-law galaxies as in Figure 13.
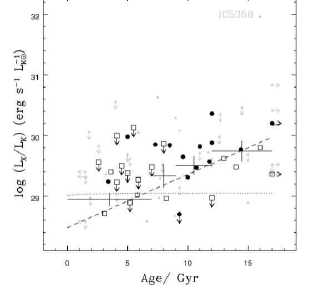
By using a combination of spectral lines it is possible to try and break the age-metallicity degeneracy. For example, Terlevich & Forbes (2002) present a catalogue of galaxy ages using the H line index and the combination index [MgFe]. O’Sullivan et al. (2001b) have used this catalogue to investigate the correlation of / and find an increase in with galaxy age. Figure 14 shows the equivalent plot in terms of . The trend is very similar to that found for /, with / increasing in older galaxies. The correlation has a significance of at least 99.7%, and line fits to the data have slopes of 0.088 0.021 (EM) and 0.107 0.025 (BJ). The former is shown as the dashed line in Figure 14. Excluding IC 5358, which has an unusually high /, flattens the fits slightly, giving slopes of 0.0704 0.0185 (EM) and 0.0989 0.0228 (BJ). As a further test of the nature of the correlation, we binned the sample into subsets by age, insisting that there be a minimum of 7 X-ray detected galaxies in each bin. The mean / (calculated using the Kaplan-Meier estimator) for these bins are shown as large crosses in Figure 14. A part of the trend in / with age will arise from changes in the optical properties of the stellar population over time. We have estimated the change in with age from the models of Bruzual & Charlot (2003), assuming a galaxy with solar metallicity in which 10% of the mass of stars is formed in a starburst, and 90% are old with negligible change of with increasing age. The dotted curve shows the expected change in / for such a galaxy, given an unchanging . As expected, the contribution to the trend in / from evolution of the stellar population is negligible. O’Sullivan et al. (2001b) used a slightly larger number of galaxies than is included in this sample (77 compared to 67), and found better agreement between the two line fitting techniques, but the results for / are clearly very similar to those found for /, in that the mean / increases steadily over the whole range of age in the sample.
5.4 Scatter as a function of galactic nuclear activity
The presence of an active galactic nucleus (AGN) may affect the X-ray (e.g. Ho et al. 2001) and optical emission of a galaxy, and thus a sample which contains galaxies both possessing and lacking AGN may increase the scatter of the : relation. All known AGN have been excluded from the sample, but it is possible that some weaker AGN remain. In order to quantify the amount of galactic nuclear activity the H emission line strength, indicative of a Seyfert I galaxy, has been used. Ho et al. (1997) present H luminosities for the nuclei of 418 galaxies from with the starlight contribution has been subtracted, hence any residual H emission will be from nuclear activity or star-formation. Of the galaxies presented by Ho et al. (1997), 45 overlap with the sample presented here. This sample has been matched to the galaxies of O’Sullivan et al. (2001a), and the dependence of log and log on log is shown in Figure 15. Although the sample is only small it can be seen that there is at best only a weak trend of and / with galactic nuclear activity. The range in and / is similar to the range of the entire sample. Thus it appears that galactic nuclear activity is not responsible for the large scatter observed in the : relation.

6 Discussion
The relationship between X-ray luminosity and NIR luminosity for early-type galaxies has been examined. The results are consistent with previous work studying the relationship between X-ray luminosity and optical luminosity (O’Sullivan et al. 2001a). The :, : and : relations bear the same overall trend, becoming steeper for galaxies that are bright in the optical or NIR. This is consistent with previous interpretations in which more massive galaxies contain larger amounts of hot gas (see Mathews & Brighenti 2003 for a review).
The scatter of the relations is the same in the B, H and Ks bands. This is probably largely because early-type galaxies generally contain very little dust and are composed of old, quiescent stellar populations. Any scatter introduced by residual star-formation or dust present in early-types, must be insignificant compared to the large scatter of the X-ray luminosities.
The scatter and slope of the relations has been investigated as a function of environment. There is no clear trend with environment, either in terms of cluster, group or field membership or in terms of local galaxy density. Brightest group galaxies display a steeper relation and significantly higher /, / and /, than other types of galaxies, perhaps indicative of a different formation mechanism or their location in the densest regions of the IGM, in agreement with O’Sullivan et al. (2001a) and Helsdon et al. (2001). There may also be a slight increase in the / etc. values for group galaxies in general again suggestive that the IGM is influential on the X-ray emission from galaxies through processes such as accretion or stifling of galactic winds. However cluster galaxies, which would be subject to similar processes are consistent with / values of field galaxies, making any firm conclusions difficult to draw. It is possible that differences between group and cluster galaxies, such as merger history, ram-pressure stripping, etc. may be responsible for the lower / of cluster galaxies. For example, it is known that group galaxies are involved in significantly more galaxy-galaxy interactions than cluster galaxies, since the higher velocity dispersion of clusters make the chances of galaxy-galaxy interaction much smaller (Zepf & Whitmore 1993).
Galaxies with a shallow inner core profile cover a wider range in than power-law galaxies with a steep inner profile, which are generally restricted to log (erg s-1). This is in agreement with previous work by Pellegrini (1999). Furthermore the core profile galaxies are observed mainly to occupy the steeper part of the : relation, while the power-law galaxies are generally on the shallower part of the relation. This is suggestive that whatever is causing the break in the : relation is also responsible for the observed differences between core and power-law galaxies, such as rotation velocity, luminosity etc. However, this it is difficult to test this as the large scatter in both relations makes a comparison of the B band luminosities of the breaks hard. An obvious difference is the mass of the systems, but different formation mechanisms are also often speculated as the cause of the difference between power-law and core galaxies (e.g. Faber et al. 1997; Ryden et al. 2001; Burkert & Naab 2003; Khochfar & Burkert 2003).
The effects of age and metallicity were investigated via absorption line strengths. Mg2 index, which is degenerate in age and metallicity, shows a clear demarcation with high index galaxies having a large spread in while lower index galaxies are confined to lower values of . Similar trends are also seen for H and H index which are less degenerate, and more sensitive to age (Terlevich & Forbes 2002). Although this provides support for a relation between age and , as reported by O’Sullivan et al. 2001b, it seems likely that the large spread in for high Mg2 index galaxies is also partly due to a higher mass and subsequent higher metallicity. The age-metallicty degeneracy can be broken using combinations of emission lines. Using the spectroscopic ages of Terlevich & Forbes (2002) reduces the size of the sample, but reveals a strong correlation between / and age. The contribution to this correlation due to the dimming of over time is negligible, supporting the results and conclusions of O’Sullivan et al. (2001b).
Known AGN were removed from the sample before any statistical analysis was performed. However it is possible that some galaxies with a low level of nuclear activity remain in the sample. Galactic nuclear activity has been quantified using H emission line strength, as reported by Ho et al. (1997) after subtraction of the contribution from starlight. Broad H emission lines are a classic indication of a Seyfert or LINER (low-ionisation nuclear emission-line region) galaxy . Seyfert and LINER galaxies are generally spirals, but occasionally are found in ellipticals. The lack of correlation of either or log/ with H emission is suggestive that galactic nuclear activity is not very influential on the observed scatter of the : relation. This is corroborated by the similar range in values of and log/ displayed by the H emitting galaxies and the whole sample.
In conclusion, the origin of the large scatter in / remains elusive. It is clear that mass, age, metallicity and core-profile are all linked with the range in displayed by galaxies, with more massive and older galaxies having a wider range in and cuspy profiles. The underlying cause of these differences may well be linked with formation and merger history as well as the environment of the galaxies, but disentangling the effects is very problematic. Conversely it appears that star-formation and recent post-merger objects do not significantly contribute to the scatter, and thus studies of the optical-X-ray luminosity relations are a valid choice. Similarly the local density and environment of early-type galaxies do not appear to affect the scatter.
Acknowledgments
We extend our warmest thanks to Duncan Forbes for his helpful comments on an earlier draft of this paper, and to Trevor Ponman for his suggestions on this work. Many thanks, also, to Doug Burke for discussions and software help. We thank the referee for useful comments which have improved this paper.
This publication makes use of data products from the Two Micron All Sky Survey, which is a joint project of the University of Massachusetts and the Infrared Processing and Analysis Center/California Institute of Technology, funded by the National Aeronautics and Space Administration and the National Science Foundation.
This research has made use of the NASA/IPAC Extragalactic Database (NED) which is operated by the Jet Propulsion Laboratory, California Institute of Technology, under contract with the National Aeronautics and Space Administration.
This research has also made use of the HyperLeda archives available at http://leda.univ-lyon1.fr/.
SCE acknowledges PPARC support whilst researching this work. EO’S acknowledges support from NASA grant NNG04GF19G and Chandra Award Number AR4-5102X.
References
- Abell et al. (1989) Abell G. O., Corwin H. G., Olowin R. P., 1989, ApJS, 70, 1
- Baugh et al. (1996) Baugh C. M., Cole S., Frenk C. S., 1996, MNRAS, 283, 1361
- Bell et al. (2004) Bell E. F., Wolf C., Meisenheimer K., Rix H., Borch A., Dye S., Kleinheinrich M., Wisotzki L., McIntosh D. H., 2004, ApJ, 608, 752
- Bender et al. (1989) Bender R., Surma P., Doebereiner S., Moellenhoff C., Madejsky R., 1989, A&A, 217, 35
- Beuing et al. (1999) Beuing J., Dobereiner S., Böhringer H., Bender R., 1999, MNRAS, 302, 209
- Bhavsar & Barrow (1985) Bhavsar S. P., Barrow J. D., 1985, MNRAS, p. 857
- Brighenti & Mathews (1996) Brighenti F., Mathews W. G., 1996, ApJ, 470, 747
- Brown & Bregman (2000) Brown B. A., Bregman J. N., 2000, ApJ, 539, 592
- Bruzual & Charlot (2003) Bruzual G., Charlot S., 2003, MNRAS, 344, 1000
- Burkert & Naab (2003) Burkert A., Naab T., 2003, Lecture Notes in Physics, Berlin Springer Verlag, 626, 327
- Butcher & Oemler (1984) Butcher H., Oemler A., 1984, ApJ, 285, 426
- Casuso et al. (1996) Casuso E., Vazdekis A., Peletier R. F., Beckman J. E., 1996, ApJ, 458, 533
- Ciotti et al. (1991) Ciotti L., Pellegrini S., Renzini A., D’Ercole A., 1991, ApJ, 376, 380
- Colina & Bohlin (1997) Colina L., Bohlin R., 1997, AJ, 113, 1138
- Cox (2000) Cox A. N., 2000, Allen’s astrophysical quantities. Allen’s astrophysical quantities, 4th ed. Publisher: New York: AIP Press; Springer, 2000. Editedy by Arthur N. Cox. ISBN: 0387987460
- De Propris et al. (1999) De Propris R., Stanford S. A., Eisenhardt P. A., Dickinson M., Elston R., 1999, AJ, 118, 719
- Denicoló et al. (2005) Denicoló G., Terlevich R., Terlevich E., Forbes D. A., Terlevich A., 2005, MNRAS, 358, 813
- D’Ercole & Ciotti (1998) D’Ercole A., Ciotti L., 1998, ApJ, 494, 535
- Dressler et al. (1997) Dressler A., Oemler A. J., Couch W. J., Smail I., Ellis R. S., Barger A., Butcher H., Poggianti B. M., Sharples R. M., 1997, apj, 490, 577
- Drory et al. (2003) Drory N., Bender R., Feulner G., Hopp U., Maraston C., Snigula J., 2003, ApJ, 595, 698
- Ellis & Jones (2004) Ellis S. C., Jones L. R., 2004, MNRAS, 348, 165
- Eskridge et al. (1995a) Eskridge P. B., Fabbiano G., Kim D., 1995a, ApJS, 97, 141
- Eskridge et al. (1995b) Eskridge P. B., Fabbiano G., Kim D., 1995b, ApJ, 442, 523
- Eskridge et al. (1995c) Eskridge P. B., Fabbiano G., Kim D., 1995c, ApJ, 448, 70
- Fabbiano (1989) Fabbiano G., 1989, ARA&A, 27, 87
- Fabbiano et al. (1992) Fabbiano G., Kim D.-W., Trinchieri G., 1992, ApJS, 80, 531
- Fabbiano & Trinchieri (1984) Fabbiano G., Trinchieri G., 1984, ApJ, 286, 491
- Faber et al. (1997) Faber S. M., Tremaine S., Ajhar E. A., Byun Y., Dressler A., Gebhardt K., Grillmair C., Kormendy J., Lauer T. R., Richstone D., 1997, AJ, 114, 1771
- Faber et al. (1989) Faber S. M., Wegner G., Burstein D., Davies R. L., Dressler A., Lynden-Bell D., Terlevich R. J., 1989, ApJS, 69, 763
- Feigelson & Nelson (1985) Feigelson E. D., Nelson P. I., 1985, ApJ, 293, 192
- Forman et al. (1985) Forman W., Jones C., Tucker W., 1985, ApJ, 293, 102
- Fujita (2001) Fujita Y., 2001, ApJ, 550, 612
- Garcia (1993) Garcia A. M., 1993, A&AS, 100, 47
- Gavazzi et al. (1996) Gavazzi G., Pierini D., Boselli A., 1996, A&A, 312, 397
- Helsdon et al. (2001) Helsdon S. F., Ponman T. J., O’Sullivan E., Forbes D. A., 2001, MNRAS, 325, 693
- Henriksen & Cousineau (1999) Henriksen M., Cousineau S., 1999, ApJ, 511, 595
- Ho et al. (2001) Ho L. C., Feigelson E. D., Townsley L. K., Sambruna R. M., Garmire G. P., Brandt W. N., Filippenko A. V., Griffiths R. E., Ptak A. F., Sargent W. L. W., 2001, ApJ, 549, L51
- Ho et al. (1997) Ho L. C., Filippenko A. V., Sargent W. L. W., 1997, ApJS, 112, 315
- Holden et al. (2004) Holden B. P., Stanford S. A., Eisenhardt P., Dickinson M., 2004, AJ, 127, 2484
- Jarrett et al. (2003) Jarrett T. H., Chester T., Cutri R., Schneider S., Huchra J. P., 2003, AJ, 125, 525
- Jarrett et al. (2000) Jarrett T. H., Chester T., Cutri R., Schneider S., Skrutsie M., Huchra J. P., 2000, AJ, 119, 2498
- Kaastra & Mewe (1993) Kaastra J. S., Mewe R., 1993, A&AS, 97, 443
- Kaplan & Meier (1958) Kaplan E. L., Meier P., 1958, J. Am. Statistical Association, 53, 457
- Khochfar & Burkert (2003) Khochfar S., Burkert A., 2003, ApJ, 597, L117
- Khosroshahi et al. (2004) Khosroshahi H. G., Jones L. R., Ponman T. J., 2004, MNRAS, 349, 1240
- Kley & Mathews (1995) Kley W., Mathews W. G., 1995, ApJ, 438, 100
- Kodama et al. (1998) Kodama T., Arimoto N., Barger A. J., Aragón-Salamanca 1998, A&A, 334, 99
- Kron (1980) Kron R., 1980, ApJS, p. 305
- Kuntschner (2000) Kuntschner H., 2000, MNRAS, 315, 184
- Lavalley et al. (1992) Lavalley M., Isobe T., Feigelson E., 1992, in Astronomical Society of the Pacific Conference Series ASURV: Astronomy Survival Analysis Package. p. 245
- Liedahl et al. (1995) Liedahl D. A., Osterheld A. L., Goldstein W. H., 1995, ApJ, 438, L115
- Mathews & Brighenti (1998) Mathews W. G., Brighenti F., 1998, ApJ, 493, L9
- Mathews & Brighenti (2003) Mathews W. G., Brighenti F., 2003, ARA&A, 41, 191
- Matsushita (2001) Matsushita K., 2001, ApJ, 547, 693
- Michard (1998) Michard R., 1998, A&A, 335, 49
- Nulsen et al. (1984) Nulsen P. E. J., Stewart G. C., Fabian A. C., 1984, MNRAS, 208, 185
- O’Sullivan et al. (2001a) O’Sullivan E., Forbes D. A., Ponman T. J., 2001a, MNRAS, 328, 461
- O’Sullivan et al. (2001b) O’Sullivan E., Forbes D. A., Ponman T. J., 2001b, MNRAS, 324, 420
- Pellegrini (1999) Pellegrini S., 1999, A&A, 351, 487
- Pellegrini et al. (1997) Pellegrini S., Held E. V., Ciotti L., 1997, MNRAS, 288, 1
- Pipino et al. (2005) Pipino A., Kawata D., Gibson B. K., Matteucci F., 2005, A&A, in press, astro
- Prugniel & Simien (1996) Prugniel P., Simien F., 1996, A&A, 309, 749
- Ravindranath et al. (2002) Ravindranath S., Ho L. C., Filippenko A. V., 2002, ApJ, 566, 801
- Reda et al. (2004) Reda F. M., Forbes D. M., Beasley M. A., O’Sullivan E. J., Goudfrooij P., 2004, MNRAS, 354, 851
- Rest et al. (2001) Rest A., van den Bosch F. C., Jaffe W., Tran H., Tsvetanov Z., Ford H. C., Davies J., Schafer J., 2001, AJ, 121, 2431
- Roberts et al. (1991) Roberts M. S., Hogg D. E., Bregman J. E., Forman W. R., Jones C., 1991, ApJS, 75, 751
- Ryden et al. (2001) Ryden B. S., Forbes D. A., Terlevich A. I., 2001, MNRAS, 326, 1141
- Schlegel et al. (1998) Schlegel D. J., Finkbeiner D. P., Davis M., 1998, ApJ, 500, 525
- Stanford et al. (1998) Stanford S. A., Eisenhardt P. R., Dickinson M., 1998, ApJ, 492, 461
- Stark et al. (1992) Stark A. A., Gammie C. F., Wilson R. W., Bally J., Linke R. A., Heiles C., Hurwitz M., 1992, ApJS, 79, 77
- Sun & Vikhlinin (2005) Sun M., Vikhlinin A., 2005, ApJ, 621, 718
- Terlevich & Forbes (2002) Terlevich A. I., Forbes D. A., 2002, MNRAS, 330, 547
- Toft et al. (2003) Toft S., Soucail G., Hjorth J., 2003, MNRAS, 344, 337
- Toniazzo & Schindler (2001) Toniazzo T., Schindler S., 2001, MNRAS, 325, 509
- Trager (1997) Trager S. C., 1997, Ph.D. Thesis
- Tran et al. (2001) Tran H. D., Tsvetanov Z., Ford H. C., Davies J., Jaffe W., van den Bosch F. C., Rest A., 2001, AJ, 121, 2928
- Tsai & Mathews (1995) Tsai J. C., Mathews W. G., 1995, ApJ, 448, 84
- Tully (1988) Tully R. B., 1988, Nearby galaxies catalog. Cambridge and New York, Cambridge University Press, 1988, 221 p.
- van de Ven et al. (2003) van de Ven G., van Dokkum P. G., Franx M., 2003, MNRAS, 344, 924
- van der Marel (1999) van der Marel R. P., 1999, AJ, 117, 744
- Véron-Cetty & Véron (2001) Véron-Cetty M.-P., Véron P., 2001, A&A, 374, 92
- White & Sarazin (1991) White R. E., Sarazin C. L., 1991, ApJ, 367, 476
- Zepf & Whitmore (1993) Zepf S. E., Whitmore B. C., 1993, ApJ, 418, 72
Appendix A The catalogue
We provide a catalogue of the data used in this paper for the convenience of the reader. The catalogue is also available online at http://hea-www.harvard.edu/ejos/catalogue.html. We emphasise that none of the data presented in this table are new, but are compilations of data from the literature; references for each source are given as footnotes in the table. Where data in the main part of the paper were from a single source (e.g. age) we have excluded these from the table.
| Name | Distancea | logb | logc | logc | logd | Env.1e | Env.2f | Mg2g | 100.a4/ah | H | H | |
|---|---|---|---|---|---|---|---|---|---|---|---|---|
| Mpc | erg s-1 | |||||||||||
| ESO101-14 | 30.12 | 9.93∗ | 10.84 | 10.74 | 41.02 | F | - | - | - | - | - | - |
| ESO107-4 | 38.89 | 10.22 | 10.88 | 10.77 | 40.94 | F | - | 0.249 | - | - | - | - |
| ESO137-6 | 69.75 | 10.56 | 11.74 | 11.62 | 42.08 | G | G | 0.307 | - | - | - | - |
| ESO137-8 | 47.95 | 10.42∗ | 11.42 | 11.32 | 41.22 | G | - | 0.305 | - | - | - | - |
| ESO137-10 | 42.27 | 10.46∗ | 11.21 | 11.12 | 40.94 | G | G | 0.292 | - | - | - | - |
| ESO138-5 | 35.39 | 10.16∗ | 11.11 | 11.03 | 41.18 | G | - | - | - | - | - | - |
| ESO148-17 | 38.36 | 10.04 | 10.72 | 10.63 | 40.68 | F | - | - | - | - | - | - |
| ESO183-30 | 33.59 | 10.18 | 11.07 | 10.99 | 41.00 | G | - | 0.250 | - | - | - | - |
| ESO185-54 | 56.36 | 10.84∗ | 11.68 | 11.58 | 41.36 | G | G | 0.332 | - | - | - | - |
| ESO208-21 | 10.36 | 9.34 | 10.23 | 10.13 | 39.73 | F | - | 0.322 | - | - | - | - |
| ESO243-45 | 100.91 | 10.84∗ | 11.47 | 11.39 | 41.91 | D | - | - | - | - | - | - |
| ESO273-2 | 3.20 | 7.54 | 8.37 | 8.26 | 38.64 | F | D | - | - | - | - | - |
| ESO286-50 | 33.31 | 9.76 | 10.34 | 10.24 | 40.53 | F | - | - | - | - | - | - |
| ESO306-17 | 139.95 | 11.15∗ | 11.83 | 11.69 | 43.33 | D | - | - | - | - | - | - |
| ESO381-29 | 32.65 | 9.78 | 10.48 | 10.39 | 40.59 | F | - | 0.180 | - | - | - | - |
| ESO400-30 | 30.17 | 9.76 | 9.80 | 9.70 | 40.45 | F | - | 0.132 | - | - | - | - |
| ESO428-11 | 10.49 | 9.07 | 9.93 | 9.83 | 39.63 | F | - | - | - | - | - | - |
| ESO443-24 | 65.97 | 10.67 | 11.58 | 11.48 | 41.50 | G | G | 0.307 | - | - | - | - |
| ESO495-21 | 9.16 | 9.13∗ | 9.67 | 9.57 | 39.56 | F | - | - | - | - | - | - |
| ESO507-21 | 40.23 | 10.51∗ | 10.84 | 10.73 | 40.93 | G | - | 0.326 | - | - | - | - |
| ESO552-20 | 123.49 | 11.04∗ | 11.84 | 11.71 | 42.59 | D | - | 0.367 | - | - | - | - |
| ESO553-2 | 61.88 | 10.42 | 11.16 | 11.07 | 41.50 | F | - | 0.310 | - | - | - | - |
| ESO565-30 | 132.99 | 11.05∗ | 11.71 | 11.61 | 42.37 | D | - | 0.321 | - | - | - | - |
| IC310 | 63.39 | 10.54 | 11.29 | 11.17 | 42.54 | G | A | 0.272 | - | - | - | - |
| IC989 | 101.33 | 10.60 | 11.52 | 11.30 | 41.55 | D | C | - | - | - | - | - |
| IC1024 | 21.68 | 9.31∗ | 9.99 | 9.86 | 40.20 | G | - | - | - | - | - | - |
| IC1459 | 18.88 | 10.37 | 11.18 | 11.08 | 40.71 | G | G | 0.335 | - | - | - | - |
| IC1531 | 100.69 | 10.87∗ | 11.53 | 11.40 | 41.60 | D | - | - | - | - | - | - |
| IC1625 | 86.20 | 10.90 | 11.50 | 11.41 | 41.75 | D | C | 0.313 | - | - | - | - |
| IC1633 | 93.81 | 11.09 | 11.93 | 11.83 | 42.79 | D | - | 0.327 | - | - | - | - |
| IC1729 | 18.09 | 9.29 | 10.00 | 9.92 | 40.00 | F | - | - | - | - | - | - |
| IC1860 | 90.15 | 10.62 | 11.56 | 11.42 | 42.71 | D | - | - | - | - | - | - |
| IC2006 | 18.11 | 9.88 | 10.47 | 10.37 | 41.03 | C | - | 0.296 | - | - | 1.44 | -6.32 |
| IC2035 | 16.52 | 9.64 | 10.24 | 10.13 | 40.62 | F | - | 0.179 | - | - | - | - |
| IC2311 | 22.11 | 9.88 | 10.69 | 10.60 | 40.22 | F | - | 0.262 | - | - | - | - |
| IC2533 | 31.45 | 10.00 | 10.85 | 10.77 | 40.44 | F | - | - | - | - | - | - |
| IC2552 | 38.37 | 10.00∗ | 10.93 | 10.81 | 40.69 | G | - | - | - | - | - | - |
| IC2597 | 58.34 | 10.58 | 11.47 | 11.37 | 41.03 | C | - | 0.318 | - | - | - | - |
| IC3896 | 25.29 | 9.97∗ | 11.04 | 10.95 | 40.50 | F | - | 0.320 | - | - | - | - |
| IC3986 | 59.49 | 10.41∗ | 11.36 | 11.26 | 40.30 | G | - | 0.309 | - | - | - | - |
| IC4197 | 38.63 | 9.95 | 10.81 | 10.71 | 40.73 | G | - | 0.28 | - | - | - | - |
| IC4296 | 47.56 | 10.90 | 11.70 | 11.56 | 41.53 | G | G | 0.339 | - | - | - | - |
| IC4329 | 58.83 | 10.86∗ | 11.67 | 11.55 | 41.82 | G | G | 0.338 | 0.80 | - | - | - |
| IC4765 | 58.20 | 10.79∗ | 11.61 | 11.48 | 41.83 | G | G | 0.338 | - | - | - | - |
| IC4797 | 33.31 | 10.31 | 11.17 | 11.07 | 40.99 | G | G | 0.302 | - | - | - | - |
| IC4889 | 29.51 | 10.42 | 11.04 | 10.96 | 40.80 | F | - | 0.258 | 1.00 | - | - | - |
| IC4943 | 34.67 | 9.90 | 10.50 | 10.45 | 40.64 | G | - | 0.251 | - | - | - | - |
| IC5181 | 24.63 | 9.97 | 10.86 | 10.77 | 40.28 | G | - | - | - | - | - | - |
| IC5269 | 24.52 | 9.69∗ | 10.35 | 10.26 | 40.46 | G | - | - | - | - | - | - |
| IC5358 | 113.09 | 10.86 | 11.62 | 11.54 | 43.58 | D | - | 0.321 | - | - | - | - |
| NGC57 | 55.21 | 10.61 | 11.36 | 11.25 | 41.65 | F | - | - | - | - | - | - |
| NGC127 | 48.53 | 9.43 | 10.26 | 10.13 | 41.16 | G | - | - | - | - | - | - |
| NGC130 | 48.53 | 9.60 | 10.17 | 10.08 | 41.18 | G | - | - | - | - | - | - |
| NGC147 | 0.65 | 7.92 | 8.09 | 8.04 | 37.45 | G | D | - | - | - | - | - |
| NGC185 | 0.62 | 8.07 | 8.31 | 8.26 | 37.36 | G | D | 0.0950 | - | - | - | - |
| NGC205 | 0.72 | 8.40 | 8.83 | 8.72 | 37.61 | G | D | 0.0860 | - | - | 4.18 | - |
| NGC221 | 0.72 | 8.36 | 9.02 | 8.92 | 37.77 | G | D | 0.198 | 0.00 | 0.50 | 2.42 | -3.97 |
| NGC227 | 71.01 | 10.65 | 11.41 | 11.30 | 41.23 | D | - | 0.302 | - | - | 1.56 | - |
| NGC315 | 58.88 | 11.07 | 11.71 | 11.61 | 41.58 | G | G | 0.299 | -0.31 | - | 2.01 | -5.48 |
| NGC383 | 56.49 | 10.86 | 11.46 | 11.35 | 41.38 | G | - | 0.307 | - | - | 0.66 | - |
| NGC410 | 56.75 | 10.82 | 11.50 | 11.40 | 41.91 | G | - | 0.345 | - | - | - | - |
| NGC439 | 74.60 | 10.94∗ | 11.62 | 11.50 | 41.71 | D | - | 0.302 | - | - | - | - |
| NGC499 | 55.21 | 10.57 | 11.34 | 11.23 | 42.29 | G | G | 0.329 | - | - | 1.17 | - |
| NGC507 | 67.19 | 10.96 | 11.68 | 11.53 | 42.70 | G | G | 0.298 | - | - | - | - |
| NGC529 | 65.96 | 10.57 | 11.34 | 11.27 | 40.60 | G | - | 0.298 | - | - | 1.44 | - |
| NGC533 | 63.68 | 10.90 | 11.58 | 11.47 | 42.23 | G | G | 0.307 | 0.00 | - | 1.27 | - |
| NGC541 | 63.39 | 10.66 | 11.23 | 11.13 | 40.84 | G | - | 0.316 | - | - | 0.67 | - |
| NGC547 | 63.39 | 10.92 | 11.56 | 11.45 | 40.70 | G | - | 0.321 | - | - | - | - |
| NGC568 | 73.24 | 10.49 | 11.25 | 11.16 | 41.49 | D | - | 0.293 | - | - | - | - |
| NGC584 | 22.18 | 10.36 | 11.12 | 11.05 | 40.09 | G | G | 0.292 | 1.50 | - | 1.90 | -6.04 |
| NGC596 | 22.28 | 10.21 | 10.85 | 10.77 | 39.60 | G | - | 0.262 | 1.30 | 0.55 | 1.62 | - |
| NGC636 | 22.28 | 10.00 | 10.67 | 10.58 | 40.11 | G | - | 0.284 | 0.80 | - | 1.94 | - |
| NGC708 | 55.21 | 10.74 | 11.40 | 11.36 | 43.03 | C | C | 0.329 | - | - | - | - |
| NGC720 | 20.80 | 10.38 | 11.08 | 10.98 | 40.61 | G | G | 0.343 | 0.35 | 0.06 | 1.74 | -6.40 |
| NGC741 | 61.09 | 10.90 | 11.60 | 11.51 | 41.73 | G | G | 0.326 | - | - | 1.53 | - |
| NGC777 | 55.21 | 10.68 | 11.49 | 11.37 | 42.08 | G | G | 0.335 | -0.30 | - | 1.89 | - |
| NGC821 | 20.99 | 10.16 | 10.83 | 10.74 | 40.33 | F | - | 0.315 | 2.50 | 0.64 | 1.81 | -6.20 |
| NGC855 | 9.33 | 8.89 | 9.35 | 9.26 | 39.77 | F | D | 0.0675 | - | - | - | - |
| NGC1016 | 73.79 | 10.95 | 11.65 | 11.55 | 41.28 | D | C | 0.324 | - | - | 1.28 | - |
| NGC1052 | 17.70 | 10.12 | 10.86 | 10.77 | 40.31 | G | - | 0.325 | 0.00 | 0.18 | 1.85 | -5.72 |
| NGC1167 | 67.67 | 10.50∗ | 11.55 | 11.48 | 41.31 | G | - | - | - | - | - | - |
| NGC1172 | 28.71 | 10.10 | 10.58 | 10.51 | 40.59 | F | - | 0.248 | - | 1.01 | - | - |
| NGC1199 | 28.71 | 10.24 | 10.84 | 10.73 | 39.42 | G | G | 0.304 | - | - | 1.60 | - |
| NGC1201 | 20.67 | 10.16∗ | 10.91 | 10.83 | 40.26 | G | - | 0.305 | - | - | - | - |
| NGC1209 | 28.71 | 10.19 | 10.93 | 10.85 | 40.62 | G | - | 0.296 | - | - | 0.80 | - |
| NGC1316 | 18.11 | 10.93 | 11.63 | 11.52 | 40.87 | C | - | 0.265 | 1.00 | 0.00 | 2.20 | -4.18 |
| NGC1332 | 19.68 | 10.27 | 11.12 | 11.02 | 40.53 | G | - | 0.355 | - | - | 1.74 | - |
| NGC1336 | 18.11 | 9.46 | 9.94 | 9.82 | 40.29 | C | - | 0.211 | - | - | 1.64 | -4.82 |
| NGC1339 | 18.11 | 9.73 | 10.39 | 10.29 | 40.21 | C | - | 0.308 | - | - | 1.52 | -6.11 |
| NGC1344 | 18.11 | 10.30 | 10.90 | 10.82 | 39.48 | C | - | - | - | - | - | - |
| NGC1351 | 18.11 | 9.78 | 10.35 | 10.28 | 40.33 | C | - | 0.284 | - | - | 1.50 | -5.89 |
| NGC1366 | 18.11 | 9.56 | 10.26 | 10.18 | 40.32 | C | - | 0.267 | - | - | - | - |
| NGC1374 | 18.11 | 9.98 | 10.60 | 10.52 | 39.89 | C | - | 0.319 | - | - | 1.57 | -6.40 |
| NGC1375 | 18.11 | 9.58 | 10.02 | 9.91 | 38.60 | C | - | 0.148 | - | - | 2.85 | -1.24 |
| NGC1379 | 18.11 | 10.09 | 10.57 | 10.49 | 39.24 | C | - | 0.265 | - | - | 1.70 | -5.26 |
| NGC1380 | 18.11 | 10.46 | 11.12 | 11.02 | 40.09 | C | - | 0.301 | - | - | 1.37 | -6.43 |
| NGC1380A | 18.11 | 9.65 | 10.03 | 9.93 | 38.96 | C | - | 0.202 | - | - | 2.87 | -1.52 |
| NGC1381 | 18.11 | 9.79 | 10.49 | 10.41 | 39.07 | C | - | 0.250 | - | - | 1.70 | -5.99 |
| NGC1387 | 18.11 | 10.03 | 10.89 | 10.76 | 40.48 | C | - | - | - | - | - | - |
| NGC1389 | 18.11 | 9.71∗ | 10.41 | 10.32 | 40.08 | C | - | 0.236 | - | - | - | - |
| NGC1399 | 18.11 | 10.52 | 11.34 | 11.24 | 41.63 | C | C | 0.345 | 0.10 | 0.07 | 1.41 | -6.40 |
| NGC1395 | 20.51 | 10.44 | 11.21 | 11.11 | 40.89 | G | G | 0.325 | - | - | 1.50 | - |
| NGC1400 | 20.51 | 10.14 | 10.85 | 10.76 | 40.12 | G | G | 0.325 | 0.00 | 0.35 | 1.57 | - |
| NGC1404 | 18.11 | 10.35 | 11.14 | 11.03 | 41.19 | C | - | 0.330 | - | - | 1.58 | -6.29 |
| NGC1407 | 20.61 | 10.58 | 11.30 | 11.18 | 41.00 | G | G | 0.340 | -0.30 | - | 1.96 | -6.55 |
| NGC1411 | 10.56 | 9.34 | 10.10 | 10.06 | 39.63 | G | - | 0.213 | - | - | - | - |
| NGC1419 | 18.11 | 9.34 | 9.91 | 9.84 | 40.37 | C | - | 0.235 | - | - | 1.62 | -5.08 |
| NGC1426 | 20.61 | 9.92 | 10.51 | 10.42 | 40.01 | G | - | 0.264 | 0.00 | 0.85 | 1.51 | - |
| NGC1439 | 20.61 | 10.00 | 10.55 | 10.46 | 40.00 | G | - | 0.276 | -0.10 | 0.83 | 1.13 | - |
| NGC1497 | 84.12 | 10.41∗ | 11.41 | 11.27 | 41.33 | D | C | - | - | - | - | - |
| NGC1510 | 10.01 | 8.80 | 9.21 | 9.29 | 39.76 | G | D | - | - | - | - | - |
| NGC1537 | 16.44 | 10.02 | 10.69 | 10.60 | 39.75 | G | - | 0.291 | - | - | 2.06 | - |
| NGC1549 | 14.45 | 10.28 | 10.95 | 10.84 | 39.92 | G | - | 0.313 | -0.40 | - | - | - |
| NGC1550 | 48.49 | 10.33 | 11.21 | 11.10 | 42.80 | G | G | - | - | - | - | - |
| NGC1553 | 14.45 | 10.63 | 11.16 | 11.08 | 40.52 | G | G | 0.274 | - | 0.74 | - | - |
| NGC1573 | 51.52 | 10.72 | 11.35 | 11.23 | 41.33 | G | G | 0.331 | - | - | 1.85 | - |
| NGC1574 | 14.45 | 10.01 | 10.82 | 10.72 | 40.32 | G | - | 0.287 | - | - | - | - |
| NGC1581 | 14.45 | 9.06 | 9.73 | 9.66 | 39.86 | G | - | - | - | - | - | - |
| NGC1587 | 44.87 | 10.51 | 11.25 | 11.13 | 40.64 | G | - | 0.324 | - | - | 1.29 | - |
| NGC1600 | 59.98 | 11.03 | 11.69 | 11.57 | 41.54 | F | - | 0.329 | -0.75 | 0.08 | 1.87 | -6.62 |
| NGC1705 | 4.87 | 8.44∗ | 8.51 | 8.42 | 38.81 | F | D | - | - | - | - | - |
| NGC1947 | 13.43 | 10.18 | 10.60 | 10.50 | 40.05 | F | - | 0.243 | - | - | - | - |
| NGC2089 | 38.07 | 10.18∗ | 10.98 | 10.91 | 40.56 | F | - | - | - | - | - | - |
| NGC2271 | 32.16 | 9.94∗ | 10.89 | 10.79 | 40.66 | F | - | 0.306 | - | - | - | - |
| NGC2272 | 0.72 | 6.81 | 7.58 | 7.50 | 37.36 | F | D | - | - | - | - | - |
| NGC2300 | 27.67 | 10.41 | 11.18 | 11.07 | 41.16 | G | - | 0.326 | 0.55 | - | 1.77 | -5.99 |
| NGC2305 | 45.92 | 10.60 | 11.29 | 11.21 | 41.67 | F | - | 0.310 | - | - | - | - |
| NGC2314 | 48.53 | 10.44 | 11.17 | 11.06 | 40.91 | F | - | 0.319 | - | - | 1.69 | - |
| NGC2325 | 29.79 | 10.60 | 11.14 | 11.05 | 40.70 | F | - | 0.306 | - | - | 1.65 | - |
| NGC2328 | 12.20 | 9.02 | 9.55 | 9.47 | 39.56 | F | - | - | - | - | - | - |
| NGC2329 | 71.12 | 10.73 | 11.29 | 11.20 | 42.12 | D | A | 0.269 | - | - | 0.97 | - |
| NGC2340 | 73.79 | 11.04 | 11.53 | 11.39 | 42.08 | D | C | 0.334 | - | - | 1.30 | - |
| NGC2380 | 21.11 | 9.93 | 11.02 | 10.89 | 40.20 | F | - | 0.291 | - | - | - | - |
| NGC2434 | 14.06 | 9.89 | 10.49 | 10.39 | 39.90 | G | - | 0.275 | - | - | - | - |
| NGC2444 | 50.82 | 9.92 | 10.70 | 10.61 | 41.29 | G | - | - | - | - | - | - |
| NGC2488 | 117.12 | 10.97 | 11.66 | 11.55 | 42.56 | D | C | - | - | - | - | - |
| NGC2502 | 11.07 | 9.00 | 10.29 | 10.18 | 39.36 | F | - | 0.281 | - | - | - | - |
| NGC2563 | 59.43 | 10.54 | 11.29 | 11.19 | 41.63 | G | G | 0.328 | - | - | 1.08 | - |
| NGC2577 | 28.68 | 9.74 | 10.64 | 10.54 | 40.19 | F | - | - | - | - | - | - |
| NGC2629 | 52.13 | 10.29 | 11.24 | 11.13 | 40.94 | G | - | 0.313 | - | - | 0.30 | - |
| NGC2634 | 33.49 | 10.07 | 10.69 | 10.61 | 40.46 | G | - | 0.294 | - | 0.81 | 1.32 | - |
| NGC2663 | 27.42 | 10.95 | 11.50 | 11.38 | 40.45 | F | - | 0.335 | - | - | - | - |
| NGC2693 | 62.81 | 10.74 | 11.50 | 11.38 | 41.29 | G | - | 0.332 | 1.00 | - | 1.15 | - |
| NGC2694 | 62.81 | 9.78 | 10.36 | 10.39 | 41.31 | G | - | - | - | - | - | - |
| NGC2695 | 27.42 | 9.97 | 10.68 | 10.60 | 40.39 | G | - | 0.319 | - | - | 1.05 | - |
| NGC2768 | 20.89 | 10.57 | 11.19 | 11.10 | 40.38 | G | G | 0.277 | - | - | 1.61 | -6.21 |
| NGC2778 | 29.24 | 9.80 | 10.47 | 10.40 | 40.33 | G | G | 0.317 | -0.15 | 0.94 | 1.24 | - |
| NGC2832 | 85.90 | 11.06 | 11.74 | 11.62 | 41.62 | D | G | 0.330 | -0.30 | 0.02 | 1.48 | - |
| NGC2865 | 36.48 | 10.48 | 11.09 | 10.99 | 40.49 | F | - | 0.203 | - | - | 3.02 | - |
| NGC2880 | 23.55 | 9.95 | 10.62 | 10.50 | 40.06 | G | - | - | - | - | - | - |
| NGC2887 | 35.01 | 10.17 | 11.23 | 11.11 | 40.69 | F | - | 0.266 | - | - | - | - |
| NGC2888 | 27.12 | 9.62 | 10.44 | 10.36 | 40.23 | F | - | 0.244 | - | - | - | - |
| NGC2904 | 29.35 | 9.75 | 10.60 | 10.49 | 40.37 | F | - | 0.319 | - | - | - | - |
| NGC2911 | 41.30 | 10.52 | 11.10 | 11.00 | 40.96 | G | G | - | - | - | 2.12 | -5.40 |
| NGC2974 | 28.31 | 10.50 | 11.75 | 11.51 | 40.58 | G | G | 0.305 | 0.50 | - | 1.41 | -4.42 |
| NGC2986 | 30.34 | 10.51 | 11.26 | 11.18 | 40.96 | F | - | 0.331 | - | 0.18 | 1.44 | - |
| NGC3065 | 30.03 | 9.74 | 10.71 | 10.62 | 41.01 | F | - | - | - | 0.79 | - | - |
| NGC3073 | 18.49 | 9.09 | 9.56 | 9.48 | 39.77 | G | - | - | - | - | - | - |
| NGC3078 | 33.42 | 10.48 | 11.24 | 11.14 | 40.72 | G | - | 0.342 | - | 0.95 | 1.80 | - |
| NGC3087 | 34.67 | 10.52 | 11.17 | 11.06 | 40.56 | G | - | 0.290 | - | - | 1.77 | - |
| NGC3091 | 50.82 | 10.75 | 11.52 | 11.43 | 41.63 | G | G | 0.327 | -0.50 | - | 1.43 | -6.77 |
| NGC3115 | 8.83 | 10.10 | 10.89 | 10.80 | 39.72 | F | - | 0.326 | - | 0.78 | 1.85 | -6.97 |
| NGC3136 | 19.11 | 10.07 | 11.06 | 10.94 | 40.26 | F | - | 0.289 | - | - | - | - |
| NGC3156 | 19.95 | 9.71 | 10.13 | 10.03 | 40.00 | G | - | 0.110 | - | - | 4.29 | 3.61 |
| NGC3158 | 86.30 | 10.96 | 11.70 | 11.58 | 41.71 | D | C | 0.329 | - | - | 2.63 | - |
| NGC3193 | 21.58 | 10.15 | 10.83 | 10.75 | 39.96 | G | - | 0.299 | 0.30 | 0.81 | 1.66 | -6.18 |
| NGC3224 | 38.55 | 10.16 | 10.98 | 10.89 | 40.65 | G | - | - | - | - | - | - |
| NGC3226 | 21.58 | 10.12 | 10.59 | 10.47 | 40.20 | G | - | 0.299 | - | - | 1.01 | -6.07 |
| NGC3250 | 37.67 | 10.71 | 11.42 | 11.32 | 40.65 | G | - | 0.326 | -0.20 | - | - | - |
| NGC3258 | 38.37 | 10.48 | 11.19 | 11.10 | 41.17 | G | - | 0.354 | 0.00 | - | - | - |
| NGC3268 | 38.37 | 10.48 | 11.25 | 11.17 | 40.53 | G | - | 0.334 | - | - | - | - |
| NGC3271 | 47.81 | 10.43∗ | 11.45 | 11.34 | 41.06 | G | G | - | - | - | - | - |
| NGC3311 | 58.34 | 10.76 | 11.64 | 11.53 | 42.19 | C | C | 0.313 | - | - | - | - |
| NGC3375 | 30.92 | 9.80 | 10.42 | 10.35 | 40.43 | F | - | 0.241 | - | - | 2.54 | - |
| NGC3377 | 10.00 | 9.72 | 10.37 | 10.30 | 39.60 | G | - | 0.273 | 1.05 | 1.12 | 1.96 | -5.33 |
| NGC3379 | 10.00 | 10.06 | 10.84 | 10.76 | 39.54 | G | - | 0.318 | 0.10 | 0.18 | 1.50 | -6.63 |
| NGC3384 | 10.00 | 9.85 | 10.65 | 10.55 | 39.52 | G | - | 0.296 | - | 0.64 | 1.81 | -6.92 |
| NGC3458 | 27.03 | 9.77∗ | 10.48 | 10.39 | 40.61 | G | - | - | - | - | - | - |
| NGC3516 | 38.37 | 10.36 | 11.11 | 10.95 | 43.11 | G | A | - | - | - | - | - |
| NGC3557 | 32.21 | 10.76 | 10.890 | 10.890 | 40.58 | G | G | 0.317 | 0.00 | - | - | - |
| NGC3585 | 16.07 | 10.39 | 11.08 | 10.99 | 39.79 | G | G | 0.320 | - | - | 1.56 | - |
| NGC3599 | 19.77 | 9.66 | 10.23 | 10.15 | 39.23 | G | G | 0.193 | - | 0.79 | 2.74 | -1.96 |
| NGC3605 | 19.77 | 9.47 | 10.06 | 9.98 | 39.08 | G | - | 0.230 | -0.80 | 0.67 | 2.03 | - |
| NGC3606 | 37.75 | 9.98∗ | 10.75 | 10.66 | 40.69 | F | - | 0.292 | - | - | - | - |
| NGC3607 | 19.77 | 10.46 | 11.14 | 11.03 | 40.54 | G | - | 0.313 | - | - | 1.92 | -6.13 |
| NGC3608 | 19.77 | 10.11 | 10.70 | 10.59 | 40.01 | G | - | 0.319 | -0.20 | 0.00 | 1.61 | -6.46 |
| NGC3610 | 27.29 | 10.40 | 11.06 | 10.96 | 39.83 | G | - | 0.269 | 2.50 | - | 2.33 | -4.85 |
| NGC3613 | 27.29 | 10.36 | 11.00 | 10.93 | 40.12 | G | G | 0.293 | 0.70 | 0.04 | 1.75 | -5.82 |
| NGC3617 | 27.39 | 9.59 | 10.31 | 10.23 | 40.40 | F | - | 0.205 | - | - | - | - |
| NGC3640 | 22.91 | 10.43 | 11.06 | 10.95 | 39.92 | G | G | 0.273 | -0.20 | 0.15 | 2.06 | -5.55 |
| NGC3658 | 30.76 | 9.92 | 10.67 | 10.57 | 39.77 | G | - | - | - | - | - | - |
| NGC3665 | 30.76 | 10.70 | 11.25 | 11.16 | 40.60 | G | G | 0.287 | - | - | 2.18 | -4.87 |
| NGC3706 | 37.21 | 10.38 | 11.33 | 11.22 | 41.19 | F | - | 0.315 | - | - | - | - |
| NGC3818 | 21.48 | 9.80 | 10.47 | 10.38 | 40.16 | F | - | 0.330 | 2.30 | - | 1.69 | - |
| NGC3842 | 82.04 | 10.92 | 11.54 | 11.43 | 41.80 | D | C | 0.327 | -0.30 | - | 1.40 | - |
| NGC3862 | 82.04 | 10.56 | 11.38 | 11.27 | 41.90 | D | A | 0.291 | - | - | 1.15 | - |
| NGC3894 | 46.37 | 10.47 | 11.26 | 11.16 | 41.19 | G | - | 0.330 | -0.70 | - | 0.25 | - |
| NGC3904 | 17.86 | 10.06 | 10.78 | 10.68 | 40.74 | G | - | 0.332 | - | - | 1.37 | - |
| NGC3923 | 17.86 | 10.52 | 11.25 | 11.15 | 40.66 | G | G | 0.324 | -0.40 | - | 1.92 | -6.86 |
| NGC3962 | 21.68 | 10.28 | 10.95 | 10.87 | 40.22 | F | - | 0.315 | 0.00 | - | 0.63 | - |
| NGC3990 | 12.16 | 8.99 | 9.70 | 9.62 | 38.60 | G | D | - | - | - | - | - |
| NGC3998 | 17.46 | 10.08 | 10.89 | 10.80 | 41.51 | G | A | 0.339 | - | - | - | - |
| NGC4024 | 20.84 | 9.77 | 10.49 | 10.43 | 40.04 | G | - | 0.265 | - | - | 1.09 | - |
| NGC4033 | 19.25 | 9.71 | 10.44 | 10.35 | 40.00 | G | - | 0.262 | - | - | 1.86 | - |
| NGC4036 | 21.73 | 10.24 | 11.00 | 10.91 | 40.03 | G | G | 0.296 | - | - | - | - |
| NGC4073 | 79.43 | 11.07 | 11.75 | 11.67 | 42.38 | D | G | 0.325 | - | - | 1.72 | - |
| NGC4105 | 22.85 | 10.25∗ | 11.06 | 10.93 | 40.42 | G | G | 0.312 | - | - | 0.47 | - |
| NGC4125 | 25.94 | 10.80 | 11.43 | 11.34 | 40.94 | G | G | 0.311 | 0.95 | - | 1.76 | -5.82 |
| NGC4168 | 33.73 | 10.40 | 11.03 | 10.93 | 40.56 | C | A | 0.266 | 0.37 | 0.14 | 1.26 | - |
| NGC4203 | 16.22 | 9.89 | 10.81 | 10.72 | 41.18 | G | A | 0.332 | - | - | - | - |
| NGC4233 | 31.48 | 10.02 | 10.83 | 10.73 | 39.22 | C | - | 0.310 | - | - | - | - |
| NGC4239 | 16.75 | 9.24 | 9.72 | 9.65 | 39.85 | C | - | 0.167 | - | 0.65 | 2.40 | - |
| NGC4251 | 16.22 | 10.02 | 10.68 | 10.57 | 39.65 | G | - | 0.245 | 2.80 | - | - | - |
| NGC4261 | 31.48 | 10.70 | 11.44 | 11.34 | 41.21 | C | - | 0.344 | -1.30 | 0.00 | 1.41 | -6.57 |
| NGC4262 | 15.92 | 9.65 | 10.41 | 10.32 | 39.82 | C | - | 0.325 | - | - | 1.35 | - |
| NGC4267 | 15.92 | 9.88 | 10.62 | 10.53 | 39.90 | C | - | - | - | - | - | - |
| NGC4278 | 16.22 | 10.24 | 10.89 | 10.81 | 40.36 | G | - | 0.306 | -1.00 | 0.02 | - | - |
| NGC4283 | 16.22 | 9.46 | 10.12 | 10.04 | 39.22 | G | - | 0.281 | - | - | 1.78 | - |
| NGC4291 | 24.55 | 10.00 | 10.76 | 10.67 | 40.89 | G | - | 0.318 | -0.40 | 0.02 | 1.30 | - |
| NGC4339 | 15.92 | 9.71 | 10.34 | 10.26 | 39.86 | C | - | 0.267 | - | - | 1.74 | - |
| NGC4350 | 15.92 | 9.85 | 10.63 | 10.55 | 39.77 | C | - | 0.349 | - | - | 1.66 | - |
| NGC4365 | 15.92 | 10.34 | 11.10 | 11.01 | 40.25 | C | - | 0.328 | -0.95 | 0.15 | 1.73 | -6.55 |
| NGC4374 | 15.92 | 10.57 | 11.26 | 11.17 | 40.83 | C | - | 0.316 | -0.40 | 0.31 | 1.84 | -6.05 |
| NGC4386 | 24.55 | 9.90 | 10.73 | 10.65 | 39.93 | G | - | - | - | - | - | - |
| NGC4387 | 15.92 | 9.47 | 10.09 | 10.02 | 39.71 | C | - | 0.252 | -0.75 | 0.72 | 1.61 | - |
| NGC4406 | 15.92 | 10.66 | 11.31 | 11.23 | 42.05 | C | C | 0.316 | -0.70 | 0.08 | 1.38 | - |
| NGC4417 | 15.92 | 9.77 | 10.48 | 10.39 | 40.68 | C | - | 0.257 | - | 0.71 | - | - |
| NGC4434 | 15.92 | 9.45 | 10.07 | 9.98 | 39.83 | C | - | 0.265 | 0.44 | 0.70 | 1.74 | - |
| NGC4435 | 15.92 | 10.01 | 10.83 | 10.89 | 40.13 | C | - | 0.241 | - | - | - | - |
| NGC4458 | 16.14 | 9.51 | 10.04 | 9.94 | 39.84 | C | - | 0.233 | 0.34 | 0.49 | 1.91 | - |
| NGC4467 | 15.92 | 8.59 | 9.56 | 9.23 | 39.29 | C | D | 0.270 | - | 0.98 | 1.59 | - |
| NGC4472 | 15.92 | 10.90 | 11.59 | 11.50 | 41.43 | C | C | 0.331 | -0.25 | 0.04 | 1.35 | - |
| NGC4473 | 16.14 | 10.15 | 10.90 | 10.81 | 40.14 | C | - | 0.310 | 0.90 | - | 1.30 | - |
| NGC4474 | 15.92 | 9.64 | 10.27 | 10.17 | 39.85 | C | - | 0.245 | - | 0.72 | - | - |
| NGC4476 | 15.92 | 9.43 | 9.97 | 9.87 | 40.27 | C | - | 0.164 | - | - | 2.35 | - |
| NGC4477 | 15.92 | 10.13 | 10.81 | 10.72 | 40.26 | C | - | - | - | - | - | - |
| NGC4478 | 15.92 | 9.79 | 10.41 | 10.33 | 40.41 | C | - | 0.262 | -0.75 | 0.43 | 1.75 | - |
| NGC4479 | 15.92 | 9.23 | 9.84 | 9.75 | 39.70 | C | - | 0.191 | - | - | - | - |
| NGC4486 | 15.92 | 10.85 | 11.43 | 11.33 | 42.95 | C | C | 0.304 | 0.00 | 0.25 | - | - |
| NGC4489 | 15.92 | 9.46 | 10.01 | 9.92 | 39.84 | C | - | 0.207 | -0.20 | - | 2.16 | - |
| NGC4494 | 21.28 | 10.62 | 11.20 | 11.11 | 40.10 | G | - | 0.287 | 0.30 | - | 1.77 | -5.99 |
| NGC4503 | 15.92 | 9.77 | 10.60 | 10.50 | 39.88 | C | - | - | - | 0.64 | - | - |
| NGC4515 | 15.92 | 9.24 | 9.80 | 9.73 | 39.80 | C | - | 0.204 | - | - | - | - |
| NGC4526 | 15.92 | 10.47 | 11.16 | 11.08 | 39.87 | G | - | 0.304 | - | - | 1.42 | - |
| NGC4550 | 15.92 | 9.72 | 10.28 | 10.21 | 39.78 | C | - | 0.182 | 1.67 | - | 2.24 | -3.78 |
| NGC4551 | 15.92 | 9.58 | 10.20 | 10.11 | 39.09 | C | - | 0.266 | -0.65 | 0.80 | 1.59 | - |
| NGC4552 | 15.92 | 10.29 | 11.06 | 10.98 | 40.71 | C | A | 0.337 | 0.01 | 0.00 | 1.08 | - |
| NGC4555 | 90.33 | 10.86∗ | 11.59 | 11.49 | 41.85 | D | - | - | - | - | - | - |
| NGC4564 | 15.92 | 9.86 | 10.58 | 10.52 | 39.85 | C | - | 0.332 | 1.00 | 0.05 | 1.65 | - |
| NGC4578 | 15.92 | 9.78 | 10.39 | 10.31 | 39.99 | C | - | 0.310 | - | - | 1.02 | - |
| NGC4581 | 15.92 | 9.26 | 9.91 | 9.81 | 39.96 | G | - | - | - | - | - | - |
| NGC4589 | 24.55 | 10.33 | 11.02 | 10.94 | 40.36 | G | G | 0.330 | 0.55 | 0.26 | 1.30 | - |
| NGC4621 | 15.92 | 10.32 | 11.05 | 10.97 | 40.02 | C | - | 0.336 | 1.50 | 0.50 | 1.60 | - |
| NGC4636 | 15.92 | 10.51 | 11.18 | 11.12 | 41.59 | G | G | 0.320 | -0.10 | 0.13 | 1.13 | - |
| NGC4638 | 15.92 | 9.80 | 10.47 | 10.37 | 39.59 | C | - | 0.272 | - | - | - | - |
| NGC4645 | 32.03 | 10.09∗ | 10.98 | 10.88 | 40.57 | G | G | 0.287 | - | - | - | - |
| NGC4648 | 24.55 | 9.87 | 10.59 | 10.49 | 39.89 | G | - | 0.329 | 0.00 | 0.92 | 1.38 | - |
| NGC4649 | 15.92 | 10.73 | 11.46 | 11.36 | 41.28 | C | - | 0.354 | -0.35 | 0.15 | 1.46 | - |
| NGC4660 | 15.92 | 9.74 | 10.47 | 10.38 | 39.39 | C | - | 0.306 | 2.70 | - | 1.07 | - |
| NGC4697 | 15.14 | 10.55 | 11.16 | 11.07 | 40.12 | G | G | 0.308 | 1.30 | 0.74 | 1.08 | - |
| NGC4696 | 37.01 | 10.99∗ | 11.63 | 11.54 | 43.23 | C | C | 0.292 | - | - | - | - |
| NGC4709 | 59.31 | 10.94 | 11.69 | 11.58 | 41.00 | G | G | 0.336 | -0.80 | - | - | - |
| NGC4733 | 15.92 | 9.51 | 10.14 | 10.06 | 39.73 | C | - | 0.196 | - | - | 2.46 | - |
| NGC4742 | 12.42 | 9.56 | 10.18 | 10.11 | 39.80 | G | - | 0.193 | 0.41 | 1.09 | 3.32 | - |
| NGC4751 | 23.97 | 9.76∗ | 10.81 | 10.70 | 40.31 | G | G | - | - | - | - | - |
| NGC4753 | 20.23 | 10.46 | 11.27 | 11.18 | 39.99 | G | G | - | - | - | - | - |
| NGC4754 | 15.92 | 10.00 | 10.79 | 10.70 | 39.73 | C | - | 0.344 | - | - | 1.59 | -6.92 |
| NGC4756 | 53.93 | 10.30 | 11.18 | 11.09 | 41.72 | G | - | - | - | - | - | - |
| NGC4760 | 63.39 | 11.02 | 11.53 | 11.43 | 41.58 | G | G | 0.305 | - | - | 1.28 | - |
| NGC4762 | 15.92 | 10.16 | 10.83 | 10.77 | 40.13 | C | - | 0.282 | - | - | 1.70 | - |
| NGC4767 | 37.39 | 10.33 | 11.20 | 11.10 | 40.71 | C | - | 0.295 | - | - | - | - |
| NGC4782 | 63.39 | 11.37 | 11.85 | 11.74 | 41.61 | F | - | 0.341 | - | - | 2.05 | - |
| NGC4839 | 87.90 | 10.90 | 11.56 | 11.51 | 40.45 | D | - | 0.307 | - | - | 1.25 | - |
| NGC4889 | 88.31 | 11.19 | 11.88 | 11.76 | 42.76 | D | C | - | 0.01 | 0.05 | 1.14 | - |
| NGC4915 | 43.85 | 10.28 | 11.12 | 11.03 | 40.87 | F | - | 0.294 | - | - | 1.55 | - |
| NGC4936 | 41.07 | 10.71∗ | 11.48 | 11.39 | 41.69 | G | G | 0.305 | - | - | - | - |
| NGC4946 | 38.53 | 9.98 | 10.96 | 10.86 | 40.79 | G | - | 0.310 | - | - | - | - |
| NGC4976 | 11.43 | 9.97 | 10.73 | 10.62 | 39.73 | G | - | 0.277 | 0.50 | - | - | - |
| NGC4993 | 37.49 | 10.01∗ | 10.81 | 10.70 | 40.71 | G | - | - | - | - | - | - |
| NGC5011 | 38.76 | 10.40 | 11.27 | 11.17 | 40.82 | G | - | 0.290 | - | - | - | - |
| NGC5018 | 30.20 | 10.57 | 11.21 | 11.10 | 40.53 | G | G | 0.214 | - | - | 2.30 | - |
| NGC5044 | 30.20 | 10.70 | 11.22 | 11.12 | 42.74 | G | G | 0.329 | - | - | 0.06 | - |
| NGC5061 | 18.28 | 10.28 | 10.85 | 10.73 | 39.68 | G | G | 0.259 | - | - | 2.65 | - |
| NGC5077 | 30.20 | 10.26 | 11.02 | 10.91 | 40.48 | G | G | 0.307 | -0.90 | 0.23 | 0.84 | - |
| NGC5084 | 16.90 | 10.18 | 10.98 | 10.91 | 40.49 | G | G | 0.314 | - | - | 0.64 | - |
| NGC5087 | 18.71 | 10.03 | 10.77 | 10.68 | 40.36 | G | - | 0.328 | - | - | - | - |
| NGC5090 | 42.23 | 10.41 | 11.57 | 11.49 | 41.49 | G | A | 0.319 | - | - | - | - |
| NGC5102 | 4.16 | 9.29 | 9.82 | 9.78 | 38.03 | F | - | 0.0502 | - | - | 4.73 | - |
| NGC5128 | 3.89 | 10.45 | 10.95 | 10.82 | 40.10 | G | G | - | - | - | - | - |
| NGC5129 | 91.20 | 10.91 | 11.57 | 11.49 | 42.14 | D | G | 0.296 | - | - | 1.37 | - |
| NGC5153 | 55.65 | 10.55 | 11.18 | 11.09 | 40.50 | G | - | 0.296 | - | - | - | - |
| NGC5173 | 34.99 | 10.04 | 10.42 | 10.34 | 40.36 | G | - | - | - | - | - | - |
| NGC5193 | 47.41 | 10.55 | 11.23 | 11.14 | 40.58 | G | - | 0.302 | - | - | - | - |
| NGC5198 | 34.99 | 10.28 | 10.88 | 10.79 | 40.38 | G | G | 0.322 | - | 0.88 | 1.64 | - |
| NGC5216 | 42.33 | 10.02∗ | 10.65 | 10.55 | 40.85 | G | - | 0.265 | - | - | 0.73 | - |
| NGC5273 | 17.09 | 9.68 | 10.35 | 10.28 | 39.86 | F | A | - | - | 0.37 | - | - |
| NGC5306 | 96.41 | 10.91 | 11.73 | 11.62 | 41.50 | D | C | - | - | - | - | - |
| NGC5308 | 27.80 | 10.20 | 10.89 | 10.81 | 40.01 | G | G | - | - | 0.82 | - | - |
| NGC5322 | 27.80 | 10.67 | 11.37 | 11.30 | 40.21 | G | - | 0.292 | -0.90 | - | 2.08 | -6.15 |
| NGC5328 | 61.40 | 10.70 | 11.53 | 11.42 | 41.88 | G | - | 0.310 | - | - | 1.73 | - |
| NGC5353 | 34.67 | 10.56 | 11.38 | 11.34 | 41.00 | G | - | 0.324 | - | - | 1.68 | -7.08 |
| NGC5382 | 58.19 | 10.32 | 11.00 | 10.94 | 40.14 | G | - | - | - | - | - | - |
| NGC5419 | 53.44 | 10.88 | 11.80 | 11.68 | 41.80 | G | G | 0.339 | - | - | - | - |
| NGC5473 | 28.18 | 10.21 | 10.90 | 10.80 | 40.09 | G | - | - | - | - | - | - |
| NGC5485 | 28.18 | 10.25 | 10.89 | 10.80 | 40.12 | G | G | 0.300 | - | - | 1.94 | - |
| NGC5507 | 25.85 | 9.63 | 10.53 | 10.44 | 39.75 | G | - | - | - | - | - | - |
| NGC5546 | 98.53 | 10.86 | 11.60 | 11.51 | 42.02 | D | C | - | - | - | - | - |
| NGC5574 | 21.68 | 9.57 | 10.20 | 10.11 | 40.14 | G | - | - | - | - | - | - |
| NGC5576 | 21.68 | 10.16 | 10.89 | 10.84 | 40.14 | G | - | 0.262 | -0.50 | 0.36 | 2.00 | -5.57 |
| NGC5582 | 18.40 | 9.73 | 10.30 | 10.21 | 39.82 | F | - | 0.294 | - | - | 1.41 | - |
| NGC5638 | 21.68 | 10.09 | 10.72 | 10.62 | 40.20 | G | - | 0.322 | 0.20 | - | 1.61 | -6.86 |
| NGC5687 | 31.49 | 10.15 | 10.76 | 10.69 | 40.14 | F | - | 0.293 | - | - | 1.86 | - |
| NGC5812 | 24.55 | 10.19 | 10.94 | 10.85 | 40.32 | F | - | 0.326 | 0.00 | 0.59 | 1.63 | -6.97 |
| NGC5831 | 22.91 | 10.03 | 10.69 | 10.60 | 40.25 | G | - | 0.297 | 0.50 | 0.33 | 1.47 | -5.63 |
| NGC5838 | 22.91 | 10.20 | 11.04 | 10.96 | 40.02 | G | - | - | - | 0.93 | - | - |
| NGC5845 | 22.91 | 9.56 | 10.42 | 10.33 | 39.94 | G | - | 0.315 | 0.72 | 0.51 | 1.93 | -6.05 |
| NGC5846 | 22.91 | 10.66 | 11.29 | 11.20 | 41.65 | G | G | 0.328 | - | - | 1.52 | -7.03 |
| NGC5898 | 23.88 | 10.22 | 10.88 | 10.78 | 40.31 | G | - | 0.313 | - | 0.41 | - | - |
| NGC5903 | 23.88 | 10.28 | 10.86 | 10.77 | 40.33 | G | G | 0.288 | -0.70 | 0.00 | - | - |
| NGC5982 | 37.50 | 10.53 | 11.24 | 11.16 | 41.16 | G | - | 0.293 | -0.80 | 0.11 | 1.47 | -5.86 |
| NGC6034 | 137.28 | 10.63 | 11.44 | 11.33 | 42.19 | D | A | - | - | - | - | - |
| NGC6127 | 65.01 | 10.61 | 11.32 | 11.22 | 41.40 | F | - | 0.314 | - | - | 1.31 | - |
| NGC6137 | 112.72 | 11.13 | 11.63 | 11.53 | 42.14 | D | - | 0.289 | - | - | 0.61 | - |
| NGC6146 | 107.65 | 10.92 | 11.62 | 11.52 | 41.90 | D | - | 0.280 | - | - | - | - |
| NGC6160 | 127.65 | 10.72∗ | 11.65 | 11.56 | 42.45 | D | - | 0.302 | - | - | 1.66 | - |
| NGC6173 | 107.65 | 11.09 | 11.67 | 11.57 | 42.15 | D | C | 0.314 | - | - | - | - |
| NGC6269 | 139.68 | 11.15 | 11.88 | 11.76 | 42.86 | D | C | 0.339 | - | - | - | - |
| NGC6305 | 33.72 | 9.95 | 10.85 | 10.75 | 40.94 | F | - | 0.251 | - | - | - | - |
| NGC6407 | 58.67 | 10.58∗ | 11.42 | 11.35 | 41.94 | G | G | 0.313 | - | - | - | - |
| NGC6482 | 54.69 | 10.72 | 11.48 | 11.38 | 42.08 | F | - | 0.328 | 2.50 | - | 0.44 | - |
| NGC6487 | 105.39 | 11.07 | 11.69 | 11.58 | 41.70 | D | C | - | - | - | - | - |
| NGC6673 | 12.29 | 9.34 | 10.24 | 10.15 | 40.06 | F | - | 0.257 | - | - | - | - |
| NGC6684 | 8.47 | 9.73 | 10.38 | 10.35 | 38.93 | F | - | 0.246 | - | - | - | - |
| NGC6703 | 29.92 | 10.37 | 11.00 | 10.90 | 40.03 | F | - | 0.285 | 0.00 | - | 1.72 | - |
| NGC6776 | 70.41 | 10.66 | 11.43 | 11.29 | 40.79 | D | - | 0.243 | - | - | - | - |
| NGC6841 | 0.15 | 5.01 | 6.14 | 6.03 | 36.06 | F | D | - | - | - | - | - |
| NGC6851 | 34.67 | 10.30 | 10.92 | 10.83 | 40.64 | G | - | 0.270 | - | - | - | - |
| NGC6861 | 34.67 | 10.42 | 11.34 | 11.24 | 40.65 | G | - | - | - | - | - | - |
| NGC6868 | 34.67 | 10.58∗ | 11.50 | 11.41 | 41.23 | G | G | 0.331 | 0.50 | - | - | - |
| NGC6876 | 48.56 | 10.83∗ | 11.64 | 11.54 | 41.51 | G | G | 0.290 | 0.60 | - | - | - |
| NGC6909 | 34.67 | 10.27 | 10.74 | 10.68 | 40.78 | F | - | 0.213 | -0.90 | - | - | - |
| NGC6920 | 34.13 | 9.83 | 11.07 | 10.95 | 40.95 | F | - | - | - | - | - | - |
| NGC6958 | 34.79 | 10.34 | 11.07 | 10.97 | 40.68 | F | - | 0.239 | - | - | - | - |
| NGC6964 | 51.83 | 10.02 | 10.96 | 10.84 | 40.84 | F | - | - | - | - | - | - |
| NGC7007 | 37.39 | 10.16 | 10.91 | 10.82 | 40.70 | F | - | - | - | - | - | - |
| NGC7029 | 34.97 | 10.34 | 11.02 | 10.95 | 40.57 | F | - | 0.255 | 2.80 | - | - | - |
| NGC7041 | 23.39 | 10.09 | 10.80 | 10.70 | 40.24 | G | - | - | - | - | - | - |
| NGC7049 | 27.27 | 10.37 | 11.32 | 11.19 | 41.01 | G | G | - | - | - | - | - |
| NGC7097 | 29.24 | 10.13 | 10.81 | 10.71 | 40.28 | G | - | 0.305 | - | - | - | - |
| NGC7144 | 21.38 | 10.14 | 10.82 | 10.77 | 39.64 | G | G | 0.285 | - | - | - | - |
| NGC7145 | 21.38 | 10.04 | 10.61 | 10.53 | 40.25 | G | - | 0.259 | - | - | - | - |
| NGC7166 | 30.43 | 10.02 | 10.91 | 10.83 | 40.45 | G | - | - | - | - | - | - |
| NGC7168 | 34.57 | 10.12 | 10.87 | 10.77 | 40.59 | F | - | - | - | - | - | - |
| NGC7173 | 32.65 | 10.04 | 10.79 | 10.71 | 40.86 | G | - | 0.289 | - | - | 0.88 | - |
| NGC7176 | 32.39 | 10.27 | 11.16 | 11.06 | 40.80 | G | - | 0.323 | - | - | 1.20 | - |
| NGC7180 | 16.05 | 9.18 | 9.91 | 9.81 | 40.07 | F | - | 0.209 | - | - | 0.95 | - |
| NGC7185 | 24.04 | 9.59 | 10.23 | 10.20 | 40.38 | F | - | - | - | - | - | - |
| NGC7192 | 35.77 | 10.42 | 11.05 | 10.93 | 40.85 | G | G | 0.261 | - | - | - | - |
| NGC7196 | 36.51 | 10.35 | 11.16 | 11.04 | 40.95 | F | - | 0.293 | - | - | - | - |
| NGC7236 | 105.60 | 10.39 | 11.45 | 11.30 | 41.63 | D | - | 0.295 | - | - | 1.58 | - |
| NGC7252 | 52.48 | 10.66 | 11.06 | 10.96 | 40.50 | G | - | - | - | - | - | - |
| NGC7265 | 68.17 | 10.56 | 11.54 | 11.44 | 41.70 | F | - | - | - | - | - | - |
| NGC7332 | 15.28 | 9.86 | 10.51 | 10.42 | 40.01 | F | - | 0.242 | - | 0.90 | 2.49 | -5.09 |
| NGC7454 | 24.32 | 9.95 | 10.58 | 10.48 | 40.20 | G | - | 0.215 | - | - | 2.21 | -4.66 |
| NGC7457 | 10.67 | 9.78 | 10.13 | 10.02 | 39.49 | F | - | 0.178 | 0.00 | 0.35 | 2.45 | - |
| NGC7465 | 24.32 | 9.64 | 10.30 | 10.19 | 41.36 | G | A | - | - | - | - | - |
| NGC7484 | 34.69 | 10.16∗ | 10.89 | 10.78 | 40.93 | F | - | - | - | - | - | - |
| NGC7507 | 17.78 | 10.23 | 10.93 | 10.85 | 40.77 | F | - | 0.345 | - | - | 1.42 | - |
| NGC7550 | 69.64 | 10.61 | 11.47 | 11.36 | 40.31 | G | G | - | - | - | - | - |
| NGC7562 | 39.99 | 10.46 | 11.22 | 11.12 | 40.93 | C | - | 0.292 | - | - | 1.72 | - |
| NGC7619 | 39.99 | 10.58 | 11.34 | 11.21 | 41.63 | C | C | 0.345 | 0.30 | - | 1.48 | -6.89 |
| NGC7626 | 39.99 | 10.61 | 11.34 | 11.25 | 41.06 | C | C | 0.339 | - | 0.36 | 1.33 | -6.47 |
| NGC7768 | 92.04 | 10.92 | 11.54 | 11.43 | 41.74 | D | C | 0.312 | 0.00 | 0.00 | 0.83 | - |
| NGC7796 | 39.45 | 10.48 | 11.23 | 11.12 | 40.74 | F | - | 0.254 | - | - | - | - |
| UGC1308 | 55.21 | 10.16∗ | 11.13 | 11.07 | 40.98 | G | - | 0.315 | - | - | - | - |
| UGC4956 | 67.63 | 10.45 | 11.14 | 11.05 | 41.60 | C | - | 0.321 | - | - | - | - |
| The sources for each column are listed in order of preference. | ||||||||||||
| a Prugniel & Simien (1996), HyperLeda. | ||||||||||||
| b from LEDA, from NED, from LEDA, from NED. Values derived from are marked with an asterisk. | ||||||||||||
| c Jarrett et al. (2003), Jarrett et al. (2000). Apparent magnitudes were converted to luminosities | ||||||||||||
| using the distances in column 2 (see the text for details). | ||||||||||||
| d All values are from O’Sullivan et al. (2001a), however, some of these were derived from the catalogues Beuing et al. (1999), | ||||||||||||
| Fabbiano et al. (1992) and Roberts et al. (1991). | ||||||||||||
| e Environment as given in O’Sullivan et al. (2001a), F=field galaxy, G=group member (based on Garcia 1993), | ||||||||||||
| C=cluster member (based on Abell et al. 1989 and Faber et al. 1989), | ||||||||||||
| D=distanceMpc (for which environment cannot be accurately determined). | ||||||||||||
| f Brightest group galaxies (G, from Garcia 1993), brightest cluster galaxies (C, from Abell et al. 1989 and Faber et al. 1989), | ||||||||||||
| dwarfs (D, ) and AGN (A, from Véron-Cetty & Véron 2001) as given in O’Sullivan et al. (2001a). | ||||||||||||
| g HyperLeda, where more than one value was available an average value is given. | ||||||||||||
| h Pellegrini (1999), Faber et al. (1997), Bender et al. (1989). | ||||||||||||
| i Pellegrini (1999), Rest et al. (2001), Ravindranath et al. (2002), Faber et al. (1997). | ||||||||||||
| j Denicoló et al. (2005), Kuntschner (2000), Trager (1997). | ||||||||||||