An Atlas of K-line Spectra for Cool Magnetic CP Stars
The Wing-Nib Anomaly (WNA)
Abstract
We present a short atlas illustrating the unusual Ca ii K-line profiles in upper main sequence stars with anomalous abundances. Slopes of the profiles for 10 cool, magnetic chemically peculiar (CP) stars change abruptly at the very core, forming a deep “nib.” The nibs show the same or nearly the same radial velocity as the other atomic lines. The near wings are generally more shallow than in normal stars. In three magnetic CP stars, the K-lines are too weak to show this shape, though the nibs themselves are arguably present. The Ca ii H-lines also show deep nibs, but the profiles are complicated by the nearby, strong H absorption. The K-line structure is nearly unchanged with phase in CrB and Cir. Calculations, including NLTE, show that other possibilities in addition to chemical stratification may yield nib-like cores.
1 Introduction
Abundance studies of chemically peculiar (CP) stars of the upper main sequence are usually based on classical, plane-parallel atmospheres. Until recently, there was little evidence that this assumption would lead to significant errors, apart from the obvious case of spectrum variables. Even in these cases, it was common to assume plane-parallel structure for localized regions (abundance patches) of the photosphere.
Recent work on the ionization equilibrium Ryabchikova, et al. (2004) and the Balmer profiles (Cowley, et al., 2001) of cooler CP stars in the magnetic sequence has drawn attention to significant departures from classical atmospheric structure.
Decades ago, spectroscopists had noted another indication of departures from a classical atmosphere in the Ca ii K-lines. Babcock (1958a) describes very complicated K-line profiles in a number of CP stars. In a few cases, variable profiles suggested to him “ejection of ionized clouds or streams such as the sun produces.” Analytical spectroscopists did little more than note these remarks at the time. Most of the interest in CP star focused on their peculiar abundances and attempts, for example, by Conti (1965) and van’t Veer (1966) to explain the abundance anomalies in Am stars by unorthodox models had been unsuccessful.
New, high-resolution observations make it appropriate to take a closer look at the K-lines of CP stars. We confine ourselves to spectra of cooler magnetic stars with minimal rotational broadening. We find that the K-lines of these stars generally exhibit a “wing-nib anomaly” (WNA).
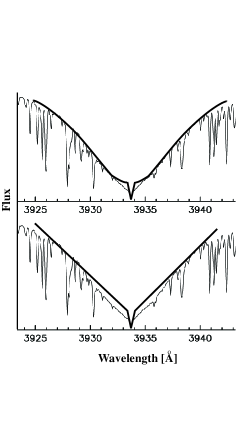
Two forms for the WNA are shown schematically in Fig. 1. In the upper part of the figure, the wings show a gently changing slope, which appears to nearly level off prior the deep minimum. In the lower part of the figure, the wings show an approximately constant slope beyond the deep nib. In both cases, the region outside of the nib has a higher intensity than is observed for normal stars, or the Am star HR 1353. Individual examples are cited in the captions of figures to follow.
The Ca II H-line also shows a sharp, deep nib, but the structure is complicated by the presence of the strong Balmer H line. We shall not discuss the H-line in this paper.
2 Previous K-line Work
Complications in the core of the Ca ii K-line (as well as the H-line) are well known in stellar astronomy. The most common phenomena are single and double reversals (e.g. K2, and K3). These reversals are common among F-type stars, and may be seen, weakly, in the central cores of several non-CP stars discussed later in the paper. Additionally, there are numerous examples of sharp, interstellar components, which typically have different radial velocities than the stellar lines.
It is likely that Babcock (1958b) saw the WNA among a variety of other phenomena that influence the K-line structure in CP stars. However, his papers give verbal descriptions, not detailed profiles.
An important observational step was taken by Babel (1994). He measured two K-line “equivalent widths,” a within Å of the line center, and a within Å. He showed that for a given , the was smaller for Ap stars than for normal stars. In other words, the core absorption of Ap stars was smaller than for normal stars with comparable overall K-line strengths. Note this does not of itself indicate the presence of a nib. Clearly nibs, when present, increase the absorption rather than reduce it. The / trend found by Babel persists in spite of the nibs rather than because of them.
The current atlas elaborates these findings for the small class of Ap stars. Our UVES spectra have twice or more typically four times the resolution employed by Babel. Finally, because we deal with profiles rather than equivalent widths, we show in detail how the K-line absorption in peculiar and normal stars differs.
Ca K-line nibs may indeed be seen for three stars in the papers by Babel (1992, 1994) and Ryabchikova, et al. (2002) 53 Cam, Equ, and CrB. None of these papers contrast the nib-structure with the Ca K profiles of normal stars.
3 Observations
All spectra were obtained with the VLT UV-Visual Echelle Spectrograph UVES at UT2. The major part of the spectra of magnetic CP stars was obtained in the course of our study of chemical abundances of CP stars (ESO programmes Nos. 70.D-0470, 072.D-0414, and 074.D-0392). A few other spectra of CP stars were retrieved from the ESO UVES archive (ESO programme No. 68.D-0254). Spectra of some other stars were downloaded from the UVESPOP web site (Bagnulo, et al., 2004). Details are summarized in Table 1; spectral types are from Renson, et al. (1991) and SIMBAD. The stars are all bright, and signal-to-noise ratios greater than 200 were typical. In a few cases where multiple scans were available, the spectra were averaged, weighted by the number of counts.
All spectra were observed with Dichroic standard settings at the resolving power of and have been reduced by the UVES pipeline Data Reduction Software, which is an evolved version of the ECHELLE context of MIDAS.
The 13 CP stars presented here were selected on the basis of (1) their chemical peculiarity, (2) their low values of the projected rotational velocity (), and (3) the availability of high-resolution, high signal-to-noise spectra. All stars have effective temperatures between approximately 6600 and 9600K. Of these, 10 show the WNA. The three stars without a WNA have Ca K profiles that are too weak to have extended wings. In the case of two of these stars, HR 5623 and HR 7552, the stars are too hot to have strong K-lines. The K-line is also too weak to show the WNA in Przybylski’s star. Przybylski’s star is the coolest in our sample, but the K-line is weak because of the low calcium abundance.
The magnetic Ap stars in Figs. 2 and 3 are arranged roughly in order of effective temperature. The bottom spectra of Fig 3 are of the Am star, HR 1353 (above) and the F2 V Boo (below). Among these spectra, Figs. 3A and especially 3B most closely resemble the upper schematic profile of Fig. 1. Figs. 2C, 2E, and 2F are examples of the lower profile of Fig. 1.
Fig. 4 shows two hotter magnetic Ap stars (A and B), and the cool roAp, Przybylski’s star (C). In all three cases, there is a deep, sharp, core, but the wings are too weak to provide the contrast we refer to as the wing-nib anomaly. In the case of Przybylski’s star, low-dispersion spectra show broad, shallow absorption in the region of the H+H and the K-line. This absorption is not obvious in Fig. 4. Nevertheless, one may say that Przybylski’s star also shows a WNA, though the proportions of the near wing and nib are quantitatively different from those of the ten other cool magnetic CP stars illustrated in Figs. 2 and 3.
HD 965 (Fig. 4D) has an intermediate temperature, probably near 8000K. Bord, et al. (2003) discuss the difficulties in finding a temperature for this star. The lower plot (Fig. 4E) is an LTE calculation using Michigan codes for a star with an effective temperature of 6750K, , and enhanced abundances as in a magnetic CP star.
4 Phase Variations
The WNA would be washed out in the spectrum of a star with significant rotational velocity. Thus, the spectra presented have all had sharp lines, and the stars themselves relatively long rotational periods. In Figs. 5 and 6 we present overplots of the K-line region for two stars with relatively shorter periods, Cir and CrB. Small variations are seen in both spectra, but the general shape of the WNA persists.
The relative constancy of these profiles might be compared with those of Babel’s (1992) Fig. 5 for 53 Cam, where considerable phase variation is seen. The 53 Cam spectra appear to show WNA at phases 0.17 and 0.29. These fundamental differences in phase behaviour show the importance of having bigger samples for the study of the WNA. Any model that attempts to explain this anomalous line profiles has to account for variable as well as non-variable line profiles.
5 Non-CP stars
We present K-line region spectra of several non-CP stars in Fig. 7, to make clear the distinction of WNA profiles. The upper spectrum is of the well-studied subdwarf, HD 140283. The star has an effective temperature close to that of the sun, but the lines are weak because of the very low metal-to-hydrogen ratios. Spectrum B is of Dor, a pulsating variable related to the Scuti stars, but surrounded by a dust envelope (Balona, et al., 1994). The bottom three spectra are of stars with MK types, though all are metal poor; 68 Eri is F2 V, 53 Vir is F6 V, and Pav is F6 V.
6 Discussion
It is our purpose to present an observational atlas and not a new interpretation of the wing-nib anomaly. We do not dispute stratification models. They are demonstrably capable of producing nibs. Nevertheless, a few remarks are appropriate.
The wing-nib and core-wing (Balmer lines) anomalies show that the atmospheres of at least some of the cool CP stars depart significantly from the classical models. This was suggested decades ago as an alternate explanation to abundance anomalies—a way to explain the peculiar spectra with normal abundances. The objections were dismissed forcefully by Sargent (1966). Briefly, he argued that the CP stars had normal colors, curves of growth, ionization temperatures, and Balmer profiles. His arguments were valid at that time though they are untenable today. Nevertheless, his conclusion is widely accepted, that the photospheres of magnetic CP stars are chemically anomalous.
Traditional abundance studies were based on classical, plane-parallel atmospheres, with a uniform chemical composition. Babel (1992) showed that a stratified abundance structure would produce a Ca K-line nib while Ryabchikova et al. (2002) used a chemically stratified model similar to Babel’s. They also obtained a K-line nib, though they did not fit it precisely. They found certain other atomic lines that could be fit more satisfactorily with the assumption of abundance stratification than with a traditional model.
Much new work has been devoted to this phenomena. Indeed, Dworetsky (2005) described the session of IAU Symposium 224 (Zverko, et al., 2005) on diffusion by saying “the keword …was ‘stratification.’” Kochukhov, et al. (2002) showed that the core-wing anomaly of the Balmer lines might be explained by an ad hoc variation in the – relation. We have made LTE calculations to show that wing-nib structure of Ca ii K may also be obtained with a modified –.
Most of the calculations relevant for the WNA have been made in LTE. We have begun calculations with the Kiel non-LTE code (Steenbock & Holweger 1984) that will be reported in more detail elsewhere. We use the updated version of the Ca model atom by Watanabe & Steenbock (1985) (Stürenburg, 1993). The core of the Ca ii K-line forms in layers of the atmosphere, where both involved levels show only very moderate deviations from LTE ( dex). Preliminary results show that these small quantitative differences from LTE in the K-line core vary somewhat with effective temperature. As an example, we present here a cool atmosphere (T K, ) with an ad-hoc modified – relation (see inset of Fig. 8). The atmosphere temperature was raised to K over the optical depth range . Fig. 8 shows the resulting LTE (solid line) and NLTE (dashed line) Ca ii K profiles. NLTE leads to a 5% weaker core, but does not affect the main profile and the wings; thus, it would not lead to significant abundance differences. At present it seems that a fully non-LTE approach could modify details of a workable model, but would not require qualitative changes.
Neither of the above modifications takes account of the influence of magnetic pressure on atmospheric structure. Thus, it is reasonable to explore a third plausible departure from a classical model atmosphere, based on a consideration of magnetohydrodynamical effects. We lack the information necessary to take such effects explicitly into account. One possibility is that they simulate a model with gravity that decreases outward (Conti, 1965; Valyavin, et al., 2004).
Since a model with reduced gravity in the upper layers would have lower pressured and therefore reduced atomic absorption, the effect should resemble that of stratified models. We have made provisional calculations showing that in LTE, such a model is indeed capable of yielding a K-line nib. Thus far, the modified-gravity models that give K-line nibs have not yielded core-wing anomalous Balmer profiles.
References
- Babcock (1958a) Babcock, H. W. 1958a, ApJ, 128,228.
- Babcock (1958b) Babcock, H. W. 1958b, ApJS, 3,141.
- Babel (1992) Babel, J. 1992, A&A, 258, 449.
- Babel (1994) Babel, J. 1994, A&A, 283, 189.
- Bagnulo, et al. (2004) Bagnulo, S., Jehin, E., Ledoux, C., et al. & the ESO Paranal Science Operations Team 2004, http://www.sc.eso.org/santiago/uvespop/ (see also ESO Messenger, 114, 10, 2003).
- Balona, et al. (1994) Balona, L. A., Krisciunas, K. & Cousins, A. W. J. 1994, MNRAS, 270, 905.
- Bord, et al. (2003) Bord, D. J., Cowley, C. R., Hubrig, S., & Mathys, G. 2003, BAAS, 35, 1357.
- Conti (1965) Conti, P. S. 1965, ApJS, 11, 47.
- Cowley, et al. (2001) Cowley, C. R., Hubrig, S., Ryabchikova, T. A., et al. 2001, A&A, 367, 939.
- Dworetsky (2005) Dworetsky, M. M. 2005, in The A-Star Puzzle, IAU Symp. 224, ed. J. Zverko, J. Žižňovský, S. J. Adelman, and W. W. Weiss (Cambridge: University Press), p. 499.
- Kochukhov, et al. (2002) Kochukhov, O., Bagnulo, S., & Barklem, P. S. 2002, ApJ, 578, 75.
- Kurtz (1989) Kurtz, D. W. 1989, MNRAS, 238, 261.
- Kurtz, et al. (1994) Kurtz, D. W., Sullivan, D. J., Martinez, P. & Tripe, P. 1994, MNRAS, 270, 674.
- Moore (1945) Moore, C. E. 1945, Cont. Princeton Univ. Obs., No. 20.
- Renson, et al. (1991) Renson, P., Gerbaldi, M., & Catalano, F. A. 1991, A&ASupp., 89, 429.
- Ryabchikova, et al. (2004) Ryabchikova, T., Nesvacil, N., Weiss, W. W., Kochukhov, O., & Stütz, Ch. 2004, A&A, 423, 705.
- Ryabchikova, et al. (2002) Ryabchikova, T., Piskunov, N., Kochukhov, O., Tsymbal, V., Mittermayer, P., & Weiss, W. W. 2002, A&A, 384, 545.
- Sargent (1966) Sargent, W. L. W. 1966, in Abundance Determinations in Stellar Spectra, (ed.) H. Hubenet, IAU Symposium, 26.
- Steenbock & Holweger (1984) Steenbock, W., & Holweger, H. 1984, A&A, 130, 319.
- Stürenburg (1993) Stürenburg, S. 1993, A&A, 277, 139.
- Valyavin, et al. (2004) Valyavin, G., Kochukhov, O., and Piskunov, N. 2004, A&A, 420, 993.
- van’t Veer (1966) van’t Veer, C. 1966, in Abundance Determinations in Stellar Spectra, IAU Symposium 26, ed. H. Hubenet (London: Academic Press), p. 261. Note the remarks by Cayrel following this paper.
- Watanabe & Steenbock (1985) Watanabe, T.,& Steenbock, W. 1985, A&A, 149, 21.
- Zverko, et al. (2005) Zverko, J., Žižňovský, J., Adelman, S. J., and Weiss, W. W. 2005, The A-Star Puzzle, IAU Symposium 224 (Cambridge: University Press).
| HD | Other | Date | Phase | Sp. |
|---|---|---|---|---|
| 965 (catalog HD 965) | BD +0 21 | 18/09/2002 | A8p Sr | |
| 24712 (catalog HD 24712) | HR 1217 | 13/03/2001 | A9 SrEuCr | |
| 27290 (catalog HD 27290) | Dor | 19/09/2002 | F4 III | |
| 27411 (catalog HD 27411) | HR 1353 | 14/08/2002 | A3m | |
| 33256 (catalog HD 33256) | 68 Eri | 21/09/2002 | F2 V | |
| 101065 (catalog HD 101065) | Przybylski’s | 11/01/2003 | Fp REE | |
| 114642 (catalog HD 114642) | 53 Vir | 27/07/2001 | F6 V | |
| 116114 (catalog HD 116114) | BD -17 3829 | 06/02/2003 | F0 SrCrEi | |
| 122970 (catalog HD 122970) | BD +6 2827 | 21/01/2002 | F0p | |
| 128167 (catalog HD 128167) | Boo | 13/03/2001 | F2 V | |
| 128898 (catalog HD 128898) | Cir | 25/01/2005 | 0.94 | A3-A9 |
| 27/01/2005 | 0.19 | |||
| 01/02/2005 | 0.40 | |||
| 05/02/2005 | 0.50 | |||
| 133792 (catalog HD 133792) | HR 5623 | 26/02/2002 | A0 SrCr | |
| 134214 (catalog HD 134214) | BD -13 4081 | 26/02/2002 | F2 SrEuCr | |
| 137909 (catalog HD 137909) | CrB | 03/02/2004 | 0.30 | A9 SrEuCr |
| 03/26/2004 | 0.60 | |||
| 03/27/2004 | 0.65 | |||
| 03/29/2004 | 0.76 | |||
| 04/01/2004 | 0.92 | |||
| 137949 (catalog HD 137949) | 33 Lib | 20/09/2002 | F0p | SrEuCr |
| 140283 (catalog HD 140283) | BD -10 4149 | 08/07/2001 | sdF3 | |
| 176232 (catalog HD 176232) | 10 Aql | 08/10/2001 | A6 Sr | |
| 187474 (catalog HD 187474) | HR 7552 | 07/10/2001 | A0 EuCrSi | |
| 188041 (catalog HD 188041) | HR 7575 | 08/10/2001 | A6 SrCrEu | |
| 203608 (catalog HD 203608) | Pav | 06/12/2002 | F6 V | |
| 216018 (catalog HD 216018) | BD -12 6357 | 08/10/2001 | A7 SrCrEu | |
| 217522 (catalog HD 217522) | CD =45 14901 | 21/09/2002 | A5 SrEuCr |
| star(HD) | width[Å] | star(HD) | width[Å] |
|---|---|---|---|
| 965 | 0.40 | 137949 | 0.45 |
| 24712 | 0.39 | 176232 | 0.33 |
| 116114 | 0.40 | 188041 | 0.35 |
| 122970 | 0.46 | 216018 | 0.39 |
| 137909 | 0.45 | 217522 | 0.53 |