Study of Fe K lines in Non-magnetic Cataclysmic Variables using Chandra HEG data
Abstract
Results from a study of Fe K emission lines for a sample of six non-magnetic Cataclysmic Variables (CVs) using the high resolution X-ray data from the Chandra High Energy Transmission Grating (HETG) are presented. Two of the sources, SS Cyg and U Gem are observed in both quiescent and outburst states whereas V603 Aql, V426 Oph, WX Hyi and SU UMa are observed only in quiescence. The fluorescent Fe line is prominent in V603 Aql, V426 Oph and SS Cyg during quiescence indicating the presence of a conspicuous reflection component in these sources. The observed equivalent width of the fluorescent Fe line is consistent with reflection from a white dwarf surface that subtends 2 solid angle at the X-ray source. During the outburst in SS Cyg, the fluorescent line is red-shifted by about 2300 km s-1. The Fe XXV triplet at 6.7 keV is found to be dominant in all sources. The value of the G-ratio derived from the Fe XXV triplet indicates that the plasma is in collisional ionization equilibrium during the quiescent state. The Fe XXV line is significantly broadened in U Gem and SS Cyg during the outbursts compared to quiescence, indicating the presence of a high velocity material near the white dwarf during the outburst. The ratio of Fe XXVI/XXV indicates a higher ionization temperature during quiescence than in outburst in U Gem and SS Cyg.
1 Introduction
Non-magnetic cataclysmic variables (CVs) are a subclass of CVs in which a white dwarf with a weak magnetic field (B104G) accretes material from the Roche lobe of a late type dwarf companion star (Warner, 1995). The accretion takes place via a disk around the white dwarf. Due to the weakness of the magnetic field the disk extends to the surface of the white dwarf. The Keplerian velocity of the material in the disk is generally greater than the rotational speed of the white dwarf. Near the inner edge of the disk the material slows down to match the white dwarf rotation. The X-ray emission is thought to arise from this boundary layer between the white dwarf and the inner edge of the accretion disk.
Dwarf Novae (DNe) are a subclass of the non-magnetic CVs that show frequent (at the interval of weeks to months) outbursts. According to theory, a thermal–viscous instability in the disk produces repetitive outbursts in these systems (see Lasota et al., 2001, for a review). On the other hand, in classical novae, another subclass of non-magnetic CVs, the eruptions are due to thermonuclear runaway of hydrogen rich material accreted on to the white dwarf. The amplitude of outburst in these systems is greater than in DNe.
A sample of DNe were studied using low-resolution (E/E 5 @ 6 keV) EXOSAT medium energy (ME) data (Mukai & Shiokawa, 1993) and it was found that line emission near 6.7 keV is a common feature in the hard X-ray spectra of DNe. The Fe XXV triplet is one of the most intense set of lines in the hard X-ray spectra of CVs (Pandel et al., 2005). The line emission near 6.7 keV originates from Fe K emission that has three main components: a fluorescent line at 6.41 keV, Fe XXV line (He-like) that has four subcomponents (a resonance line ‘’ at 6.7002 keV, two intercombination lines ‘’ and ‘’ at 6.6821 and 6.6673 keV, respectively and a forbidden line ‘’ at 6.6364 keV), and Fe XXVI Lyα line (H-like) with two subcomponents at 6.973 and 6.952 keV. The Fe XXV triplet (, , and ) is due to the transitions 1s2p 1P1 1s2 1S0, 1s2p 3P2,1 1s2 1S0, and 1s2s 3S1 1s2 1S0. The two components of the Fe XXVI line are due to the transitions 2p 2P3/2 1s 2S1/2 and 2p 2P1/2 1s 2S1/2. The Fe XXV and XXVI lines come from a plasma having a temperature of 107-8 K. The fluorescent line originates from relatively cold iron (Fe I–XVII) having temperatures 106 K. The low-resolution of the EXOSAT ME data was insufficient to distinguish between the various components of Fe Kα emission. Moderate resolution (E/E = 50 @ 6 keV) spectroscopy with ASCA and XMM-Newton has been a little more successful in resolving the components of Fe Kα emission, and several authors have reported Fe K lines for individual non-magnetic systems using the ASCA (see Done & Osborne, 1997, for SS Cyg) and XMM-Newton data (see Hakala et al., 2004, for YZ Cnc and references therein). Recently, Baskill, Wheatley, & Osborne (2005) presented a study of 34 non-magnetic CVs using ASCA data. The CCD spectrometer (SIS) allowed them to separate the three Fe Kα lines in the spectra. Of the 34 objects, only 4 bright sources showed the presence of a prominent fluorescent Fe line at 6.4 keV. This feature is attributed to the reflection of X-rays from the white dwarf surface and/or the accretion disk.
High spectral resolution (E/E 200 @ 6 keV) data obtained with Chandra provides an opportunity to study in detail the strength and profile of these lines. The Fe XXV and XXVI emission lines that originate from the high temperature (107-8 K) plasma serve as an important diagnostic tool for temperatures near the shocked regions in the boundary layer of these CVs. The intensity ratio of Fe XXVI to Fe XXV lines provides a measure of the ionization temperature of the plasma. Intensity ratios defined using the Fe XXV triplet can be used in principle to get information about the ionization state, temperature and density of the emitting plasma in collisional ionization equilibrium. Specifically, the ratio G, defined as (+)/ is sensitive to the electron temperature as well as the ionization state of the plasma. The ratio R=/ provides a density diagnostic. The fluorescent line of Fe that comes from relatively colder material can provide information about the contribution of reflected hard X-rays from the illuminating region.
In this paper, we present a detailed study of Fe K emission lines from a sample of non-magnetic CVs using the best available energy resolution X-ray data available from Chandra grating instruments. The next section describes the observations and the data analysis procedure. The results are presented in §3, and are discussed in §4. The conclusions are summarized in §5.
2 Observations and Data Analysis
High resolution X-ray data for a sample of six non-magnetic CVs obtained from the Chandra (Wiesskopf et al., 2002) High Energy Transmission Grating (HETG; Markert et al., 1994) during 2000 August to 2002 December are analyzed. The observations were made with HETG in combination with Advanced CCD Imaging Spectrometer (ACIS; Garmire et al., 2003) in faint spectroscopy data mode. The sample consists of five dwarf novae (SS Cyg, U Gem, WX Hyi, SU UMa and V426 Oph) and one old nova (V603 Aql). A log of the observations for the sources studied is given in Table 1. Average spectra for five of these sources in quiescence have been presented previously for SS Cyg, U Gem and V603 Aql see Mukai et al., 2003; Mauche et al., 2005; Mukai & Orio, 2005; Szkody et al., 2002, for V426 Oph see Homer et al., 2004, and for WX Hyi see Perna et al., 2003. Two of the six sources, SS Cyg and U Gem, are also observed during outbursts. SS Cyg was observed twice during a short outburst in the optical: near the peak of the outburst on 2000 September 12 and during an early decline of a narrow outburst on 2000 September 14 (Mauche et al., 2005). U Gem was observed at the peak of an outburst (Mauche et al., 2005). SU UMa was observed twice during 2002 April 12 & 13. The individual spectra of SU UMa show identical features, we have therefore combined the two spectra. A total of ten observations are analyzed.
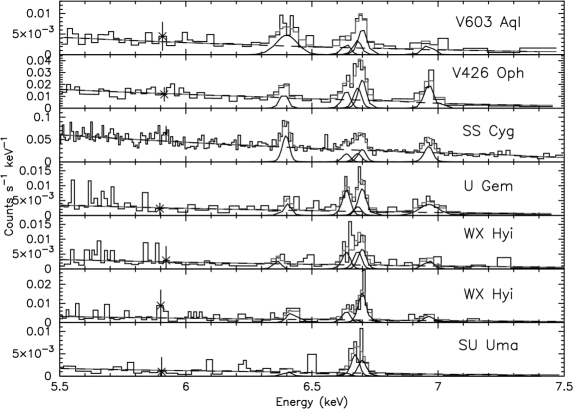
The data are reduced using the Chandra Interactive Analysis of Observations (CIAO version 3.1) software package following the analysis threads for HETG/ACIS observations 111(see http://cxc.harvard.edu/ciao/threads/gspec.html). For each source we extract the HEG (high energy grating) and MEG (medium energy grating) spectra for the combined 1 orders to improve the statistics of the spectra. The response files for each of the sources are generated using the fullgarf script. The add_grating_orders script is used to sum the grating orders and the corresponding response files. The HEG has an energy resolution of 43 eV or 1900 km s-1 (FWHM) at 6.7 keV energy. The HEG has a higher effective area than the MEG in the 6–7 keV band, so we have used the HEG data to study the iron lines. We show in Figures 1 & 2 only the relevant portion (5.5–7.5 keV) of the HEG spectrum of each source, since our focus is the study of the Fe XXV, XXVI, and fluorescent emission lines. Representative error bars for each spectrum are shown at a point near 5.9 keV. The default binning for the HEG spectra is 0.0025 , which oversamples the instrumental resolution by a factor of 5. For the line profile modeling using grating response, oversampling is recommended. Therefore, we have tried several ways of binning the data (for example binning by a factor of 2, 5, and 10 and minimum 5 or 10 counts per bin) and found that the binning by a minimum of 5 or 10 counts per bin preserves the instrumental resolution and line profile at that energy. This binning groups the energy channels corresponding to the continuum by a large factor but the channels for lines remain single or are grouped by a factor of two only. Hence, the spectra were binned to give a minimum of 5 or 10 counts per bin depending on the source strength.
For simplicity, a power law is used to model the local continuum while the emission lines are modeled using several Gaussians. For spectral analysis the XSPEC v11.3.1 (Arnaud, 1996) and ISIS v1.2.6 222http://space.mit.edu/CXC/ISIS software packages are used. A Gaussian is used to fit the fluorescent Fe line. The , , and components of Fe XXV lines are fitted with three Gaussians (see §3.2 below). The Fe XXVI lines are fitted with a single Gaussian, since the two Lyα components are unresolved at the resolution of the Chandra HEG. To check for any broadening of the emission lines, other than that of the instrument, the width of the Gaussian is allowed to vary during the initial fitting. For final fitting the width is fixed at zero for the cases where it is found consistent with the instrumental resolution. The possible shift in the line position is also checked by allowing the line energy to vary. The line centroids are kept fixed wherever they are found to be consistent with the expected values of line energy. The measured equivalent width (EW) and the photon flux in the lines for all sources are listed in Table 2. The errors are with 90% confidence interval for a single parameter (=2.706). Since the counts in the HEG spectra are low, we have used the C statistic (Nousek & Shue, 1989) based on the maximum likelihood approach, which provides a better defined confidence range for a parameter derived using data with a small number of counts per energy bin.
3 Results
The results of our analysis are summarized in Tables 2 & 3 and in Figures 1 & 2. The details are presented in the following subsections.
3.1 The Fluorescent Iron Line
During the quiescent state, the fluorescent Fe line at 6.4 keV is prominent in V603 Aql, V426 Oph, and SS Cyg, whereas it is relatively weak in U Gem, WX Hyi, and SU UMa, as shown in Fig. 1. The width of the fluorescent Fe line is consistent with the instrumental resolution in all sources, except in V603 Aql, which shows the strongest fluorescent Fe line with an EW of 162 eV. The broadening in the line is a factor of 2.5 greater than the instrumental resolution. For WX Hyi during 2002 July 28 observation the best fit value for the fluorescent Fe line energy is 6.360.04 keV. Though the best fit value indicates an apparent red-shift in the line, the upper value of the 90% confidence interval is consistent with a zero redshift. The other observation of WX Hyi during 2002 July 25 shows the line center at its expected value of 6.4 keV with an EW of 55 eV. For the other sources the line center is at its expected value of 6.4 keV during the quiescent state. In V426 Oph, SS Cyg, and U Gem, the fluorescent Fe lines with EWs of 39, 59 and 46 eV, respectively, are identical within the 90% confidence limit. The EW of the line in SU UMa has a 90% confidence interval of 0–70 eV with the best fit value of 23 eV, and is the weakest measured among the six sources in the quiescence.
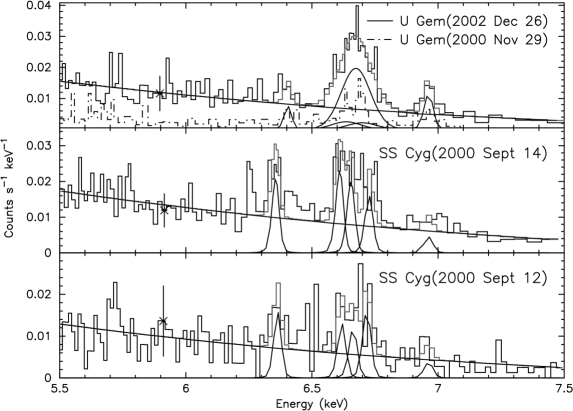
The principal components of the Fe Kα emission lines during the U Gem and SS Cyg outbursts are shown in Figure 2. U Gem shows a weak fluorescent line with an EW of 22 eV centered at 6.4 keV. On the other hand, SS Cyg shows a red-shifted fluorescent line from Fe during the two observations. The best fit value of the line center during 2000 September 12 is 6.350.02 keV and during 2000 September 14 it is 6.350.01 keV with their equivalent widths of 68 and 60 eV, respectively. The shift in the line energies correspond to velocities of 2300 and 2300 km s-1 during 2000 September 12 and 14 observations for SS Cyg, respectively. The width of the line is consistent with the instrumental resolution in both sources during the outburst. The EWs are about the same in outburst and quiescence.
3.2 Fe XXV Line
The Fe XXV line is a dominant line in all sources during both the quiescent and outburst states. At the Chandra HEG resolution, the and components are clearly resolved. The separation between and components is only 14.8 eV and these lines are unresolved, hence a single Gaussian with center at 6.675 keV has been used to account for these components. The component is marginally resolved from . Thus, we used three Gaussians to characterize the , , and components of Fe XXV line. It is possible to discern some of the structure in the line components and get information about their relative strengths and probe the density and temperature structure of the emitting region.
We have checked for any shift in the line positions and line broadening for these components and found that line centroids are consistent with the expected values and line width with the instrumental resolution for all sources in quiescence. Among the three components of the Fe XXV lines, the resonance line is the stronger one in all sources in the quiescent state, except SU UMa.
During outbursts, the systems show considerably different profiles for the Fe XXV lines. An inspection of this line indicates that the , and components are either broadened or shifted significantly from their expected values (see Fig. 2). The broad emission lines in the outburst spectra of SS Cyg and U Gem have been previously reported by Mauche et al. (2005). For comparison we show both the outburst (solid line) and the quiescence (dash-dotted line) spectra of U Gem in the top panel of Fig. 2. In order to quantify any broadening or shift, we have first fitted the Fe XXV line components with unresolved Gaussians and centroids at the theoretical positions. This gives significant residuals near the wings of the line for both sources indicating that the , and line components are either broadened or shifted. Hence some modification must be made to the base model of “no broadening and no shift” to reproduce the data for these two sources.
After fitting the lines of U Gem with a Gaussian of zero width, significant residuals are seen near 6.6 and 6.75 keV indicating the presence of broad wings in the Fe XXV line. We then allowed the widths of the , and lines to vary in order to account for the residuals. However, since the Fe XXV triplets arise from transitions in a single ion, they must be physically related, and thus likely to originate from the same physical conditions of temperature and density. Therefore, the line widths were tied together and allowed to vary by an equal amount during the fitting. The centroid of all the components were fixed at their expected values. The best fit with various Gaussian components is shown in the top panel of Fig. 2. This gives a common width =55 eV for the , and components with 90% confidence. The EW of , and lines are 26, 325 and 28 eV, respectively (see Table 2). Alternatively, it is also possible to fit the Fe XXV lines by allowing the center energy of , and components to vary, but retaining the unresolved lines. However, the former fitting leads to a lower by 12 and better represents the line profile.
Of the two outburst observations of SS Cyg, the one on 2000 September 14 has a longer exposure and better statistics than on 2000 September 12. The September 14 observation shows a flat top profile for the Fe XXV lines unlike the broad Gaussian shape seen in U Gem during outburst (see Fig. 2, middle panel). We provided the same treatment described above for U Gem to the SS Cyg spectra. Fixing the line energies at their expected values and allowing the width of the , and lines to vary, fails to account for the flat portion of the line that spans 6.6–6.8 keV range. This suggests that the line positions are shifted rather than being broadened. Therefore, we allow the central energies of the , and lines to vary, retaining the unresolved line widths. The , and lines are allowed to shift in the same direction and by an equal amount. However, this fit gives significant residuals at either the blue or the red side of the overall profile and fails to account for the flat top shape of the line. A better fit can be obtained by allowing the centroid of the individual lines to vary in either direction by equal amounts. This fit, shown in the middle panel of Fig. 2, leads to an unusual situation in which the line shows a blue-shift of 25 eV (1120224 km s-1), and the and lines are red-shifted by the same amount. The best fit values of energies for , and lines are respectively 6.725, 6.650, and 6.612 keV with a 90% confidence interval of 0.005 keV. The equivalent widths are 70, 72, and 82 eV for , , and , respectively. These results are discussed in section 4.4.
Similarly, during 2000 September 12, SS Cyg shows a flat top line profile and hence the broadened line components do not reproduce the observed line profile. In this case too, a better fit to the overall line structure (see Fig 2, bottom panel) is obtained with a blue-shifted line and red-shifted and lines! The best fit values of energies for , and lines are 6.718, 6.657, and 6.619 keV, respectively, with a 90% confidence interval of 0.005 keV, and a shift of 18 eV (806224 km s-1). The equivalent widths for , , and are 99, 60, and 65 eV, respectively.
Since the Fe XXV triplet provides important spectral diagnostics of the emitting region, we have calculated the line intensity ratios G and R for all sources during both the quiescent and outburst states, and listed them in Table 3.
3.3 Fe XXVI Line
During the quiescent state, the center of Fe XXVI line is found to be at 6.96 keV for all sources, indicating no shift in the line position with respect to the laboratory value. The line width is also consistent with the instrumental resolution except for U Gem for which the line is found to be broadened by a factor of 2 compared to the instrumental value. This indicates the presence of randomized motion of material in the boundary layer of this source. The EW of Fe XXVI line in U Gem is 181 eV. It should be noted that the dielectronic recombination produces satellite lines red-ward of the principal lines (6.91–6.95 keV), which can shift the centroid toward lower energies.
V426 Oph has a strong Fe XXVI line with an EW of 136 eV indicating the presence of high temperature plasma in the boundary layer. On the other hand, this line is absent in SU UMa, hence the temperature of the emitting region is relatively low in this system as compared to the other sources. The other sources show a relatively weaker Fe XXVI line with EW100 eV.
During outburst, the Fe XXVI line is found to be at its expected value in SS Cyg and U Gem. It is also narrow and consistent with the instrumental resolution, thus requiring no extra broadening. This line is stronger in U Gem with EW of 65 eV, as compared to SS Cyg, which has EW of 27 and 27 eV during the two observations.
4 Discussion
4.1 Fe XXV triplet: Plasma Diagnostics
The intensity ratios of the emission lines from He-like ion provide valuable spectral diagnostics for temperature, density and ionization state for plasma in collisional ionization equilibrium. For Fe XXV the principal lines can be contaminated by the dielectronic satellites (DES) for plasma in collisional ionization equilibrium (Oelgoetz & Pradhan, 2001). It is not possible to resolve these lines from the principal lines at the available energy resolution but it is possible to infer their relative contribution to the observed spectrum depending on the temperature of the emitting plasma. The DES dominate principal lines at temperatures below 3107 K and their contribution at higher temperatures is negligible (Oelgoetz & Pradhan, 2001).
It can be seen from the Fig. 1 and Table 2 that the resonance line is stronger compared to the other two components of Fe XXV line for all sources during quiescence, except for SU UMa. The relative strength of the resonance line indicates that the temperature of the emitting plasma is above 3 107 K (Oelgoetz & Pradhan, 2001), where the principal lines dominate. Therefore, we can use these lines to infer the temperature and density of the emitting region. The G-ratio is very close to 1 (within 90% confidence limit; see Table 3) for most of the sources indicating that the plasma is mainly in collisional ionization equilibrium (Oelgoetz & Pradhan, 2001) with electron temperature Te 107 K for Fe XXV. SS Cyg, during one of the outbursts, shows a somewhat higher G-ratio value (2.4) that might indicate the presence of hybrid plasma in the system. For U Gem during the outburst, the value of the G-ratio is unconstrained, and therefore does not allow us to comment on the ionization state and the temperature of the emitting plasma.
The mean value of the R-ratio for SS Cyg (during both quiescence and outburst), V603 Aql, V426 Oph, and WX Hyi (2002 July 28 observation) is close to unity and varies between 0 to 2.5. For two sources, U Gem and WX Hyi (2002 July 25 observation) during quiescence, the R-ratio is very high and essentially unconstrained (see Table 3). On the other hand SU UMa and U Gem (during outburst) show very low values of the R-ratio. According to the theoretical curves presented by Bautista & Kallman (2000), the Fe XXV R line ratio is 1 for low densities and rolls over to 0 at a critical density of 1 cm-3. Thus, the above mentioned values of the R-ratio (also see Table 3) for the Fe XXV triplets do not allow us to constrain the plasma densities in the non-magnetic CVs studied here. It should be noted, however, that the Fe XXV triplets are not fully resolved with the HEG data and hence the error estimations on individual line fluxes are not completely independent of each other. This may affect the errors on the G and R-ratios. Better resolution data with sufficient signal to noise ratio are required to properly constrain the line ratios for these sources.
4.2 Fe XXVI to XXV line ratio
In Figure 4, we show the observed line ratio of Fe XXVI/Fe XXV in various sources as a function of ionization temperature. We have used the summed flux of , and lines of Fe XXV for calculating this ratio. The solid curve represents the expected line ratio for Fe as a function of ionization temperature assuming the plasma is in collisional ionization equilibrium (Mewe et al., 1985).
It is clear from the Fig. 4 that the lower limit of the ionization temperature is not constrained by the HEG data for several sources, namely SU UMa, V603 Aql, WX Hyi (2002 July 28), and SS Cyg during one of the outburst observations. However, it is well constrained for U Gem, SS Cyg during quiescence, and V426 Oph. In general the ionization temperature for all CVs studied here is 12 keV. For SS Cyg, it has been observed that during optical outburst the hard X-ray (3–20 keV) bremsstrahlung temperature is lower by a factor of 2 than during quiescence (Done & Osborne, 1997; Wheatley, Mauche, & Mattei, 2003; McGowan, Priedhorsky, & Trudolyubov, 2004). Since the plasma lines of Fe originate from the hot shocked region, the ionization temperature derived from these lines is expected to show a similar behavior. The observed decrease in the ionization temperature during outburst is consistent with previous hard X-ray observations of the continuum in SS Cyg.
4.3 Reflection and the Fluorescent Fe line
In non-magnetic CVs, the fluorescent iron line is believed to arise due to reflection of hard X-rays from the white dwarf surface or the inner edge of the accretion disk. In the quiescent state at low accretion rates, the inner accretion disk is either absent or optically thin and hence contributes little to the observed reflection component. Therefore, a significant contribution to the fluorescent Fe line in DNe in the quiescent state comes from the reflection off the white dwarf surface. It can be seen from the Table 2 that the fluorescent line in all sources is not very strong (with EW60 eV) except for V603 Aql. This could be because only the surface of the white dwarf contributes to the fluorescent line.
If the fluorescent line is mainly due to reflection, then the strength of this line should depend on the inclination angle of the system. For a system having a large inclination angle the fluorescent line is expected to be weak, because it prevents the observation of any reflection from the inner edge of the disk (Ramsay et al., 2001). We have looked for such correlations in this sample of CVs. In Figure 3 we have plotted the observed EW of fluorescent line as a function of system inclination. The values of the inclination angle have been taken from Baskill, Wheatley, & Osborne (2005) and Warner (1995). As the figure demonstrates there is no clear trend between the two parameters. The systems with inclination angle above 30∘ show equivalent widths that are similar within the 90% confidence interval with the mean value of 50 eV. In our sample there is only one source below 30∘ (V603 Aql) that shows the highest equivalent width of 162 eV. We need a larger number of sources with inclinations below 30∘ to explore any relation between the two parameters. However, it gives some indication that the systems with very low inclination (below 20∘) may have a strong fluorescent line whereas those with an inclination above 70∘ have a weak line. On the other hand, Hakala et al. (2004) reported that a dwarf nova YZ Cnc has a low inclination angle and still lacks the 6.4 keV fluorescent emission line. Also Baskill, Wheatley, & Osborne (2005) found prominent fluorescent lines in only 4 CVs out of 34 with no correlation of the line strength and the system inclination. Thus the reason for the strength (or weakness) of this line in the non-magnetic CVs remains unclear.
The old nova V603 Aql shows a strong fluorescent line with the highest EW of 162 eV among all sources (see §3.1). Mukai & Orio (2005) reports a similar EW for this line and attribute it to the reflection from a surface that subtends an angle of 2 as seen from the primary X-ray source assuming a solar abundance of Fe. The line is found to be broadened with a best fit value of line width 37 eV that corresponds to about 1730 km s-1. The broadening in this line can be due to thermal broadening, Doppler broadening or Compton scattering in the material responsible for reflection. The natural width of this line is few eV (George & Fabian, 1991) and any broadening due to the thermal motion of the emitting atoms is 0.4(T/)1/2 eV, which is very small compared to the resolution of the HEG. Hence the observed broadening can only be due to either the Doppler effect, Compton scattering or both.
V426 Oph shows a much weaker fluorescent line emission with an EW of 39 eV when compared with the previously reported value of 18540 eV by Baskill, Wheatley, & Osborne (2005) using ASCA data taken during 1994 September 18. However, they found that the inclusion of a reflection continuum reduced the plasma temperatures and the EW of the 6.4 keV line.
SS Cyg, with the highest signal-to-noise ratio, shows a prominent line at 6.4 keV with EW of 59 eV. Previous ASCA and Ginga data of SS Cyg show the presence of significant reflection in their spectra (Done & Osborne, 1997). This line is also present in SS Cyg during outbursts with a similar EW but their line centers are red-shifted by 50 eV. This shift corresponds to a very high velocity of about 2300 km s-1 during the outburst. An outflowing wind with such a high velocity has been reported from SS Cyg during an outburst (Mauche, 2004). Also the presence of a high velocity wind in CVs has been reported previously by Prinja & Rosen (1995) using high resolution IUE observations. We suggest that the observed high velocity probably arises from the wind that is moving away from the system during the outburst.
Ezuka & Ishida (1999) have shown that apart from reflection from the white dwarf surface, NH along the line of sight also contributes to the EW of the fluorescent iron line. The observed value of NH for these sources vary in the range of 1020-22 cm-2 (Mukai et al., 2003; Homer et al., 2004; Perna et al., 2003; Pandel et al., 2005). If NH is the only contributor to the fluorescent Fe line, then for such a low value of NH, the expected value of EW is 10 eV assuming that the source is surrounded by a uniform absorber at a 4 solid angle. However, the observed best fit value of the EW varies in the range of 23–162 eV (see Table 2) indicating the dominance of the reflection process over the absorption, resulting in the observed fluorescent Fe line.
4.4 Quiescence vs. Outburst States
As mentioned in §2, two of the six sources, viz., U Gem and SS Cyg, are observed in both quiescence and outburst. Such observations provide an opportunity to study the response of the system with changes in its intensity. As shown in Figs. 1 & 2, the three Fe emission lines have considerably different profiles during the two states. In particular, the profile of the Fe XXV triplet is significantly different during the two states. In U Gem during quiescence, this line has a double humped profile reflecting the dominance of the and lines over the components. During the outburst, the line shows a broad symmetric Gaussian profile indicating the presence of high velocity material near the white dwarf. The common line width () for , and lines is 55 eV, which corresponds to a velocity of 2460 km s-1.
A “flat-top” profile is observed for SS Cyg during an outburst. Such a profile has been reported for N VII line in O-type star, Puppis using Chandra HETG data and attributed to small velocity gradient at the larger radii in the outflowing winds in the star (see Cassinelli et al., 2001; Kahn et al., 2001). The failure to find a common shift for the , and lines during the outburst, and the unusual result of a blue-shifted resonance component and red-shifted and components, is most likely just symptomatic of the non-gaussian shape of the line profile. This could be due to velocity-smeared bulk motion of material present either in a Keplerian orbit around the white dwarf or a wind flowing away from the system. Mauche (2004) reported the presence of a high velocity wind (2500 km s-1) in SS Cyg during an outburst observed with the Low Energy Transmission Grating (LETG) data. On the other hand, the spectra of SS Cyg in quiescence do not show any shift or broadening in the Fe XXV triplet.
Flat top or a double peaked line profiles have also been observed in active galactic nuclei, and interpreted as due to the material flowing away from the central object. For example, a Seyfert-1 Galaxy Mrk 509 has been observed to show such a line profile from outflowing gas (Phillips et al., 1983). Under favorable viewing conditions one can see both the material moving away and approaching towards the observer that can produce such a line profile. However, the present data cannot resolve this issue. It is also possible that some higher-order effects like optical depth and radiation transfer may be playing a role in producing the observed line profile. In addition, the exposure time of 36 and 60 ksec (see Table 1) of SS Cyg during 12 and 14 September 2000 covers 1.5 and 2.5 orbital cycles with an orbital period of 6.6 hrs. The discordant wavelength shift is probably caused by the long exposure, during which the conditions in the emitting region might have changed significantly. The summed line may represent a merger of a broad range of physical conditions. Detailed radiative transfer calculations are required to account for the higher-order effects, which is not within the scope of the present paper.
It has been observed during an optical outburst of SS Cyg that the hard X-ray flux (3 keV) is suppressed and the spectrum softens, whereas the X-ray flux is high and the spectrum is harder during the optical quiescence (McGowan, Priedhorsky, & Trudolyubov, 2004, and references therein). The observed X-ray flux in SS Cyg in the HEG band of 0.4–8 keV is 1.8 10-10 ergs cm-2 s-1 during quiescence and it is 4.0 10-11 and 4.8 10-11 ergs cm-2 s-1 during the outburst of 12 and 14 September 2000, respectively. This suggests that for SS Cyg during an optical outburst the X-ray flux is suppressed by a factor of 3–4 supporting the previous observations. On the other hand U Gem shows the opposite behavior, when it goes in to optical outburst its X-ray flux in 0.4–8 keV range increases by a factor of 2–3.
4.5 Comparison with Magnetic CVs
Prominent Fe Kα emission lines have been observed in magnetic CVs (MCVs). The Fe XXV and Fe XXVI lines are believed to originate in a hot plasma in the post-shock region and the appearance of the fluorescent Fe line is attributed to reflection from the white dwarf surface or the cool pre-shock material (Ezuka & Ishida, 1999). A study of Fe K complex in magnetic CVs has been reported by Hellier & Mukai (2004) using the Chandra HETG data. They use a power law and three Gaussian components to model the Fe Kα emission lines in a sample of five MCVs. They find that the Fe XXVI line is red-shifted by 260 km s-1 from a simultaneous fit to the spectra of five MCVs and suggested that the presence of the satellite lines can cause the small observed red-shift. For non-magnetic CVs, we have not observed any detectable shift in the line energy of the Fe XXVI line during both quiescence and outburst suggesting an absence of any Doppler shift in these systems. Hellier & Mukai (2004) find that the Fe XXVI line is, in general, broadened by 1000 km s-1 in MCVs. For non-magnetic CVs, only U Gem shows a significant broadening in Fe XXVI line by 1400 km s-1 in quiescence.
Hellier & Mukai (2004) also reported that the two intermediate polars (IPs), AO Psc and EX Hya, have a much stronger resonance line of the Fe XXV triplet than is observed in the polar AM Her. In our study, this line is also found to be strong like that observed in the two IPs in which the accretion takes place via a partial or truncated disk. The common thread between the IPs and DNe is an accretion disk that is absent in polars. This might provide some clue for the dependence of the Fe XXV resonance line strength on the presence of accretion disk or the strength of magnetic field. Observations of a large number of CVs with a high resolution X-ray instrument can help to investigate this further.
Ezuka & Ishida (1999) find that the reflection of hard X-rays from the white dwarf generally makes a significant contribution to the fluorescent iron line in MCVs having a weak line-of-sight absorber (N1022 cm-2). This suggests that in these systems the production mechanism of the fluorescent Fe line is independent of the magnetic nature of the system. Hellier & Mukai (2004) have detected a red wing of the fluorescent Fe line extending to 6.33 keV in the IP GK Per. This broadening corresponds to a Doppler shift of up to 3700 km s-1. They suggest that this arises from the pre-shock material that is free-falling onto the white dwarf. We have detected a symmetrically broadened fluorescent Fe line in V603 Aql with a broadening of 1700 km s-1, which is probably due to Doppler broadening or Compton scattering of material in the accretion disk. The red-shift of up to 2300 km s-1 detected in SS Cyg during outburst is attributed to the wind flowing away from the system unlike the free-falling material in MCVs.
5 Summary
-
1.
The presence of a strong Fe XXV triplet is a common feature in the hard X-ray spectra of non-magnetic CVs irrespective of their intensity state. During the quiescent state the component is stronger than the and components indicating a temperature of 3 K for emitting plasma.
-
2.
The G-ratio is close to unity for all sources indicating the presence of collisionally ionized plasma in these sources during quiescence. The measured values of R-ratio for Fe XXV from the present HEG data do not allow us to constrain the plasma densities in the sources studied here.
-
3.
During outburst the , and components of the He-like line in U Gem are found to be significantly broadened with a velocity of 2460 km s-1. The presence of high velocity material (1200 km s-1) in the form of a Keplerian disk or wind flowing away from the system is indicated for SS Cyg during an outburst confirming the previous report by Mauche (2004) using the Chandra LETG data.
-
4.
For SS Cyg the Fe XXVI/Fe XXV line ratio provides a higher ionization temperature during quiescence than in the outburst state. This supports other observations that show the X-ray spectrum of SS Cyg to be softer in outburst than quiescence (McGowan, Priedhorsky, & Trudolyubov, 2004, and references therein).
-
5.
A study of Fe XXV resonance line in a large sample of CVs including polars, IPs and DNe may provide some clue as to the dependence of the resonance line strength on the presence of an accretion disk or the magnetic nature of the system.
-
6.
The presence of a prominent fluorescent iron line in V603 Aql, V426 Oph and SS Cyg indicates the presence of significant reflection in these systems during quiescence. V603 Aql shows a significantly broadened fluorescent Fe line corresponding to a velocity of 1730 km s-1. For SS Cyg, the fluorescent Fe line is red-shifted with energies of 6.350.02 and 6.350.01 keV, during the two outburst observations done on 2000 September 12 and 14 respectively, indicating a velocity of about 2300 and 2300 km s-1 for fluorescent material.
-
7.
The EW of the fluorescent Fe line during quiescence in all sources is consistent with reflection from the white dwarf surface that subtends an angle of about 2 at the X-ray source.
References
- Arnaud (1996) Arnaud, K. A. 1996, in ASP Conf. Ser. 101, Astronomical Data Analysis Software and Systems V, ed. G. Jacoby & J. Barnes (San Francisco: ASP), 17
- Baskill, Wheatley, & Osborne (2005) Baskill, D. S., Wheatley, P. J., & Osborne, J. P. 2005, MNRAS, 357, 626
- Bautista & Kallman (2000) Bautista, M. A. & Kallman, T. R. 2000, ApJ, 544, 581
- Cassinelli et al. (2001) Cassinelli, J. P., Miller, M. A., Waldron, W. L., MacFarlane, J. J., & Cohen, D. H. 2001, ApJ, 554, L55
- Done & Osborne (1997) Done, C., & Osborne, J. P. 1997, MNRAS, 288, 649
- Ezuka & Ishida (1999) Ezuka, H., & Ishida, M. 1999, ApJS, 120, 277
- Garmire et al. (2003) Garmire, G. P., Bautz, M. W., Ford, P. G., Nousek, J. A., & Ricker, G. R., Jr. 2003, SPIE, 4851, 28
- George & Fabian (1991) George, I. M., & Fabian, A. C. 1991, MNRAS, 249, 352
- Hakala et al. (2004) Hakala, P., Ramsay, G., Wheatley, P., Harlaftis, E. T., Papadimitriou, C. 2004, A&A, 420, 273
- Hellier & Mukai (2004) Hellier, C., & Mukai, K. 2004, MNRAS, 352, 1037
- Homer et al. (2004) Homer, L., Szkody, P., Raymond, J. C., Fried, R. E., Hoard, D. W., Hawley, S. L., Wolfe, M. A., Tramposch, J. N., & Yirak, K. T. 2004, ApJ, 610, 991
- Kahn et al. (2001) Kahn, S. M., et al. 2001, A&A, 365, L312
- Lasota et al. (2001) Lasota, J. P. 2001, New Astron. Rev., 45, 449
- Markert et al. (1994) Markert, T. H., Canizares, C. R., Dewey, D., McGuirk, M., Pak, C. S., & Schattenburg, M. L. 1994, Proc. SPIE, 2280, 168
- Mauche (2004) Mauche, C. 2004, ApJ, 610, 422
- Mauche et al. (2005) Mauche, C. W., Wheatley, P. J., Long, K. S., Raymond, J. C., & Szkody, P. 2005, ASP Conf. series, vol. 330, 355, Eds: J. M. Hameury & J. P. Lasota
- McGowan, Priedhorsky, & Trudolyubov (2004) McGowan, K. E., Priedhorsky, W. C., & Trudolyubov, S. P. 2004, ApJ, 601, 1100
- Mewe et al. (1985) Mewe, R., Gronenschild, E. H. B. M., & van den Oord, G. H. J. 1985, A&AS, 62, 197
- Mukai & Shiokawa (1993) Mukai, K., & Shiokawa, K. 1993, ApJ, 418, 863
- Mukai et al. (2003) Mukai, K., Kinkhabwala, A., Peterson, J. R., Kahn, S. M., & Paerels, F. 2003, ApJ, 586, L77
- Mukai & Orio (2005) Mukai, K., & Orio, M. 2005, ApJ, 622, 602
- Nousek & Shue (1989) Nousek, J. A., & Shue, D. R. 1989, ApJ, 342, 1207
- Oelgoetz & Pradhan (2001) Oelgoetz, J., & Pradhan, A. K. 2001, MNRAS, 327, L42
- Pandel et al. (2005) Pandel, D., Cordova, F. A., Mason, K. O., & Priedhorsky, W. C. 2005, ApJ, 626, 396
- Perna et al. (2003) Perna, R., McDowell, J., Menou, K., Raymond, J., & Medvedev, M. V. 2003, ApJ, 598, 545
- Phillips et al. (1983) Phillips, M. M., Baldwin, J. A., Atwood, B., & Carswell, R. F. 1983, ApJ, 274, 558
- Prinja & Rosen (1995) Prinja, R. K., & Rosen, S. R. 1995, MNRAS, 273, 461
- Ramsay et al. (2001) Ramsay, G., Cordova, F., Cottam, J., Mason, K., Osborne, J., Pandel, D., Poole, T., & Wheatley, P. 2001, A&A, 365, L294
- Szkody et al. (2002) Szkody, P., Nishikida, K., Raymond, J. C., Seth, A., Hoard, D. W., Long, K., & Sion, E. M. 2002, ApJ, 574, 942
- Warner (1995) Warner, B. 1995, Cataclysmic Variables (Cambridge: Cambridge University Press)
- Wheatley, Mauche, & Mattei (2003) Wheatley, P. J., Mauche, C. W., and Mattei, J. A. 2003, MNRAS, 345, 49
- Wiesskopf et al. (2002) Wiesskopf, M. C., Brinkman, B., Canizares, C., Garmire, G., Murray, S., & Van Speybroeck, L. P. 2002, PASP, 114, 1


| source | Obs-id | Exposure | Date | State |
|---|---|---|---|---|
| (ksec) | ||||
| SS Cyg | 646 | 48 | 2000 August 24 | Quiescence |
| 2307 | 36 | 2000 September 12 | Outburst | |
| 648 | 60 | 2000 September 14 | Outburst | |
| U Gem | 647 | 96 | 2000 November 29 | Quiescence |
| 3767 | 62 | 2002 December 26 | Outburst | |
| V603 Aql | 1901 | 64 | 2001 April 19 | Quiescence |
| V426 Oph | 2671 | 45 | 2002 May 30 | Quiescence |
| WX Hyi | 2670 | 50 | 2002 July 28 | Quiescence |
| 3721 | 50 | 2002 July 25 | Quiescence | |
| SU UMa | 2680 | 49 | 2002 April 13 | Quiescence |
| 3478 | 23 | 2002 April 12 | Quiescence |
| source | Equivalent width (eV) | Line Flux ( ph cm-2 s-1) | ||||||||
|---|---|---|---|---|---|---|---|---|---|---|
| fluorescent | He-like | H-like | fluorescent | He-like | H-like | |||||
| r | i | f | r | i | f | |||||
| Quiescent State | ||||||||||
| SS Cyg | 59 | 35 | 22 | 20 | 65 | 11.1 | 6.7 | 4.5 | 4.2 | 10.9 |
| U Gem | 46 | 134 | 38 | 124 | 181 | 0.7 | 2.2 | 0.7 | 2.0 | 2.6 |
| V603 Aql | 162 | 98 | 47 | 35 | 69 | 2.5 | 1.6 | 0.8 | 0.7 | 0.9 |
| V426 Oph | 39 | 90 | 59 | 48 | 136 | 2.6 | 6.2 | 4.4 | 3.6 | 8.3 |
| WX Hyi | 38 | 115 | 103 | 93 | 74 | 0.5 | 1.7 | 1.5 | 1.4 | 1.0 |
| WX Hyi | 55 | 285 | 18 | 81 | 71 | 1.0 | 3.8 | 0.3 | 1.4 | 1.1 |
| SU UMa | 23 | 139 | 201 | 24 | 0+52 | 0.2 | 0.9 | 1.2 | 0.2 | 0.4 |
| Outburst State | ||||||||||
| SS Cyg | 60 | 70 | 72 | 82 | 27 | 3.8 | 4.2 | 4.7 | 5.3 | 1.5 |
| SS Cyg | 68 | 99 | 60 | 65 | 27 | 3.0 | 4.2 | 3.0 | 3.1 | 1.2 |
| U Gem | 22 | 26 | 325 | 28 | 65 | 1.5 | 1.9 | 17.0 | 2.1 | 3.9 |
Note. — The errors are with 90% confidence interval for a single parameter (=2.706).
| source | G=(f+i)/r | R=f/i | Fe XXVI/XXV |
|---|---|---|---|
| Quiescent State | |||
| SS Cyg | 1.30 | 0.93 | 0.71 |
| U Gem | 1.23 | 2.86 | 0.53 |
| V603 Aql | 0.94 | 0.88 | 0.29 |
| V426 Oph | 1.29 | 0.82 | 0.58 |
| WX Hyi | 1.71 | 0.93 | 0.22 |
| WX Hyi | 0.45 | 4.67 | 0.20 |
| SU UMa | 1.55 | 0.17 | – |
| Outburst State | |||
| SS Cyg | 2.40 | 1.13 | 0.11 |
| SS Cyg | 1.45 | 1.03 | 0.12 |
| U Gem | 10 | 0.12 | 0.19 |
Note. — The errors are obtained by propagating the 90% confidence errors on line fluxes from Table 2.