Chandra Detection of Local Warm–Hot Gas Toward Markarian 279
Abstract
We report the Chandra detection of O VII K absorption at in the direction of the Seyfert 1 galaxy Mkn 279. The high velocity cloud Complex C lies along this line of sight, with H i 21-cm emission and O VI 1032Å absorption both observed at velocities of km s-1 relative to the local standard of rest. We present an improved method for placing limits on the Doppler parameter and column density of a medium when only one unresolved line can be measured; this method is applied to the O VII absorption seen here, indicating that the O VII Doppler parameter is inconsistent with that of any low–velocity (Galactic thick disk) or high–velocity O VI (O VIHV) component. Direct association of the O VII with the O VIHV is further ruled out by the high temperatures required to produce the observed O VIHV/O VII ratio and the significant velocity difference between the O VII and O VIHV lines. If the O VII absorption is associated with a very broad, undetected O VI component, then the absorption must be broadened by primarily nonthermal processes. The large velocity dispersion and possible slight redshift of the O VII absorption (as well as limits on the absorber’s temperature and density) may be indicative of a local intergalactic medium origin, though absorption from a hot, low–density Galactic corona cannot be ruled out.
1 Introduction
The advent of high–resolution X-ray spectroscopy with the Chandra X-ray Observatory and XMM–Newton, as well as far–ultraviolet spectroscopy with the Far Ultraviolet Spectroscopic Explorer (FUSE) and the Space Telescope Imaging Spectrograph on HST, has shed a great deal of light on the local warm–hot intergalactic medium (WHIM). Hydrodynamic simulations predict that this tenuous web of K gas should contain about half of the baryons in the nearby universe (Cen & Ostriker, 1999; Davé et al., 2001), appearing as a forest of highly ionized metal absorption lines in high signal–to–noise X-ray spectra of background sources (Hellsten et al., 1998; Perna & Loeb, 1998). Indeed, recent Chandra grating observations of this “X-ray forest” toward bright blazars have confirmed these predictions (Nicastro et al., 2005a, b, Nicastro et al., in preparation).
In addition to the intervening absorption systems, similar metal absorption lines (primarily O VII) are observed at redshifts consistent with zero toward several background quasars, such as Mrk 421 (Williams et al., 2005, hereafter W05), PKS 2155-304 (Nicastro et al., 2002; Fang et al., 2002, Williams et al., in preparation), and 3C 273 (Fang et al., 2003); larger archival analyses have also been performed for various instruments (e.g. McKernan et al., 2004; Fang et al., 2006). This nearby absorption presents a unique puzzle: since no morphological or distance information is known about the X-ray absorption (other than limited spatial data along the very few quasar pencil beams where it has been detected), it is still unknown whether this warm–hot gas originates within the Galactic halo or rather is part of the Local Group WHIM, or a combination of the two. While some O VII absorption has been detected within 50 kpc of the Galaxy (Wang et al., 2005), this is unlikely to be uniformly distributed. Additionally, constrained simulations of the Local Supercluster predict high column densities of O VI and O VII in some directions (Kravtsov et al., 2002). It is thus likely that Galactic and extragalactic phenomena both contribute to the local X-ray absorption, but the question of which sightlines are dominated by which phenomena is, by and large, unanswered.
Further complicating the issue is the presence of other gaseous components of unknown origin. H I high–velocity clouds (HVCs) have a velocity distribution inconsistent with the Galactic rotation and therefore are thought to be either neutral gas high in the Galactic halo (perhaps from tidally stripped dwarf galaxies) or cooling, infalling gas from the surrounding IGM. Along many lines of sight studied with FUSE, high–velocity O VI absorption lines (O VIHV) at velocities coincident with the H I HVCs are seen, while in some other directions O VIHV is present even in the absence of any significant H I 21-cm emission at the same velocity (Sembach et al., 2003). The question of whether these isolated O VI HVCs arise in an extended, hot Galactic corona or at Local Group scales – and their relation to the X-ray absorption lines – is a subject of continuing debate.
There is some evidence for such a Galactic corona (discussed in detail by Sembach, 2003, and references therein); indeed, a significant fraction of HVCs appear to exhibit low–ionization absorption lines (such as C ii–iv and Si ii–iv), unlikely to arise in a low–density, warm–hot photoionized medium (Collins et al., 2005). However, Nicastro et al. (2003) showed that the velocity distribution of these unassociated O VIHV clouds is minimized in the Local Group rest frame, indicating that their origin is extragalactic. Additionally, W05 found that the O VIHV toward Mrk 421 cannot be associated with the O VII along that sightline (assuming a single temperature/density phase). However, the links between the O VIHV, H I HVCs, and local O VII/O VIII absorption in the context of the Galactic corona and local WHIM are to a large degree unknown. Determining the origin of these components, and the relations between them, is a crucial step in our understanding of the ongoing process of galaxy formation
The nearby (), X-ray bright Seyfert galaxy Mrk 279 lies in the direction of the H I HVC Complex C, thus providing a particularly valuable background source that can be used to study these gaseous components. Here we report on our analysis of deep Chandra and FUSE spectra of this object, the detected UV and X-ray absorption, and the implications for gas in the Galaxy and Local Group.
2 Data Reduction and Measurements
2.1 Chandra
Seven observations of Mrk 279 taken with the Chandra High Resolution Camera Spectroscopic array (HRC-S) and Low Energy Transmission Grating (LETG), all taken in May 2003 and totaling 340 ks of exposure time, were available in the Chandra archive. Each of these data sets was processed, and instrument response files built, using the standard data reduction threads for HRC-S/LETG111Available at http://cxc.harvard.edu/threads/gspec.html with version 3.3 of the Chandra Interactive Analysis of Observations (CIAO) software and Chandra Calibration Database version 3.2.0. Since the HRC-S does not have sufficient energy resolution to distinguish LETG spectral orders, higher orders can increase the apparent flux at long wavelengths222See http://cxc.harvard.edu/ciao/threads/hrcsletg_orders/. This effect was mitigated by including response files for orders through in our analysis; the inclusion of orders beyond these had an insignificant effect on the computed instrumental response.
The seven observations were coadded for a final (unbinned, with Å) signal–to–noise ratio of near 22Å. We used the spectral fitting program Sherpa to fit a power law and foreground Galactic absorption to the spectrum over Å band (excluding the Å and Å chip gap regions). The relative Galactic abundances of carbon, nitrogen, oxygen, and neon were left as free parameters in order to produce a better fit around the absorption edges. A power–law slope of and equivalent hydrogen column density of cm-2 is derived, agreeing reasonably well with the Elvis, Wilkes, & Lockman (1989) value of cm-2 near this sightline. The best–fit abundances of N and Ne were approximately zero, oxygen equal to the solar value, and carbon 0.15 solar, though we re–emphasize that these do not reflect actual Galactic abundances but rather provide a better fit near absorption edges where the calibration is uncertain. A few weak, broad residuals remained afterward, probably due to calibration uncertainties or source variability; these were corrected by including four broad Gaussians in the source model (analogous to the technique described in Nicastro et al., 2005a).
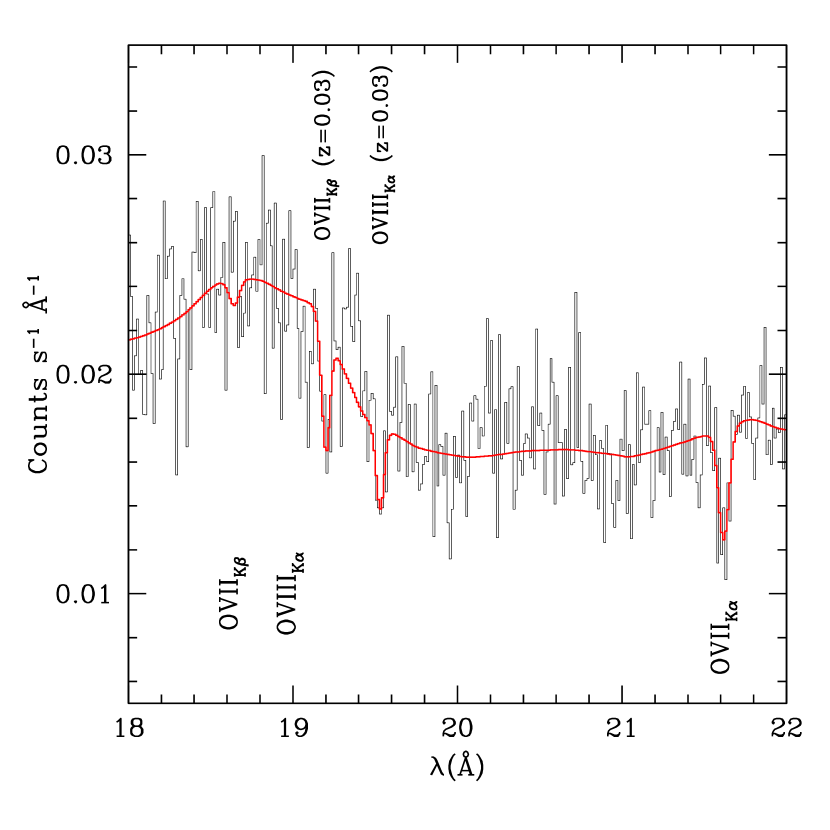
Once the continuum was established, we visually searched the spectrum in Å windows for narrow (unresolved) absorption lines, fitting each one with a Gaussian. Although several strong lines such as C VI, O VII, and N VII are apparent at the AGN redshift (), at ( km s-1) only O VII K is unambiguously detected at Å ( km s-1) with an equivalent width of mÅ. Upper limits were measured for the O VII K line as well as several other ionic species of interest; these measurements are listed in Table 1. Although they are included in the model to improve consistency, the absorption intrinsic to Mrk 279 and the Galactic interstellar O I lines are not the focus of this work and will not be discussed further. The resulting fit and residuals are shown in Figure 1; with a reduced value of 0.89, the model appears to fit the data quite well.
The Chandra HRC-S/LETG wavelength scale is uncertain for several reasons, primarily because of non–linearities resulting from bad amplifiers on the HRC-S detector333See http://cxc.harvard.edu/cal/Letg/Corrlam/. While the newly–released CIAO 3.3 software includes a routine to correct these non–linearities and has reduced the dispersion in wavelength errors to mÅ at short wavelengths in calibration spectra, this routine is in the early stages of development and wavelengths of individual emission and absorption lines may still be systematically skewed. However, any systematic wavelength errors should not vary between observations as long as the telescope pointing is nominal. Furthermore, while serious wavelength errors are known to occur around 18Å, no bad amplifiers are expected to significantly affect the dispersion relation near 21.6Å (J. J. Drake and N. Brickhouse, private communication).
To check the absolute wavelength scale near the O VII line, we retrieved the nearest HRC–S/LETG calibration observation of the X-ray bright star Capella (observation 3675, taken on 2003 September 28) from the Chandra archive and reprocessed the data in exactly the same manner as the Mrk 279 data. The wavelength of the strong O VII emission line was found to be Å or km s-1, which is consistent with the km s-1 radial velocity of Capella as listed in the SIMBAD database444http://simbad.u-strasbg.fr/sim-fid.pl. As a separate check, we reduced the Mrk 279 Chandra data both with and without the wavelength correction routine; the difference in the measured O VII wavelength between the two was only 4 mÅ, much lower than the statistical error on the line position. Thus, although the possibility of systematic wavelength errors must be kept in mind, it appears as though such effects are insignificant compared to the statistical error on the measured O VII wavelength.
2.2 FUSE
Mrk 279 was observed four times with FUSE between December 1999 and May 2003 with a total exposure time of 224 ks; all calibrated data from these observations were obtained through the Multimission Archive at STScI website.555http://archive.stsci.edu/ To account for small shifts in the FUSE wavelength scale during the observations, each of the constituent exposures was cross–correlated over the Å range and the relative positions of strong absorption lines were checked by eye. The data from 18 May 2002 were not of sufficient quality to reliably perform this wavelength calibration and were thus excluded. The coadded, wavelength-shifted spectra from each observation were then cross–correlated with each other, scaled so that their continuum intensities matched, combined and rebinned by five pixels ( km s-1) to produce a final spectrum with near 1032Å and an effective exposure time of 177 ks.
To account for possible systematic offsets, the absolute wavelength scale of the final spectrum was corrected following the method employed by W05: the Galactic Si II and Ar I absorption profiles were fit with multiple Gaussian components and the column density–weighted average velocities calculated. These were found to be km s-1 and km s-1 respectively, while the average velocity of the Wakker et al. (2003) multi–component fit to the Galactic H I toward the Mrk 279 sightline is km s-1. Since these low–ionization lines are expected to co-exist with the H I, a km s-1 shift was applied to the wavelength scale of the FUSE spectrum.
The final combined and calibrated FUSE spectrum shows strong O VI absorption from the Galactic thick disk at and a weaker O VI high velocity component (O VIHV) at km s-1(Figure 2). Each of these features was initially modeled with a single Gaussian; however, this provided a poor fit for the thick–disk absorption due to an asymmetric blue wing on the line profile; thus, the Galactic O VI was instead fit with a broad and a narrow Gaussian component (hereafter denoted O VIB and O VIN respectively). Measured line parameters are also listed in Table 1; note that the velocity of the O VIHV is tightly constrained by this fit as km s-1, which is inconsistent at the level with the O VII velocity of km s-1 (assuming the HRC-S/LETG wavelength scale is correct), indicating that these two components almost certainly are not related.
The total equivalent widths of the O VI Galactic and high–velocity components are mÅ and mÅ respectively, in agreement within the estimated systematic errors of the Wakker et al. (2003) measurements of mÅ and mÅ (where the first and second error values are statistical and systematic, respectively). As was the case for the Mrk 421 sightline (W05), our fitted GalacticHVC O VI equivalent width agrees quite well with the Wakker et al. (2003) direct–integration value but our measurement of the O VIHV strength is somewhat lower and Galactic absorption higher; this is most likely because our method better accounts for blending between the Galactic and high–velocity O VI in cases where distinct absorption components are evident (as discussed in more detail in W05).
3 Analysis
3.1 Doppler Parameters and Column Densities
In order to derive physical properties of the observed absorption, it is necessary to first convert the measured equivalent widths into ionic column densities . This requires knowledge of the Doppler parameter , since at a fixed column density decreases for lower values of . However, the nominal LETG resolution of Å ( km s-1 at 21Å) precludes direct measurement of the O VII line width. A method similar to that employed in W05 is thus used to place limits on the O VII Doppler parameter using the measured equivalent width of the O VII K line and the upper limit on O VII K. Equivalent widths and FWHM values for each transition were calculated (assuming a Voigt absorption profile) over a grid of and , and the tracks in the plane consistent with each measured equivalent width limit are plotted in Figure 3.
Determining the ranges of and for which the measured column densities are consistent with each other (i.e. the area over which the K and K tracks “overlap”) is more complicated. In the Mrk 421 data the first three lines in the O VII K–series were individually detected at confidence. In that case, the differences between pairs of predicted values (and the joint errors on the differences) were calculable, allowing easy determination of the region over which the three transitions predicted consistent and values. In the case of Mrk 279, however, this same method cannot be used because while the O VII K line has been detected, only an upper limit is available for the K line.
However, since the absorption line properties for various column densities and Doppler parameters are known, limits on these quantities can be determined using the Chandra spectrum itself. For each point in the plane, O VII K and K absorption lines with the calculated and FWHM values were added to the best–fit continuum model, and the statistic calculated using the “goodness” command in Sherpa. Over the calculated parameter ranges, the minimum point was on the km s-1 boundary. Since the K line was completely undetected (with a best–fit amplitude near zero), the value asymptotically approaches a minimum as increases. We thus assumed a minimum value from a fit with a fixed unsaturated line ratio () and calculated for every point. The 95% confidence interval () determined with this method is shown in Figure 3; at this confidence level all Doppler parameters between km s-1 are ruled out.
Although these curve–of–growth diagnostics can in principle also be applied to the UV O VI absorption doublet, it is typically more difficult because few Galactic O VI sightlines are sufficiently saturated to significantly affect the doublet line ratio; additionally, the close proximity of the 1037Å line to other Galactic absorption features makes deblending difficult (W05; Wakker et al., 2003). However, since the O VI line is fully resolved in the FUSE spectrum, the measured line width is highly sensitive to while the equivalent width traces . While decreases for a saturated line of a fixed column density, the observed FWHM increases from the unsaturated value of . To account for these saturation effects, we computed O VI equivalent widths and FWHM values over a grid of and . Regions for which the FWHM and measurements are consistent with predicted values are shown for both O VIB and O VIN in Figure 4; since the FWHM and regions overlap nearly orthogonally, strong constraints are placed on the column density and velocity dispersion of the O VI–bearing gas. None of the O VI broad, narrow, or high–velocity components are significantly saturated, with derived Doppler parameters of km s-1, km s-1, and km s-1 ( errors) respectively.
All O VI component Doppler parameters are inconsistent with the upper allowed range ( km s-1) determined from the O VII ratios, and only the O VIHV is marginally consistent with the lower O VII range ( km s-1). This indicates that the majority of the O VI cannot originate in the same phase as the observed O VII absorption. Although at first glance it appears possible for the O VIHV and O VII to coexist, the velocity separation of the O VII and O VIHV (as discussed in §2.2) makes this interpretation unlikely; additionally, the large O VII/O VIHV column density ratio (; Figure 3) requires high temperatures which are in turn ruled out by the low value (discussed further in the following section). It is also possible that the thick–disk O VI consists of only one component with a non–Gaussian shape, in which case the actual velocity dispersion could be larger. Approximating the low–velocity O VI with a single Gaussian component yields km s-1— barely consistent with the 95% lower limit on the O VII Doppler parameter. We thus conclude that the O VII most likely does not coexist with any of the measured O VI components.
3.2 Temperature and Density Diagnostics
The derived ionic column density ratios (and upper limits thereupon) can be used to determine the physical state of the absorbing medium. Since the extent, and hence the density, of the absorber is unknown, we cannot assume a priori whether or not photoionization from the Galactic or extragalactic background plays a significant role in the ionization balance of the medium. Specifically, in a higher–density, hot medium (such as a Galactic corona), collisional ionization would be the dominant process by far, while in a low–density WHIM scenario photoionization is expected to play a significant role. Including the effects of photoionization along with collisional ionization is crucial in order to most accurately determine the state of the gas (cf. Nicastro et al., 2002; Mathur et al., 2003, W05).
We used version 05.07 of the ionization balance code Cloudy (Ferland et al., 1998) to calculate ionic abundances for all measured elements over a grid of K and ionization parameters to (where is the ratio of the number densities of ionizing photons and electrons in the plasma), with a step size of 0.1 dex in both and . The Sternberg et al. (2002) fit to the metagalactic radiation field was assumed; this is based on the observed background from infrared to X-rays (except for the unobservable radiation near the Lyman limit, which is taken from the theoretical model of Haardt & Madau (1996)). The normalization of this background corresponds to electron densities of cm-3 over the calculated range — i.e., .
As equivalent widths of different transitions from the same ion can be used to place limits on the absorber’s velocity dispersion and column density (§3.1), any measured column density ratio defines a track in the plane. The overlap between two or more such tracks (derived from different ion ratios) can then be used to place constraints on the gas temperature and density. Although in principle the ratio between any two ionic species can be employed, column density ratios between different ions of the same atomic species are metallicity–independent and hence produce the strongest diagnostics. Since only O VII is strongly detected at in the Mrk 279 Chandra spectrum and O VI, O VII, and O VIII together provide strong temperature and density constraints (Mathur et al., 2003), we focus primarily on these ions.
A limit on can be easily determined from the O VIII equivalent width upper limit and assuming the O VII Doppler parameter; however, including the O VI column density is less straightforward due to the presence of multiple components. Since the O VII Doppler parameter is inconsistent with both of the broad O VI components, there are two likely possibilities: (1) the O VII Doppler parameter is actually in the lower range ( km s-1) and the O VII is associated with the O VIHV, or (2) the O VI absorption produced by the O VII–bearing gas is too weak to be detected in our FUSE spectrum, so only an upper limit on can be used in this analysis. The former case is highly unlikely — not only is the centroid of the O VII line inconsistent with the velocity of the O VIHV, but such a low Doppler parameter requires extremely high O VII column densities ( cm-2). This in turn produces an extremely large ratio which requires high temperatures ( K, the upper limit of our calculation). Since the O VIHV Doppler parameter implies a maximum temperature of K, such an association appears impossible.
If, instead, the associated O VI absorption is too weak to be detected, then this absorption most likely takes the form of a broad ( km s-1, from the O VII limit) absorption line superposed on the O VI. Such a line was included in the FUSE spectrum fit and upper limits calculated for a velocity dispersions of 100 and 200 km s-1. The temperatures and densities consistent with the O VIII/O VII and O VI/O VII upper limits for both values of are shown in Figure 5. The O VIII/O VII ratio sets an upper limit of and a minimum density of cm-3 in both cases. For km s-1 the limits set by are inconsistent with the ratio, but for km s-1 the contours begin to overlap with and . Thus, if the O VII is associated with a broad undetected O VI component, a large Doppler parameter is required to reconcile the oxygen ion ratios. This, along with the inferred temperature and density limits, are both consistent with expectations for the local WHIM, though the large velocity dispersion compared to the upper temperature limit derived from the O VIII/O VII ratio indicates that the line broadening is primarily nonthermal.
Although a similar analysis can be performed with the N VII/O VII and Ne IX/O VII ratios, the derived limits are in all cases weaker than those set by the O VIII/O VII upper limit and have been excluded from Figure 5 for the sake of clarity.
3.3 The AGN Warm Absorber
The Chandra spectrum of Mrk 279 shows strong O VII, O VIII, C VI, and N VII absorption at a redshift consistent with the AGN (). It is thus possible that the O VII absorption line at is contaminated, either by O VII outflowing from Mrk 279 or from another absorption line at . The former scenario is probably not the case since this would require both an unlikely coincidence of the outflow velocity with the AGN redshift ( km s-1). To check the latter case, we used the PHASE model (described by Krongold et al., 2003) to fit the intrinsic absorption in a self–consistent manner. With this fit we found that the redshifted N VII K line falls at 21.5Å, near the O VII K rest wavelength but well outside the line profile, and is weak enough that its effect on the O VII equivalent width measurement is most likely negligible. No other warm–absorber lines are expected near 21.6Å for outflow velocities between zero and 9000 km s-1; thus, the O VII measurement is unlikely to be contaminated by any lines from the warm absorber. The details of the warm absorber model are the subject of a forthcoming paper (D. L. Fields et al., in preparation) and will not be discussed further here.
4 Discussion
4.1 Comparison to the Mrk 421 Sightline
Although the quality of the Mrk 279 Chandra spectrum is far lower than that of Mrk 421 (W05), the differences between the local absorption seen along the two lines of sight are striking. While the velocity of the Mrk 421 O VII absorption is near zero and thus cannot be distinguished from the low– and high–velocity O VI seen in the spectrum, the Mrk 279 O VII and O VIHV velocities are significantly different. Furthermore, the derived Doppler parameters of the O VII absorption along these sightlines — km s-1 and km s-1 for Mrk 421 and Mrk 279 respectively — differ substantially. In both cases association of the O VII with any O VI component is ruled out and the derived temperature, density, and column density limits are consistent with each other (though with large errors). However, the strong discrepancy between the velocity dispersions of the two absorbers suggests that their origins may differ. Such a difference in origin may not be surprising, given the large () separation between the two sightlines.
4.2 Origin of the Absorption
The unique properties of the absorption components along the Mrk 279 sightline provide some tantalizing clues as to the origin of the local host gas. Taking all components into account, this sightline exhibits high negative–velocity H I emission (Complex C), O VI absorption at a similar velocity, and broad, possibly redshifted O VII absorption. If Complex C is indeed nearby WHIM gas that has cooled and is falling onto the Galaxy (e.g. Miville–Deschênes et al., 2005), then its presence could indicate the presence of a large–scale WHIM filament in the same direction. In this interpretation, the large nonthermal Doppler parameter of the O VII absorption could be a result of velocity shear, due either to the Hubble expansion over a scale of Mpc (with a corresponding density of cm-3, assuming km s-1, pure Hubble broadening and a metallicity of solar) or the natural velocity distribution expected from infalling gas, or a combination of both. The negative–velocity H I would then be gas that has “broken off” from the filament and is now falling onto the Galaxy, with the O VI at the same velocity representing the cooling component of the gas. The velocity of the local standard of rest is approximately perpendicular to the CMB rest frame in this direction, so no significant additional velocity shifts are expected in an IGM scenario.
Such a picture is consistent with the general picture of galaxy formation and accretion of gas onto galaxies from the IGM, and the temperatures and densities inferred from the X-ray absorption are consistent with those expected from the WHIM. However, unlike the Mrk 421 sightline, the simulations of Kravtsov et al. (2002) do not predict high column densities of O VII in this direction (though this may be due to the limited resolution of the simulations). Furthermore, aside from Complex C there are no known structures in this direction that might indicate the presence of a local filament — Wakker et al. (2003) note that the Canes Venatici Galaxy Grouping is centered on this sightline at km s-1, but this is far higher than the velocity of the O VII absorption.
Given these caveats and the large uncertainties on the X-ray measurements (indeed, only one absorption line has been strongly detected), the absorption could also originate locally in hot Galactic halo or coronal gas. As discussed previously, such an origin would require the O VII to be a completely separate component from any of the other observed components (H I, low– and high–velocity O VI) along this line of sight. Of course, there is also the possibility that the O VII absorption actually consists of multiple unresolved components, in which case a multiphase solution may reconcile the discrepancy with the O VI absorption. All line ratio calculations were performed under the assumption of ionization equilibrium, so nonequilibrium scenarios could provide substantively different predictions as well. More detailed modeling and simulations of both the Galactic and IGM gas distributions will be necessary to determine which scenario is most likely, and most consistent with the data.
5 Conclusions
Long–duration Chandra grating observations of the bright AGN Mrk 279 reveal the presence of strong O VII K absorption at a redshift consistent with zero. A FUSE spectrum of the same source shows several additional O VI components at velocities near zero. Through kinematic, curve–of–growth, and ionization balance modeling, we conclude the following:
-
1.
A direct analysis of the Chandra spectrum coupled with absorption line models constrains the Doppler parameter of the O VII absorption to be km s-1 and km s-1. This latter range is unlikely due to the extremely high O VII column densities required to produce the strong absorption feature.
-
2.
The O VII Doppler parameter limits are inconsistent with the measured values for any of the O VI absorption components. Additionally, the centroid of the O VII K line is inconsistent (at the level) with that of the O VIHV, indicating that the O VII is not associated with any local O VI component.
-
3.
If the O VII absorption is associated with a broad, undetected O VI absorption line, then a large Doppler parameter ( km s-1) is required to provide a single–phase solution for the O VI, O VII, and O VIII column densities. This large value of could be a result of either microturbulence, velocity shear from infalling gas, or broadening due to the Hubble expansion over a path length of a few Mpc. If the line is purely Hubble–broadened, at km s-1 a pathlength of 3 Mpc and density of is implied (assuming an oxygen abundance of 0.3 times solar).
-
4.
The large velocity dispersion, possible redshift, and lack of association with any Galactic absorption components (as well as the proximity of HVC Complex C) indicates that this X-ray absorption may be from a large–scale nearby WHIM filament; however, a Galactic corona origin cannot be ruled out with the current data.
References
- Cen & Ostriker (1999) Cen, R., & Ostriker, J. P. 1999, ApJ, 514, 1
- Collins et al. (2005) Collins, J. A., Shull, J. M., & Giroux, M. L. 2005, ApJ, 623, 196
- Davé et al. (2001) Davé, R., et al. 2001, ApJ, 552, 473
- Elvis, Wilkes, & Lockman (1989) Elvis, M., Wilkes, B. J., & Lockman, F. J. 1989, AJ, 97, 777
- Fang et al. (2002) Fang, T., Marshall, H. L., Lee, J. C., Davis, D. S., & Canizares, C. R. 2002, ApJ, 572, 127
- Fang et al. (2003) Fang, T., Sembach, K. R., & Canizares, C. R. 2003, ApJ, 586, 49
- Fang et al. (2006) Fang, T., McKee, C., Canizares, C., & Wolfire, M. 2006, ApJ, accepted (astro-ph/0511777)
- Ferland et al. (1998) Ferland, G. J., Korista, K. T., Verner, D. A., Ferguson, J. W., Kingdon, J. B., & Verner, E. M. 1998, PASP, 110, 761
- Haardt & Madau (1996) Haardt, F., & Madau, P. 1996, ApJ, 461, 20
- Hellsten et al. (1998) Hellsten, U., Gnedin, N. Y., & Miralda–Escudé, J. 1998, ApJ, 509, 56
- Kravtsov et al. (2002) Kravtsov, A. V., Klypin, A., & Hoffman, Y. 2002, ApJ, 571, 563
- Krongold et al. (2003) Krongold, Y., Nicastro, F., Brickhouse, N. S., Elvis, M., Liedahl, D. A., & Mathur, S. 2003, ApJ, 597, 832
- Mathur et al. (2003) Mathur, S., Weinberg, D., & Chen, X. 2003, ApJ, 582, 82
- McKernan et al. (2004) McKernan, B., Yaqoob, T., & Reynolds, C. S. 2004, ApJ, 617, 232
- Miville–Deschênes et al. (2005) Miville–Deschênes, M.-A., Boulanger, F., Reach, W. T., & Noriega–Crespo, A. 2005, ApJ, 631, L57
- Nicastro et al. (2002) Nicastro, F., et al. 2002, ApJ, 573, 157
- Nicastro et al. (2003) Nicastro, F., et al. 2003, Nature, 421, 719
- Nicastro et al. (2005a) Nicastro, F., et al. 2005, ApJ, 629, 700
- Nicastro et al. (2005b) Nicastro, F., et al. 2005, Nature, 433, 495
- Perna & Loeb (1998) Perna, R., & Loeb, A. 1998, ApJ, 503, 135
- Sembach (2003) Sembach, K. R. 2003, preprint (astro-ph/0311089)
- Sembach et al. (2003) Sembach, K. R., et al. 2003, ApJS, 146, 165
- Sternberg et al. (2002) Sternberg, A., McKee, C. F., & Wolfire, M. G. 2002, ApJS, 143, 419
- Verner et al. (1996) Verner, D. A., Verner, E. M., & Ferland, G. J. 1996, Atomic Data Nucl. Data Tables, 64, 1
- Wakker et al. (2003) Wakker, B. P., et al. 2003, ApJS, 146, 1
- Wang et al. (2005) Wang, Q. D., et al. 2005, ApJ, 635, 386
- Williams et al. (2005) Williams, R. J., et al. 2005, ApJ, 631, 856
| ID | aaRest wavelengths taken from Verner et al. (1996). | bbIn the cases where upper limits were found, the line positions were frozen to the rest wavelengths. | ccError bars are ; upper limits are . | c,dc,dfootnotemark: | Note | ||
|---|---|---|---|---|---|---|---|
| (Å) | (Å) | ( km s-1) | ( km s-1) | (mÅ) | |||
| X-ray: | |||||||
| O VII K | 21.602 | 1 | |||||
| O VII K | 18.629 | 18.629 | |||||
| O VIII K | 18.969 | 18.969 | |||||
| N VII K | 24.781 | 24.781 | |||||
| Ne IX K | 13.447 | 13.447 | |||||
| UV: | |||||||
| O VIB | 1031.926 | ||||||
| O VIN | 1031.926 | ||||||
| O VIHV | 1031.926 |
Note. — (1) The column density given here for the O VII K line is from the equivalent width measurement assuming km s-1, not the method described in §3.1.