1]Max-Planck-Institut für extraterrestrische Physik, D-84571 Garching, Germany 2]Harvard-Smithsonian Center for Astrophysics, 60 Garden Street, Cambridge, MA 02138
Extending the X-ray luminosity function of AGN to high redshift
Abstract
X-ray surveys of the extragalactic universe are now able to detect significant numbers of AGN out to high redshift (). We highlight some results from the Multiwavelength Project (ChaMP) to measure the X-ray luminosity function out to these early epochs. At , we show that the comoving space density of luminous () AGN has a behavior similar to the optical QSO luminosity function. With a newly compiled sample of AGN from ChaMP supplemented with those from additional surveys including the Deep fields, we present a preliminary measure of the luminosity function in the hard (2-8 keV) band. With 37 AGN at , we continue to see a decline in the space density at high redshift over a wider range in luminosity. We discuss the need to identify a larger sample of obscured AGN at high redshift to determine if an early epoch of hidden supermassive black hole growth occurred.
keywords:
galaxies: active — quasars: general — X-rays: galaxies — surveys1 Introduction
Our present understanding of the evolution of accreting supermassive black holes (SMBHs) over vast lengths of cosmic time comes from our measure of the luminosity function (i.e. the number undergoing a luminous phase within a specific comoving volume as a function of luminosity and redshift). Energy production through mass accretion onto SMBHs allows us to identify these sites that manifest themselves observationally as the familiar Active Galactic Nuclei (AGN). The luminosity function provides a key constraint to discern the underlying black hole mass and accretion rate distributions as a function of redshift from the observed global properties of AGN. An accurate assessment of these should elucidate the mechanisms (i.e. galaxy mergers and/or self-regulated growth) that are instrumental in their formation and evolution.
To date, an enormous effort has been undertaken to measure the luminosity function over the wide range in luminosity spanned by AGN out to high redshift. The bright end has been well established to by optical imaging surveys which primarily select QSOs using a multi-color criteria. The most dramatic feature found is the rise and fall of the comoving space density with peak activity at . With an unprecedented sample of 23,338 in the 2dF QSO Redshift Survey (2QZ), Croom et al. (2004) convincingly show a systematic decrease in luminosity (pure luminosity evolution; PLE) from to the present with very few bright QSOs in the local universe in compliance with past surveys (e.g. Boyle et al. 1988) . This fading of the luminous QSO population may be due to a decrease in the mass accretion rate (e.g. Cavaliere & Vittorini 2000) that appears to be linked to the evolution of the galaxies in which they reside (e.g. Croton et al. 2005; Di Matteo et al. 2005). The dropoff in the space density at (Warren, Hewett & Osmer 1994; Schmidt, Schneider & Gunn 1995; Fan et al. 2001; Wolf et al. 2003) may be indicative of either the detection of the onset of accretion onto young SMBHs or a high-redshift population that has been missed, possibly under a veil of obscuration (Fabian 1999). Excessive amounts of dust and gas may be ubiquitous in galaxies at early epochs as a result of enhanced galaxy formation.
It has been evident for quite some time that optical surveys miss a significant fraction of the AGN population. With the luminosity function being a steeply declining function of luminosity, optical techniques fail to find the majority of AGN due to spectroscopic dilution by host galaxy starlight. Though current techniques do show considerable improvement (Richards et al. 2005), they still fail to account for many low luminosity AGN selected by other means. Of equal significance, many AGN (e.g. Seyerts 2s) are underrepresented due to intrinsic dust obscuration and can only be adequately selected in the low redshift universe (e.g. Hao et al. 2005). As pertinent for this proceeding, current models and recent observations continue to attribute the bulk of the Cosmic X-ray Background (CXRB), the previously unresolved X-ray emission, to various types of obscured AGN (see Brandt & Hasinger 2005 for a review).
In the current era of and , X-ray surveys are detecting AGN and QSOs not only enshrouded by heavy obscuration ( cm-2) but those at high redshift () with statistics comparable to the optical surveys due to their superb resolving power between 0.5 to 10 keV. Previous observatories such as and were limited to the soft band which biases samples against absorption. With 1-2 Msec observations of the Deep Field North (CDF-N; Alexander et al. 2003), Deep Field South (CDF-S; Rosati et al. 2002) and Lockman Hole (Hasinger et al. 2001), of the hard (2-8 keV) CXRB has been resolved into point sources (Moretti et al. 2003). Many of the hardest serendipitous sources found so far arise in optically unremarkable bright galaxies (e.g. Barger et al. 2003b; Tozzi et al. 2001; Mainieri et al. 2002), which can contain very heavily obscured AGN.
A more robust luminosity dependent evolutionary scheme (see Miyaji, Hasinger & Schmidt 2000) has emerged in recent measures of the X-ray luminosity function (XLF). With the inclusion of absorbed AGN from , and surveys, lower luminosity AGN are clearly more prevalent at lower redshifts () than those of high luminosity that peak at . This behavior has been well substantiated using hard (2-8 keV) X-ray selected surveys of all types of AGN (Cowie et al. 2003; Barger et al. 2003a; Ueda et al. 2003; Fiore et al. 2003; Silverman et al. 2005b; La Franca et al. 2005). Using a highly complete soft (0.5-2.0 keV) band selected sample of over 1000 type 1 AGN, Hasinger, Miyaji & Schmidt (2005) show that this LDDE model accurately fits the data and shows a gradual shift of the peak in the comoving space density to lower redshifts with declining luminosity. In contrast to an evolution model in which SMBHs at low redshifts have sub-Eddington accretion rates, this behavior may be evidence for the growth of lower mass black holes emerging in an ’anti-hierarchical’ or “cosmic downsizing” fashion while accreting near their Eddington limit (e.g. Merloni et al. 2004; Marconi et al. 2004).
Even though this model is quite convincing, there are remaining uncertainties in our current measure of the XLF. (1) A significant number of X-ray sources in the recent surveys with and are not identified. (2) Barger et al. (2005) demonstrate that the XLF can be fit equally well by a PLE model at . These models only begin to substantially differ at low luminosities (i.e. below the break) and higher redshifts where statistics are quite low with most being provided by the CDF-N and CDF-S observations. New moderate depth surveys such as the Extended Chandra Deep Field South (E-CDF-S; Lehmer et al. 2005) and the Groth strip (Nandra et al. 2005) will provide additional AGN at these luminosities and redshifts but await optical followup. (3) Behavior of the AGN population at redshifts above the peak is still not accurately constrained. We have presented preliminary evidence (Silverman et al. 2005b) for a similar evolution of luminous X-ray selected QSOs to those found in the optical surveys with a decline in the comoving space density at but these AGN are mainly unobscured (type 1). In consideration of similar findings from radio selected surveys (Wall et al. 2005) that are sensitive to obscured QSOs, our current understanding of the evolution of high redshift AGN may endure.
In this proceeding, we present some results from the ChaMP that extend our knowledge of the X-ray luminosity function at high redshift. We also present some preliminary results from our effort to measure the X-ray luminosity function in the hard (intrinsic 2-8 keV) band. These new results will be further elaborated and expanded to include model fits using a maximum likelihood method in a near future ChaMP paper (Silverman et al. in preparation). To date, the limited numbers of X-ray selected AGN at have constrained current measures (Ueda et al. 2003; Barger et al. 2005) to lower redshifts. Due to the rarity of luminous high redshift AGN, such an endeavor requires a survey that covers a wide enough area to sufficient depths. The Multiwavelength Project (ChaMP) is carrying out such a survey. To improve the dynamic range ( coverage) of our sample, we include those AGN found in the CLASXS (Yang et al. 2004; Steffen et al. 2004), the deep surveys with Chandra (i.e. CDFN, CDFS) and XMM-Newton Lockman Hole (Hasinger et al. 2001) that have published catalogs with a fair sample of low luminosity () AGN out to .
Throughout this work, we assume H km s-1 Mpc-1, , and .
2 Chandra Multiwavelength Project (ChaMP)
The ChaMP (Kim et al. 2004a,b; Green et al. 2004) is carrying out an extragalactic X-ray survey encompassing 10 deg2 using serendipitous detections in archival Chandra fields. We have chosen 27 of the 135 ChaMP fields (2.0 deg2) for which we have acquired extensive followup optical imaging and spectroscopy. The deepest observations have exposure times that are sensitive to sources with erg cm-2 s-1. A full description of the ChaMP image reduction and analysis pipeline XPIPE can be found in Kim et al. 2004a. With our 4m MOSAIC optical imaging, we are able to identify counterparts to the Chandra sources down to (Green et al. 2004). We acquire optical imaging in three ( and ) Sloan Digital Sky Survey (SDSS) filters. Optical colors provide preliminary source classification and crude photometric redshifts. Optical spectroscopic followup currently focuses on identifying counterparts with for which spectra can be acquired on a 4-6m (i.e. MMT, Magellan, WIYN, CTIO Blanco) class telescope. To date, we have spectroscopically classified a sample of AGN.
3 Co-moving space density of luminous AGN
Using AGN from the ChaMP and those from additional surveys (CDF-N, CDF-S, ), we have measured the co-moving space density type 1, highly luminous (log ) AGN. In Figure 1, the space density rises from the present epoch to a peak at and then declines at (Silverman et al. 2005b). This behavior is similar to that of optically selected samples (Fan et al. 2001; Schmidt, Schneider & Gunn 1995; Wolf et al. 2003). These results are further substantated by the recent space densities of soft X-ray selected AGN reported by Hasinger, Miyaji & Schmidt (2005) and radio selected QSOs (Wall et al. 2005). These results all support the scenario that SMBHs are rapidly growing at the early epochs possibly related to enhanced galaxy formation.

4 Hard X-ray luminosity function
We are also generating a X-ray luminosity function in the 2-8 keV band to minimize the effect of intrinsic absorption. Similar to Barger et al. (2005), we use the observed soft X-ray band for AGN selection above a specific redshift, in our case this is where we measure the rest frame energies above 2 keV. The hard band (2-8 keV) detections are used to construct a low redshift () sample of AGN. This enables our selection to be less affected by absorbing columns up to cm-2. The use of the soft (0.5-2.0 keV) band allows us to take advantage of Chandra’s high collecting area at low energies to detect faint, high redshift AGN. We compile both a sample of AGN from 896 hard and 1232 soft selected X-ray sources found in 27 ChaMP fields. These fields were chosen to have a limiting flux ( erg s-1 cm-2) capable of detecting high redshift AGN, quality optical imaging in the band for the low redshift () sample, for the higher redshift sample, and a substantial amount of optical spectroscopic followup. We further restrict our hard band catalog to those with and the soft band sources to since our spectroscopic followup campaign has provided a significant number of spectroscopic redshifts brighter than these magnitude limits. To construct a pure AGN sample, we require the rest frame 2.0–8.0 keV luminosity (uncorrected for intrinsic absorption) to exceed 1042 erg s-1. These selection criteria yield a sample of 360 AGN (Figure 2) from the ChaMP with 18 at that represents half of the known X-ray selected AGN at high redshift.
4.1 Covering the luminosity-redshift plane
We supplement the ChaMP AGN with those from the following hard X-ray surveys to measure the XLF over the wide range of luminosity and redshift spanned by AGN: Deep Field North (CDF-N; Alexander et al. 2003, Barger et al. 2003b), Deep Field South (CDF-S; Giacconi et al. 2002; Szokoly et al. 2004; Zheng et al. 2004), Large Area Synoptic X-ray Survey (CLASXS; Yang et al. 2004, Steffen et al. 2004), Lockman Hole (Brunner et al. in preparation), ASCA Medium Sensitivity Survey (AMSSn; Akiyama et al. 2003). Both a hard and soft X-ray catalog are constructed as implemented for the ChaMP sample. Multi-band optical imaging in these fields allows us to convert optical magnitudes to the SDSS filter system (,) used by the ChaMP. The distribution in luminosity and redshift of the full AGN sample is shown in Figure 2. As evident, the deep surveys (i.e. CDF-N and CDF-S) are instrumental to detect low luminosity () AGN above a redshift of 1.5. In contrast, the ChaMP supplies the more luminous AGN underrepresented in the deep fields.

4.2 Method
We measure the differential X-ray luminosity function (d) expressed in Equation 1 where is the number of AGN per unit comoving volume () per as a function of luminosity and redshift .
| (1) |
This function is assumed to be continuous over the range in luminosity and redshift for which our survey is sensitive. The differential luminosity (d) is expressed as a logarithm (base 10) due to the 4 orders of magnitude spanned by our sample.
Here, we estimate the XLF in fixed luminosity and redshift bins using the 1/Va method (Schmidt 1968; Avni & Bahcall 1980). For each bin, the value of the XLF is a sum (Equation 2) of the contribution from each AGN falling within this specific bin.
| (2) |
We must apply a correction factor () for each AGN to account for the incompleteness in our optical spectroscopic identifications. This factor is reciprocal of the fraction of identified sources () at X-ray fluxes and optical magnitudes comparable to each source. The accessible volume is a function of both X-ray and optical limiting fluxes. Further details on our measure of both and are given in Silverman et al. (2005b). We estimate 1 errors based on a Poisson distribution due to the small number of objects per redshift bin.
Since we have a sample selected in two different energy bands, the survey area over which we are sensitive to an individual AGN depends on the observed flux. The sky coverage for AGN at depends on their hard flux while higher redshift AGN depend on their soft flux.
4.3 Preliminary results
In Figure 3, we plot the binned XLF in three redshift intervals to highlight the strong evolutionary trends. The luminosity function over the full redshift interval will be presented as mentioned in an upcoming paper (Silverman et al., in preparation). The XLF at is well approximated by the familiar double powerlaw where we have sufficient statistics to cover the full luminosity range. There is a strong increase in characteristic luminosity for the entire sample to . To evaluate our XLF, we have plotted the best fit pure luminosity evolution (PLE) model from Barger et al. (2005) and luminosity-dependent density evolution (LDDE) model of Ueda et al. (2003). Due to the similarity of both these models at , it is difficult to determine which one better matches our data. There may be some evidence of a flattening of the slope at the faint end () for that may agree with a LDDE model but any solid evidence of this requires a more sophisticated analysis.
We find that the Ueda model provides a good fit to our data for . At higher redshifts (), we see a decline in the overall numbers of AGN at all luminosities, similar to the decline present in the soft selected samples (Figure 1). With this new sample, we are able to further constrain the slope and normalization of the XLF at these high redshifts.

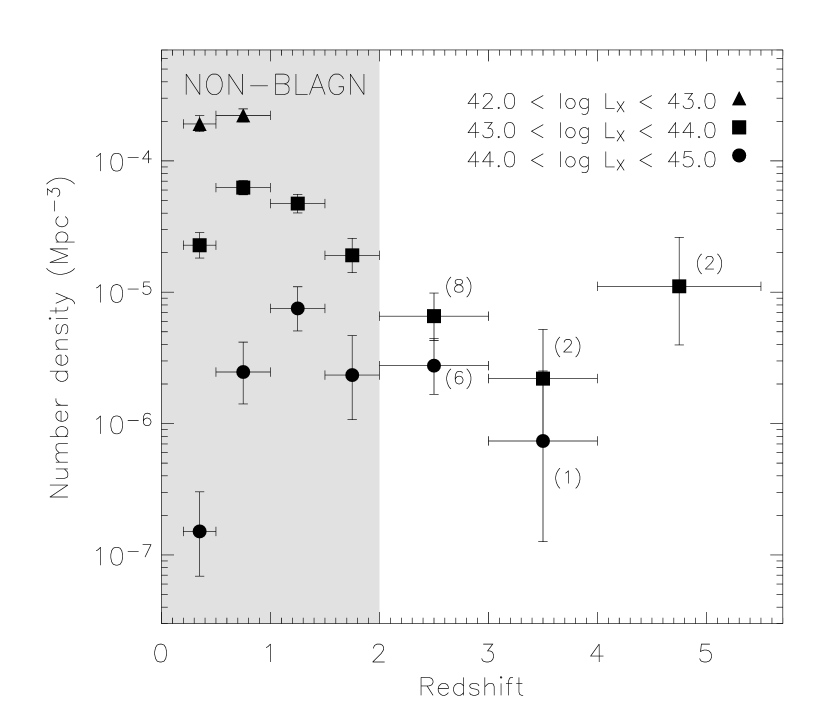
With knowledge of the optical spectral properties of these AGN, we can investigate the evolution of those with a hidden broad emission line region. With the exception of those at low luminosity, these AGN are usually obscured and many can be optically classified as type 2 in compliance with unification models. In Figure 4, we plot their comoving space density in three luminosity classes. First, it is quite evident from the error bars in Figure 4 that the sample is much smaller. Even with this limited sample, it appears qualitatively that more luminous AGN peak at earlier epochs () than those of lower luminosity () similar to the behavior of the type 1 AGN population (Hasinger, Miyaji & Schmidt 2005). This may imply that type 1 and type 2 AGN evolve in a similar manner and an obscured epoch of AGN formation is not evident. Larger samples are clearly needed to substantiate any such claims.
5 Conclusion
Even with a further understanding of the evolution of X-ray selected AGN at high redshift, we are continuing to identify a larger sample of ChaMP sources through deep optical spectroscopy. We must reduce the number of unidentified sources at faint optical magnitudes (). We expect that this optically faint population will include a significant number of the luminous () type 2 QSOs that have not been detected in large numbers in the ChaMP. With candidates based on optical colors, we may be able to significantly improve the statistics at these redshifts for which ChaMP has already found four to date.
References
- Akiyama et al. (2003) Akiyama, M., Ueda, T., Ohta, K., Takahashi, T., Yamada, T. 2003, ApJS, 148, 275
- Alexander et al. (2003) Alexander, D. M., et al. 2003, AJ, 126, 539
- Avni & Bahcall (1980) Avni, Y., Bahcall, J. N. 1980, ApJ, 235, 694
- Barger et al. (2003a) Barger, A.J. et al. 2003a, ApJ, 584L, 61
- Barger et al. (2003b) Barger, A.J. et al. 2003b, AJ, 126,632
- Barger et al. (2005) Barger, A. J., Cowie, L. L., Mushotzky, R. F., Yang, Y., Wang, W.-H., Steffen, A. T., Capak, P. 2005, AJ, 129, 578
- Boyle, Shanks & Peterson (1988) Boyle, B. J., Shanks, T., Peterson, B. A. 1988 MNRAS, 235, 935
- Brandt & Hasinger (2005) Brandt, W. N., Hasinger, G. 2005, ARA&A, 43, 827
- Cavaliere et al. (2000) Cavaliere, A. & Vittorini, V. 2000, ApJ, 543, 599
- Cowie et al. (2003) Cowie, L. L., Barger, A. J., Bautz, M. W., Brandt, W. N., & Garmire, G. P. 2003, ApJ, 584L, 57
- Croom et al. (2004) Croom, S. M., Smith, R. J., Boyle, B. J., Shanks, T., Miller, L., Outram, P. J., & Loaring, N. S. 2004, MNRAS, 349, 1397
- Croton et al. (2005) Croton, D.J. et al. 2005, astro-ph/0508046
- Di Matteo et al. (2005) Di Matteo, T., Springel, V., Hernquist, L. 2005, Nature, 620, 604
- Fabian (1999) Fabian, A. C. 1999, MNRAS, 308, 39
- Fan et al. (2001) Fan, X. et al. 2001, AJ, 121, 54
- Fiore et al. (2003) Fiore, F. et al. 2003, A&A, 409, 79
- Giacconi et al. (2002) Giacconi, R., et al. 2002, ApJS, 139, 369
- Green et al. (2004) Green et al. 2004, ApJS, 150, 43
- Hasinger et al. (2001) Hasinger, G. et al. 2001, A&A, 365, 45
- Hasinger, Miyaji, & Schmidt (2005) Hasinger, G., Takamitsu, M., Schmidt, M. 2005, A&A, 441, 417
- Hao et al. (2005) Hao, L. et al. 2005, ApJ, 129, 1783
- Kim et al. (2004a) Kim, D.-W. et al. 2004a, ApJS, 150, 19
- Kim et al. (2004b) Kim, D.-W. et al. 2004b, AJ, 600, 59
- La Franca et al. (2005) La Franca et al. 2005, astro-ph/0509081
- Lehmer et al. (2005) Lehmer, B. D. et al. 2005, ApJS, 161, 21
- Mainieri et al. (2002) Mainieri, V., Bergeron, J., Hasinger, G., Lehmann, I., Rosati, P., Schmidt, M., Szokoly, G., Della Ceca, R. 2002, A&A, 393, 425
- Marconi et al. (2004) Marconi, A., Risaliti, G., Gilli, R., Hunt, L. K., Maiolino, R., Salvato, M. 2004, MNRAS, 351, 169
- Merloni (2004) Merloni, A. 2004, MNRAS, 353, 1035
- Miyaji, Hasinger & Schmidt (2000) Miyaji, T., Hasinger, G., & Schmidt, M. 2000, A&A, 353, 25
- Moretti et al. (2003) Moretti, A., Campana, S., Lazzati, D., & Tagliaferri, G. 2003, ApJ, 588, 696
- Nandra et al. (2005) Nandra, K. et al. 2005, MNRAS, 356, 568
- Richards et al. (2005) Richards, G. T., et al. 2005, astro-ph/0504300
- Rosati et al. (2002) Rosati, P. et al. 2002, ApJ, 566, 667
- Schmidt (1968) Schmidt, M. 1968,ApJ, 151, 393
- Schmidt, Schneider & Gunn (1995) Schmidt, M., Schneider, D. P., & Gunn, J. E. 1995, AJ, 110, 68
- Silverman et al. (2005a) Silverman, J. D. et al. 2005a, ApJ, 618, 123
- Silverman et al. (2005b) Silverman, J. D. et al. 2005b, ApJ, 624, 630
- Steffen et al. (2004) Steffen, A. T., Barger, A. J., Capak, P., Cowie, L. L., Mushotzky, R. F., Yang, Y. 2004, AJ, 128, 1483
- Szokoly et al. (2004) Szokoly, G. P., et al. 2004, ApJS, 155, 271
- Tozzi et al. (2001) Tozzi, P. et al. 2001, ApJ, 562, 42
- Ueda et al. (2003) Ueda, Y., Akiyama, M., Ohta, K., & Takamitsu, M. 2003, ApJ, 598, 886
- Wall et al. (2005) Wall, J. V., Jackson, C. A., Shaver, P. A., Hook, I. M., Kellermann, K. I. 2005, A&A, 434, 133
- Warren, Hewett & Osmer (1994) Warren, S. J., Hewett, P. C., & Osmer, P. S. 1994, ApJ, 421, 412
- Wolf et al. (2003) Wolf, C., Wisotzki, L., Borch, A., Dye, S., Kleinheinrich, M., & Meisenheimer, K. 2003, A&A, 408, 499
- Yang et al. (2004) Yang, Y., Mushotzky, R. F., Steffen, A.T., Barger, A. J., Cowie, L. L. 2004, AJ, 128, 1501
- Zheng et al. (2004) Zheng, W. et al. 2004, ApJS, 155, 73