Proper Motions and CCD-photometry of Stars in the Region of the Open Cluster Trumpler 2
Abstract
-The results of the complex study of galactic open cluster Trumpler 2 are presented.The positions of approximately 3000 stars up to the limit magnitude mag in the area around the cluster were measured in order to obtain the proper motions. Measurements of star positions on 6 plates with the maximal epoch difference of 63 years were taken by means of the automated measuring complex ”Fantasy”. The root-mean error of the relative proper motions is . The catalogue of BV magnitudes of all the stars in the investigated area was compiled. Astrometric selection of the cluster members within the region of from the center of the cluster was made by means of the W.Sanders method(1971). In that field 192 stars were found to have the individual membership probability greater then 85, 148 of them are situated within the band around the main sequence (MS) of the cluster. They are considered to be cluster members by two criteria. The U-BB-V diagram plotted for the astrometrical cluster members by the data taken from the Washington catalogue of the UBV photometry in the galactic cluster fields (Hoag et al. 1961) has made it possible to redefine the value of the color excess E(B-V)40 instead of previously published values ranged from 030 to 034. The superposition of the MS of the cluster with the ZAMS Schmidt-Kaler (1965) for thus accepted E(B-V) leads to the coincidence at the value of the apparent distance module which corresponds to the distance . The luminosity and mass functions of the Trumpler 2 were constructed and the value of the slope (1.900.22) was determined. The cluster age of 8.913yr was determined on the base of Girardi et al. (2000) isochrone grid. Correspondent to this age the turn-off point of the MS is (B-V)16. It is shown that the red giant on the late stage of the evolution (st N.1095) belongs to cluster and indicated the brightness variability. The possibility that the number of both known and recently discovered variables are cluster members was considered. The catalogues of the proper motions and of the photometry of stars are appended. 111Tables 2,3,3A,5 will be only available in electronic form at the CDS
1 Introduction
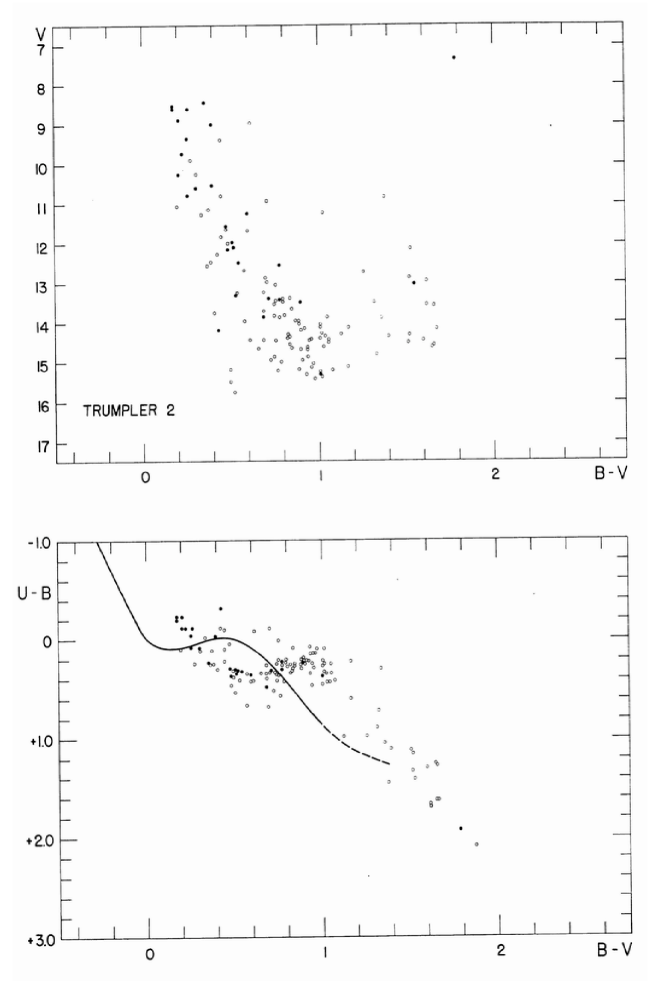
The open cluster Trumpler 2 is located near the famous rich clusters h and in the Perseus constellation. Its equatorial and galactic coordinates are: , ; , . In the Trümpler (1930) catalogue it is classified as II 2p (a pure cluster with little central concentration). All that was known about the cluster to the present day is based on the data from the Washington catalogue ”Photometry of stars in Galactic cluster fields”(Hoag et al. 1961)(HJ). For Trumpler 2 it included UBV photoelectrical photometry of 28 stars in the area and photographic photometry of 133 stars in the circle around the supposed cluster center. All the contemporary determination of the cluster parameter are based on that data (Fig. 1 a&b presented the Color-Magnitude diagram(CMD) and the two-color diagram of the cluster from that study). The existence of the cluster itself was not confirmed by any other original papers. This area was never investigated kinematically on the base of proper motions. Our paper has to fill this gap.
2 Astrometry
2.1 Proper motions
The observational material belongs to the Normal astrograph collection of the Pulkovo observatory and dates from 1937 to 2000 (Table 1). The scale of the Normal astrograph plates is . The cluster region star positions from the USNO-A 2.0 catalogue were used as an additional plate (epoch 1954.8).
| Plate | Exposure | Epoch | Quality |
|---|---|---|---|
| (min) | |||
| Early epoch | |||
| K 376 | 25 | 1937 Sept. 12 | high |
| D 80 | 30 | 1949 Mar. 31 | good |
| D 135 | 30 | 1949 May 5 | poor |
| Recent epoch | |||
| 18160 | 25 | 1999 Dec. 12 | poor |
| 18171 | 30 | 2000 Feb. 4 | good |
| 18175 | 25 | 2000 Feb. 6 | good |
All of the plates were scanned by means of the automated measuring complex ”Fantasy” of the Pulkovo observatory. The description of the complex was presented in Frolov et al (2002)(FJA). The positions of the 2362 stars in the area centered on the cluster Trumpler 2 up to the limit magnitude mag were measured. Positions of some faint stars were not measured on all plates because of the poor quality of their images. So from three to seven stellar positions were used to derive proper motions(PM). PM were determined by the line-method. The details of this method were presented in Jilinski et al.(2000). The deepest plate with the faintest images was considered to be the central plate. It was orientated by means of the stars positions from the ”Tycho-2” catalogue. Then all the other plates were reduced to this central one. For that reduction were selected 72 reference stars in the interval between and mag. The rms errors of derived PM are: , . The analysis of error distributions demonstrates that they increased from to with the increasing of the distance from the area center and from for stars with the magnitude mag to for mag stars. The astrometrical results are given in the Table 2 which columns contain: 1 - the star number, 2 - the star number from the USNO-A 2.0 catalogue, 3,4 - its rectangular coordinates X and Y on the plate K376, 5 - radius-vector, 6,7,8,9 - X and Y relative proper motions and their errors, 10 - the number of used plates, 11 - photographical B-magnitude, resulted from the ”Fantasy” measurements, 12 - notes(bl marks blends, bad - bad measurement, abs -absence of the star on the plates, BD and AD - star identification).
2.2 Member segregation.
The selection of cluster members was made for stars located in the circle with the around the cluster center. That region contains 313 stars with determined proper motions. Blended images and stars measured only on two or less plates were expelled. The size of this circle was selected according to two reasons: first, it should be large enough for not to miss the cluster members from the corona, second, not be too large to litter the vector point diagram (VPD) with a large amount of the field stars. We used the method in which membership probabilities, magnitude equations (ME) and parameters of the star distributions on the vector point diagram (VPD) were determined step by step in iterative process. The details of this procedure are described in FJA. The starting selection was realized in the circle with the R centered on the Trumpler 2. As a first approximation stars with the photoelectric BV magnitudes from the HJ were considered to be the cluster members. Based on proper motions and magnitudes of these stars the magnitude equation (ME) was studied and the proper motions of all stars were corrected for it. Then at each step characterized by increasing value of R (+2) the parameters of the bivariate Gaussian distributions of proper motions, circular for the cluster and elliptical for the field, were computed by the Sanders method (1971). The preliminary selection of the cluster members had been made in each iteration step. Then the proper motions were tested for the ME. If it had been revealed then all the PM in the catalogue were refreshed. The latest step was made for the stars in the circle with the radius R. It is important to note that it is impossible to divide stars of the cluster and of the field on the VPD visually because of the proximity of the centers of their distributions. This fact is frequently registered for the far clusters (for example see J. Sanner et al.(199,2000,2001). Nevertheless it takes only 8 iteration to reach the stable solution numerically with relative precision E=0.001. The following initial values of the parameters were accepted: , centers of the distributions: the field -1, 1, the cluster: 1,-1, the dispersion: the field 12, 8, the cluster 4. Calculations resulted in the following values: the relative number of cluster members and all stars ; centers of distributions: the field , ; the cluster , ; standard deviations: the field , , the cluster . All the values are in . They were used to calculate the individual membership probabilities of the stars in the area by the formulae:
where - normalized number of cluster stars, - normalized number of field stars, , - proper motion in and for the star.
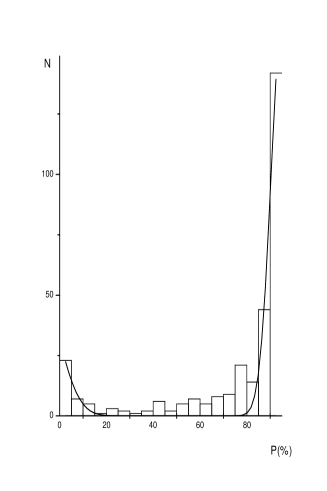
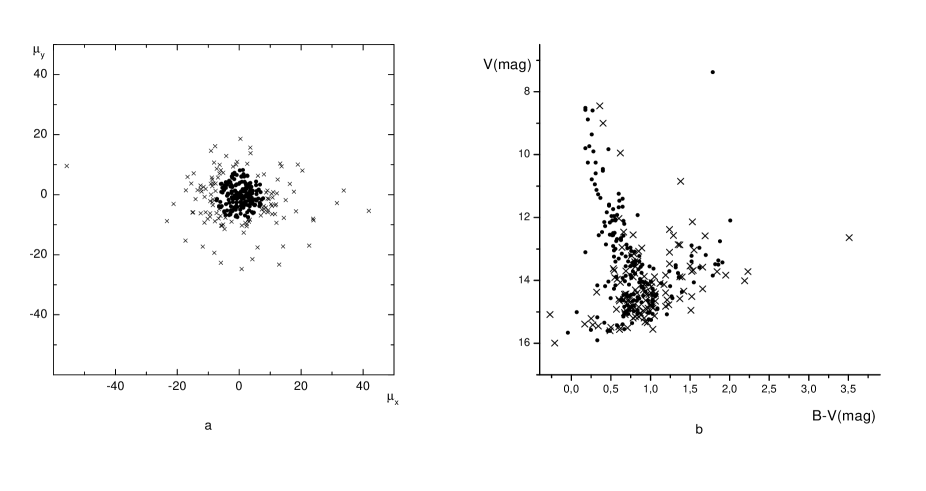
The resulting histogram shows that the stars with the probabilities can be considered the cluster members (Fig. 2). The whole amount of such stars is 192. The final VPD is presented in Fig. 3a. Cluster members are plotted by the solid dots, field stars - by the crosses.
3 Photometry
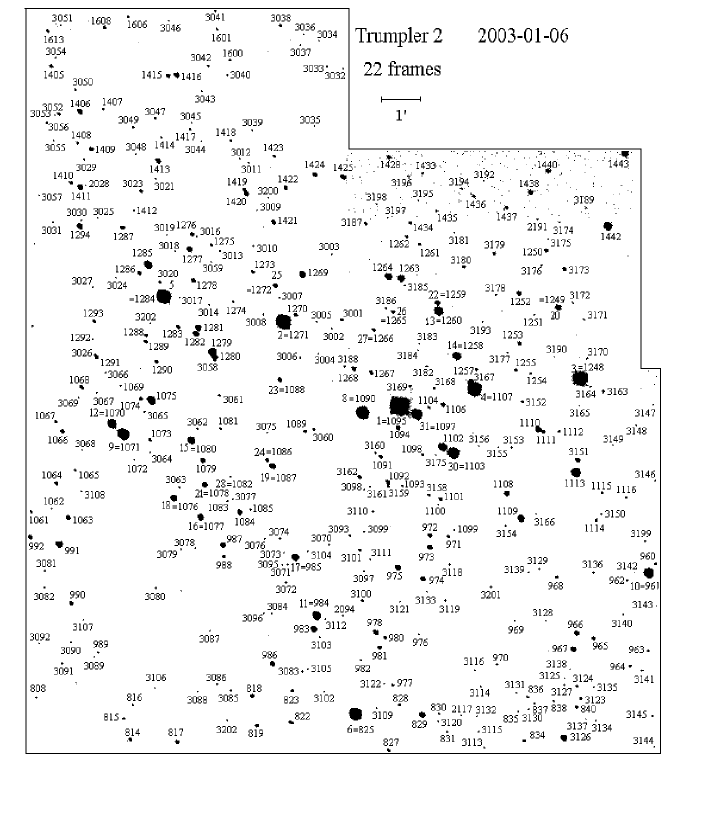
The final conclusion of the star membership was based on two criteria: its proper motion and its position on the CMD. Only small part of situated in the central circle stars has got the initial UBV-photometry(HJ). The and magnitudes of the rest stars were determined partly as by-product of astrometric plate measurements (image diameters) or by our original CCD-observations and partly were calculated from the infrared J,H,K magnitudes from 2MASS catalogue by the derived transformation formulae. Unfortunately due to the technical reasons we were able to obtain CCD-magnitudes only in the area of . The identification map of the central part of the cluster is presented in Fig. 4. The star number from the Washington catalogue is indicated in front of the author’s number. Data available from the all different sources of the broadband photometry for each star are presented in Table 3, which columns contain: 1 - the star number according to Table 2, 2 - the radius-vector,3 - the specific numbers from 1 to 10 corresponding to photometry data, 3,4- B and V magnitude,5 - B-V, 6 - notes. The description and correspondent comments of the specific numbers which mark the sources of photometry are given in in Table 4, which columns contain 1 - the specific number (S/N), 2 - photometry band, 3 - source of the material, 4 - the area dimensions in arcmin, 5 - the photometric errors in magnitudes.
| S/N | Bands | Sourses | Area | Errors |
|---|---|---|---|---|
| 1 | HJ, photoelectric magnitudes | mag, mag | ||
| 2 | HJ, photographic magnitudes | mag, mag | ||
| 3 | Tycho catalogue | mag, | ||
| mag (all stars), | ||||
| mag, | ||||
| mag ( mag) | ||||
| 4 | Author’s photographic magnitudes | mag for ”red” stars | ||
| catalogue | mag for ”blue” stars | |||
| Author’s CCD magnitudes | mag | |||
| catalogue | ||||
| 5 | Author’s photographic magnitudes | mag for ”red” stars | ||
| catalogue | mag for ”blue” stars | |||
| 2MASS catalogue | mag | |||
| calculated from the J,H,K magnitudes | ||||
| 6 | Author’s photographic magnitudes | mag for ”red” stars | ||
| catalogue | mag for ”blue” stars | |||
| No data | ||||
| 7 | USNO 2A catalogue | |||
| No data | ||||
| 8 | Author’s CCD magnitudes | mag | ||
| catalogue | ||||
| Author’s CCD magnitudes | mag | |||
| catalogue | ||||
| 9 | calculated from the values of | |||
| derived from the 2MASS catalogue | ||||
| Author’s CCD magnitudes | mag | |||
| catalogue | ||||
| 10 | B | derived from the 2MASS catalogue | ||
| V | Author’s CCD magnitudes | mag | ||
| catalogue |
Notes for specific numbers:
1 and 2. While plotting the characteristic curve
the systematic difference between photoelectric and photographic
values in HJ catalogue was detected. It
was taken into account. The same difference was detected for the
colors B-V.
3. The real precision of the photometric data given in
Tycho - 2 catalogue for stars mag is much lower then
claimed. That’s why we preferred alternative sources for these
stars.
4, 5, 6. - photographic values of the major quantity of stars
in the studied region were determined by measuring their diameters
by means of the ”Fantazy” complex. It is well known that
magnitudes obtained with the Pulkovo Normal astrograph are
infected by the color equation(CE). That’s why characteristic
curves were plotted separately for ”red” and ”blue” stars. magnitudes of the
”blue” stars were not corrected for CE as it’s value was
non-significant (smaller than the mean error). At the same time
from original observations made of the ”red” stars the value of
the correction was 0.35 mag per magnitude and was taken into
account in all cases.
4. - magnitudes were obtained from original observations made with
the 320 mm mirror astrograph ZA-320 of the Pulkovo Observatory
equipped with the CCD-receiver ST-6 with a fixed TC241 matrix
(Bekyashev et al.(1998)).
5. -magnitudes were calculated with the J,H,K
magnitudes from the infrared 2MASS catalogue by the derived
transformation formula :
7. -magnitudes from the USNO-2A catalogue were treated only as control
values.
8. magnitudes were obtained from original observations with the 320 mm mirror
astrograph ZA-320 of the Pulkovo Observatory equipped with the
CCD-receiver ST-6 with a fixed TC241 matrix(Bekyashev et
al.(1998)).
9,10. -magnitudes were calculated with the J,H,K magnitudes from
the infrared 2MASS catalogue by the derived transformation
formulae:
Table 3A contains the additional magnitudes and obtained by means of CCD-photometry for stars which brightnesses are less than the limit sensibility of the astrometric plates. Their numbers begin with the 3 on the identification map of the central part of the cluster (Fig. 4). Columns of the Table 3A contain: 1 - the star number, 2,3,4 - B-magnitude, its error and the number of observations, 5,6,7 - V-magnitude, its error and the number of observations. As the standards for these observations we took Washington photoelectric and partly (for the faint stars) photographic photometry. Errors of the magnitude determination were defined as external relative to the standards. Photometric data from the Table 3 were used to construct the CMD for 313 stars in the circle R. As it was mentioned in the process of membership determination the positions of stars on CMD were used as a second parameter. Because of unequal accuracy of the material the following application priority order of the specific numbers (S/N) was set: 1(photoelectric HJ) - 28 stars, 2(photographic HJ) - 56 stars, 3 (Ticho) - 6 stars, 8 (CCD) - 95 stars, 4(the combination of authors photographic and CCD)- 1 star, 5 - (the combination of authors photographic and 2MASS) - 127 stars. CMD of all these stars is shown in Fig. 3b.
4 Analysis and conclusion
Stars of the IV and V luminosity classes falling on the CMD into the interval from the cluster main sequence were considered to be the photometric cluster members. As the average error of the color index determination rises from the bright to faint stars approximately from 0.02 mag to 0.11 mag the width of the MS band increases.
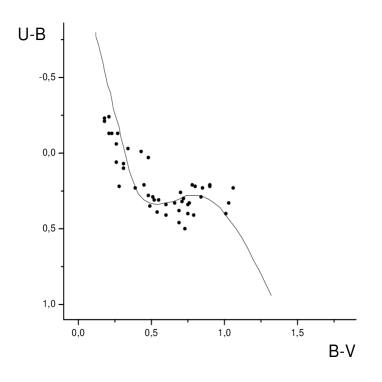
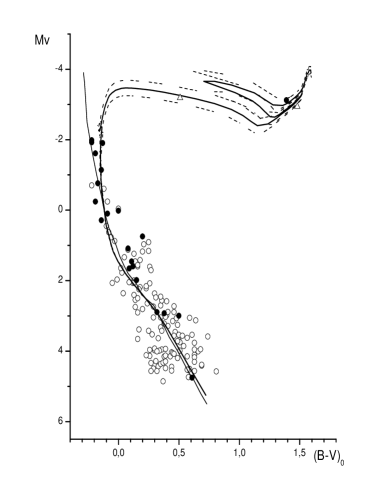
In order to determine the mean absorption in the region of the cluster the two-color diagram was plotted using the HJ photometry only for the 44 astrometric cluster members with falling on the MS. For the inclination the best coincidence of the line of normal colors with the two-color sequence of the cluster was achieved at the value of the color excess mag (Fig. 5) which differs from accepted in existing compiled catalogues values: 0.30(Hoag,1966) and 0.34 (Electronic Database WEBDA, 2001222http://obswww.unige.ch/webda). With thus fixed value of color excess the superposition of the MS of the cluster with the ZAMS (Schmidt-Kaler,1965) was made. During this procedure the special attention was paid to the stars with photoelectric photometry. The best coincidence was achived at the value of the apparent distance module which corresponds to the true module and the distance . In Fig. 6 CMD diagram for probable cluster members (according to both photometric and astrometric criteria) is presented. Solid circles marks the stars supplied by photoelectric photometric data and hollow circles - all the other.
The catalogue of the stars in the central circle (R)is presented in Table 5. Its columns contain 1 - the author’s number, 2 - sign of membership, 3,4 -the rectangular coordinates of star(arcmin), 5 - the distance from the center (arcmin), 6,7,8,9 - the proper motions and their root-mean-square errors(), 10 - the number of the astrometric plates, 11 - the membership probability, 12 - the photometry specific author’s number (see Table 4), 13,14 - the star magnitude and color.
Located in the cluster’s center red giant (st. N 1095) has high individual membership probability. Large dispersion in its photometric data may be the evidence of the variability. Another red giant (st. N 1748), though it does not fall in the 16′circle where the individual membership probabilities were determined, relates to the third class of Eibighausen (1942) classification. It means that this star lies within a circle of the on the VPD where 98% of all cluster members are situated (Kadla,1966). The same refers to the st. N 1941 which can have travelled far from the cluster center but is gravitationally linked with it. These possible cluster members are marked by ”prob”. In Fig. 6 they are plotted by .
| Radius-vector | Notes | ||||
| (arcmin) | mag | mag | % | ||
| 1095 | 1.15 | -3.12 | 1.39 | 94 | suspected variable star |
| 1748 | 17.35 | -2.94 | 1.48 | prob | |
| 1941 | 36.70 | -3.19 | 0.51 | prob |
The estimation of the age of the cluster is based on the grid of isochrones published by the Padua research group333http://www. pleadi.astro.pd.it and described in the paper Girardi et al.(2000) The superposition of various isochrones on the CMD shows the perfect coincidence of the yr isochrone for with the cluster diagram. The accuracy of age determining depends on the grid step (). Corresponding to this isochrone the turn-off point of the MS is mag.
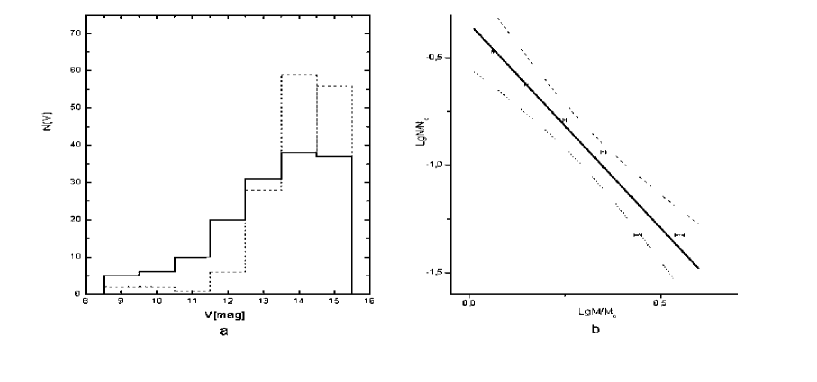
The cluster luminosity function is plotted for 148 cluster members (Fig. 7a). As illustration the luminosity function for the field star is presented here too. The cluster mass function was plotted using only stars of the cluster MS located lower than the turn-off point mag (Fig. 7b). Star masses were calculated using the data from the work of Girardi et al. (2000). The straight line drawn by the root-mean-square method with the 95% confidence level has the slope . That is in a good agreement with the numerical results of Scalo (1998) in his three-segment power law of the initial mass function for star clusters and associations of Milky Way and LMC. The Trumpler 2 mass function shows the lack of stars with the mass about . This feature is observed also on the CMD for the .
5 Variable stars.
In the studied in the area where star proper motions were obtained eight variable stars from the the General catalogue (GCVS) of Kholopov (1998) were found. All of them are situated far from the center of the cluster () and hardly belong to it in spite of the the fact that they lie in 2 circle on the VPD. Their data are given in the part A of Table 6. Its rows contain 1 - the GCVS star indication, 2 - the author’s number, 3,4 - the right ascention and the declination of the star, 5 - variability type, 6 - the distance from the center, 7,8 - magnitudes from authors photometry catalogue(Table 3), 9 - membership.
| A | ||||||||
|---|---|---|---|---|---|---|---|---|
| Symbol | LR Per | DX Per | DY Per | DZ Per | VZ Per | EI Per | EK Per | EM Per |
| The author’s | ||||||||
| number | 2355 | 1856 | 1761 | 1571 | 996 | 1042 | 1381 | 513 |
| 02 29 14 | 02 31 14 | 02 31 42 | 02 32 22 | 02 35 07 | 02 36 15 | 02 36 35 | 02 37 52 | |
| +56 16.1 | +56 05.0 | +55 55.6 | +55 55.9 | +55 33.1 | +55 40.8 | +55 57 | +55 18.5 | |
| Variability type | SR: | EA/SD: | SRB | EB/KE | LB | M | L | L |
| R(arcmin) | 52.06 | 29.03 | 24.00 | 15.51 | 16.79 | 23.95 | 28.86 | 44.21 |
| Membership | prob | prob | prob | 93 | prob | prob | prob | prob |
| B(mag) | 15.39 | 15.49 | 12.69 | 14.11 | 14.20 | 14.35 | 15.34 | 15.51 |
| V(mag) | 14.16 | 14.92 | 12.38 | 12.10 | 8.94 | 13.21 | 14.70 | 10.40 |
| B | |||||||||||
|---|---|---|---|---|---|---|---|---|---|---|---|
| ID | The author’s | MaScat | MedMag | MedEr | Ng | Quality | R | Membership | B(mag) | V(mag) | S/N |
| number | |||||||||||
| 1803249 | 1137 | 0.155 | 12.38 | 0.056 | 49 | poor | 17.98 | prob | 12.80 | 12.23 | 5 |
| 1803292 | 1139 | 0.147 | 12.145 | 0.044 | 44 | poor | 17.37 | prob | 13.47 | 12.69 | 5 |
| 1803346 | 1143 | 0.2 | 12.654 | 0.068 | 42 | poor | 18.13 | prob | 13.27 | 12.65 | 5 |
| 1803553 | 1241 | 0.153 | 10.693 | 0.016 | 31 | poor | 12.79 | 94 | 10.57 | 10.26 | 2 |
| 10.45 | 10.16 | 3 | |||||||||
| 10.51 | 10.28 | 5 | |||||||||
| 1803662 | 1127 | 0.145 | 11.985 | 0.036 | 27 | poor | 11.68 | 93 | 12.11 | 11.63 | 2 |
| 11.81 | 11.75 | 3 | |||||||||
| 11.95 | 11.71 | 5 | |||||||||
| 1803669 | 954 | 0.232 | 12.667 | 0.067 | 22 | poor | 15.05 | 94 | 13.30 | 12.86 | 5 |
| 1803717 | 1442 | 0.146 | 11.787 | 0.031 | 22 | poor | 9.62 | 93 | 12.27 | 11.67 | 3 |
| 12.26 | 11.47 | 4 | |||||||||
| 12.26 | 11.45 | 5 | |||||||||
| 1803741 | 961 | 0.123 | 10.767 | 0.016 | 21 | poor | 10.13 | 94 | 10.47 | 10.26 | 1 |
| 10.50 | 10.37 | 3 | |||||||||
| 10.42 | 10.27 | 4 | |||||||||
| 10.42 | 10.32 | 5 | |||||||||
| 1921137 | 721 | 1.324 | 11.546 | 0.025 | 101 | good | 17.96 | prob | 12.79 | 12.19 | 3 |
| 13.21 | 12.18 | 5 | |||||||||
| 1921548 | 1294 | 0.937 | 12.792 | 0.059 | 199 | good | 10.55 | 93 | 13.35 | 12.66 | 4 |
| 13.35 | 12.67 | 5 | |||||||||
| 1922164 | 1393 | 0.62 | 13.622 | 0.115 | 205 | high | 16.76 | prob | 14.41 | 13.82 | 5 |
| 1922260 | 1049 | 1.217 | 12.091 | 0.04 | 227 | high | 17.66 | prob | 14.41 | 12.12 | 5 |
The search of the variable stars was carried out in the recently published database SKYDOT444http://skydot.lanl.gov (SD) (Woźniak P.R. 2004) relied on the Northen Sky Variability Survey (NSVS). From the list of all the objects presented in the SD we have selected only those ones which amplitude exceed for more than 3 times the mean error. Twelve of them could be the cluster members. The list of selected objects is given in the part B of the Table 6. Its columns contain 1 - the SD star indication, 2 - the author’s number, 3 - the maximum brightness amplitude, 4 - the mean magnitude, 5 - the mean error of the magnitude determination, 6 - the number of the reliable observations during the whole period, 7 - quality of observations, 8 - the distance from the cluster center,9 - membership, 10,11 - magnitudes, 12 - the photomety specific number from the Table 3. Star magnitudes in the SD were determined in the natural system which was close to V band. Curves of the brightness variation do not permit to determine the types of the variability because of the low quality of the most of the observations. Unfortunately the technical reasons did not permit the investigators to observe the bright stars and made impossible to compare their results with the works of the other researchers. By the way this obstacle in particular prevented us from the verification of our supposition of the variability of the probable cluster member star N 1045 (the red giant).
Acknowledgements.
We would like to thank investigators of Pulkovo observatory N. Bronnikova, E. Polyakov, A.Devyatkin for their collaboration in the observations. E. Jilinski thanks MCT Brazil for financial support.References
- (1) Bekyashev, R.H., Kanaev, I.I., Devyatkin, A.V., Gorshanov, D.L., Gritsuk, A.N., Kulish, A.P., Shumaher, A. V., Svidunovich, A. G.: 1998, Izv.Glav.Astron.Obs.Pulkovo No 213, 249, In Russian
- (2) Eibighausen, E.C.: 1942, AJ, 50,1
- (3) Frolov, V.N., Jilinski, E.G., Ananjevskaja, Yu.K., Poljakov, E.V., Bronnikova, N.V., Gorshanov, D.L.: 2002, Astron. Astrophys. 396, 125
- (4) Girardi, L., Bressan, A., Bertelli, G., Chiosi, C.: 2000, Astron. Astrophys.141, 371
- (5) Hoag, A.A., Johnson, H.L., Iriarte, B., et al.: 1961, Pub. USNO 17,496
- (6) Hoag, A.A.: 1966, Vistas 8 ,139
- (7) Jilinski, E.G., Frolov, V.N., Ananjevskaja, Yu.K., Drake, N.A.: 2000, Izv.Glav.Astron.Obs. Pulkovo No 215, 57, In Russian
- (8) Kadla, Z.I.: 1966, Izv.Glav.Astron.Obs. Pulkovo No 181, 93, In Russian
- (9) Kholopov, P.N.: 1985, General Catalogue of Variable Stars, ed. Nauka, Moskow
- (10) Sanders, W.: 1971, Astron. Astrophys. 14, 226
- (11) Sanner, J., Geffert, M., Brunzendorf, J., Schmoll: 1999, Astron. Astrophys.349, 448
- (12) Sanner, J.,Altmann, M., Brunzendorf, J., : 2000, Astron. Astrophys.357, 471
- (13) Sanner, J., Brunzendorf, J., Will, J.-M., Geffert, M.: 2001, Astron. Astrophys.369, 511
- (14) Scalo, J.M.,: 1998, ASP Conf. Series 142, 201
- (15) Schmidt-Kaler, Th.: 1965, Landolt-Bornstein, Neue Series, 298
- (16) Skrutskie, et al.: 1997, In impact of Large Scale Near-IR Sky Surveys, ed. F.Garzon et al., (Dordrecht: Kluwer), 25
- (17) Trümpler, R.J.: 1930, Lick Obs. Bull. 14, 154
- (18) Wozńiak, P.R., Westrand, W.T., Akerlof, C.V., et al.: 2004, Preprint Los Alamos National Laboratory