11email: ronald.weinberger@uibk.ac.at
11email: giovanna.temporin@uibk.ac.at 22institutetext: Thüringer Landessternwarte Tautenburg, Sternwarte 5, 07778 Tautenburg, Germany
22email: stecklum@tls-tautenburg.de
Detection of an optical filament in the Monogem Ring ††thanks: Based on observations collected at the 1.82 m telescope of the Padua Astronomical Observatory at Asiago and at the 2 m Schmidt telescope of the Thüringer Landessternwarte Tautenburg.
The Monogem Ring is a huge bright soft X-ray enhancement with a diameter of 25. This 0.3 kpc distant structure is a peculiar Galactic supernova remnant in that it is obviously visible only in X-rays, due to its expansion into a region of extremely low ambient density: hence, practically no optical emission or a neutral H i shell was expected to be detectable. - Here we report on the discovery of a very faint arc-like nebula on a POSS II R film copy, at the south-eastern borders of the MR. Spectroscopy revealed this filament to have a very large [S ii] 6716+6731/H ratio of up to 1.8, indicating shock excitation, and a low density of Ne 100 cm-3. There is no hint of [O iii] emission in the spectra. On deep wide-field direct images in H and in [S ii] the nebula appears as a 20′ long, thin ( 1′), structured filament, stretching N-S. We believe that this filament belongs to the MR and became visible due to the interaction of the expanding remnant with a mild density increase in the interstellar medium. Only one other possible optical filament of the MR has been reported in the literature, but no spectrum was provided.
Key Words.:
ISM: supernova remnants – ISM: individual objects: Monogem Ring1 Introduction
The Monogem Ring (MR) is a 25°-diameter supernova remnant (SNR) centered at (, ) (203°, +12°), visible as a bright, diffuse, soft X-ray enhancement in the Monoceros and Gemini constellations. Recently, this 300 pc distant structure has attracted considerable attention, as a very important source of high-energy cosmic rays and a possible responsible for the sharp knee in the cosmic ray energy spectrum at 3 PeV (Erlykin & Wolfendale 2004; Chilingarian et al. 2003; Thorsett et al. 2003; Kobayashi et al. 2004; Kulikov & Zotov 2005).
The MR is interesting in another respect too. According to a detailed modeling of Plucinsky et al. (1996), this SNR is in the adiabatic stage of evolution: At a distance of 300 pc and with an average temperature of log(/K) = 6.15, among other things the initial ambient density was found to be extremely low, 5.2 10-3 cm-3 only. The thermal pressure of the X-ray-emitting gas was calculated by these authors to be 4.5 104 K cm-3, only 2-4 times higher than the estimated pressure of the undisturbed interstellar medium (ISM). Hence, as this SNR continues to evolve, it probably will reach pressure equilibrium with the ISM before it reaches the radiative phase of SNR evolution. As a consequence of this very low ambient density, optical filaments (and a neutral shell) should be particularly difficult to detect in the MR, as Plucinsky et al. (1996) emphasize.
Interestingly, in a so far unnoticed paper published more than 2 decades ago, Reimers & Wendker (1984) reported on a previously unknown faint interstellar filament found on a deep U-plate. Although no spectrum was taken, these authors provided arguments that this about 1° long thin filament, with a maximum near R.A. 06:30.5, Dec. +09.75 (B1950.0), represents the outcome of [O ii] line emission due to a slow shock and appears to be an optically visible part of the south-western region of the Monogem Ring. There is another (passing) mention of optical emission from the MR in the literature, referring to faint extended optical emission in the Wisconsin H-Alpha Mapper (WHAM) survey (Haffner et al. 2000); due to its angular resolution of 1° any sharp filaments could of course not be detected.
Here we report on a new, very faint arc-like nebula visible on an R film copy of the Second Palomar Observatory Sky Survey (POSS II). It was detected in the course of our search for galaxies in the zone-of-avoidance (Seeberger et al. 1996). On deep wide-field images taken with the 2m Tautenburg Schmidt telescope it appears as a long, structured, thin filament. Spectra obtained with the 1.8m telescope on Cima Ekar in Asiago show this filament to be excited by a slow shock. Its location strongly suggests that we deal with optical emission from the Monogem Ring.
2 Observations
Broad band I (2 180 sec) and narrow band H (2 1200 sec) and [S ii] 6716,6731 Å (2 1200 sec) exposures were acquired in March 2005, at the Thüringer Landessternwarte Tautenburg (Germany), with the 2 m telescope in the Schmidt mode, for which the correction plate limits the aperture to 1.34 m. The bandpass width (FWHM) of the H and [S ii] filters is 9.7 nm. The pixel size of the 2k2k SITe CCD chip, 2424 m, and the plate scale of 51.4 arcsec mm-1 give a field of view of 42′ 42′ with an image scale of 1.23 arcsec pixel-1. While no structure was detected in the I-band image, a curved filament of 20′ extent in North-South direction was detected in the two narrow-band filters.
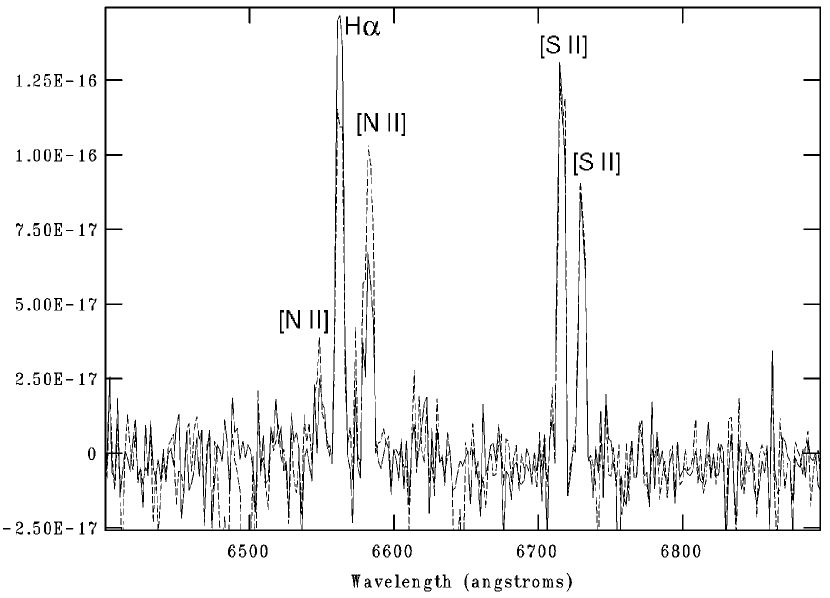
Optical spectra across the brighter part of the filament, centered at R.A. 07:28:38, Dec. 05:09:55 (J2000), were obtained during three observing runs in November and December 2004 and in January 2005, at the 1.82 m telescope of the Asiago Observatory (Italy) with the Asiago Faint Object Camera and Spectrograph (AFOSC) combined with a TEK 1024 thinned CCD chip, giving a spatial scale of 0.47 arcsec pixel-1. Low resolution long-slit spectra in the wavelength range 4000 - 7800 Å (dispersion 4.22 Å pixel-1, spectral resolution 29 Å) were obtained in the first two runs under unfavourable ( 3″) seeing conditions with total integration times of 3600 and 2900 sec. A higher resolution spectrum in the wavelength range 6250 - 8050 Å (dispersion 1.77 Å pixel-1, spectral resolution 5.4 Å) was obtained in the third run under spectrophotometric conditions and 2″ seeing with an exposure time of 3600 sec. A slit width of 169 was chosen. The emission lines H, [N ii] 6548,6583 Å, and [S ii] 6716,6731 Å were clearly detected in all observations over an extent of 55″ along the slit, without any visible underlying continuum emission. The [O i] 6300 emission line is also visible, but is very weak and suffers from contamination by bright night-sky lines.
The data reduction proceeded in the usual way. Standard IRAF111IRAF is distributed by the National Optical Astronomy Observatories, which are operated by the Association of Universities for Research in Astronomy, Inc., under cooperative agreement with the National Science Foundation. packages were used for bias subtraction, flat fielding, wavelength linearization, flux calibration and subtraction of the sky-background, while the package L.A.COSMIC (van Dokkum 2001) was used for cosmic ray cleaning. Flux calibration was performed by use of spectrophotometric standard stars observed during the same nights as the target object.
Emission lines were measured by Gaussian fitting. No correction for foreground extinction was applied, however the emission lines under consideration are quite close in wavelength, therefore their ratios are not expected to be significantly affected by extinction (see Sect. 3.2).
3 Results and discussion
3.1 Morphology
A slightly curved filament of 20′ extent in North-South direction was detected in direct images, with the two narrow-band filters. It runs from R.A. 07:28:28.9, Dec. +05:13:04 to 07:28:19.7, +04:57:13 (J2000) with a brightness maximum near R.A. 07:28:38, Dec. +05:10. The structure can be roughly approximated with an arc of circumference of radius 7′, except for the southernmost 6′ part of the filament, which seems to be arranged on a straight line. On the northern tip, the filament is crossed by a small arclet 55 long and 1′ wide. Upon closer examination one gains the impression that close in projection to the (unrelated) bright star located 1-2′ South-West of the brightness maximum (the F4V star GAT 1096; B = 9.92, V = 9.51), the layers of the filament twist: e.g. the westernmost layer of the southern part of the filament becomes the easternmost layer in the northern part of the filament. A composite image obtained from the exposures in the three bands is shown in Fig. 1.
Figure available as jpeg
Using SkyView222http://skyview.gsfc.nasa.gov we found no counterparts of this filament at other wavelengths. On IRAS maps, for example, there is no extended emission visible near or along this structure. In the optical, on POSS II R and B film copies, no sign of dust extinction is traceable. An examination of the Southern H-Alpha Sky Survey Atlas (SHASSA, Gaustad et al. 2001), which covers the southern hemisphere sky up to declinations of +15° shows no emission worth mentioning at or within a few degrees within the location of the filament. Hence, the filament and the northern arclet seem to be isolated structures, at least up to the available brightness limits.
3.2 Spectroscopy
The filament clearly is an emission nebula. Emission line ratios derived from the low resolution spectra are in agreement within errors with those from the high resolution one, therefore we present here only the latter. The slit position is marked on the [S ii] image in Fig. 2. Its position is centred at R.A. 07:28:38, Dec. 05:09:55 (J2000), i.e. at Galactic coordinates = 2125390, = +106193.
Figure available as jpeg
A tentative detection of the H emission line at 1.4 level in the low resolution spectrum can be used as an upper limit to the line flux. This gives a lower limit to the H/H ratio of 5, thus implying a lower limit to the foreground extinction E() 0.5 mag for an assumed intrinsic ratio H/H = 3.0. This value of foreground extinction is significantly higher than that implied by dust maps derived from IRAS and DIRBE far infrared data in this region of the sky. In fact, using the dust maps of Schlegel et al. (1998) with a scale of 2.37 arcmin2 pixel-1 and interpolating from the four nearest pixels around the position = 212.5, = 10.6, we obtained E() = 0.07 mag. Since the spatial extent of H emission in our spectra (along the slit) is 1′ a possible explanation to this discrepancy might be the presence of a local patch of dust associated to the filament, small and/or cold enough not to be visible in the dust maps. Another possible explanation dealing with the physical conditions of the emitting gas is proposed later in this Section.
A gradient in the emission-line ratios of the filament is present along the slit. Namely, two similarly extended portions of the filament have been identified and show the following observed emission-line ratios: [N ii] 6583/H = 0.97 0.17 and 0.47 0.10, [S ii] 6716+6731/H = 1.76 0.29 and 1.33 0.19, [S ii] 6716/[S ii] 6731 = 1.46 0.26 and 1.64 0.29 for the eastern and western portion, respectively. The [O i] 6300 line is visible in the bidimensional spectrum, after sky-subtraction, at the same spatial position along the slit as the other emission lines, but it is very faint. For this reason, we measured it summing the spectrum over the whole extent of the filament, and found [O i]/H = 0.23 0.41 and [N ii] 6583/[O i] = 2.98 0.46. The spectra of the two parts of the filament are plotted on top of each other in Fig. 3 for easier comparability. The splitting of the filament in two parts is clearly visible also in Figs. 1 and 2, where there actually appear to be two crossing filaments. The high value of the [S ii] ratio, close to 1.5, prevents the determination of the electronic density Ne and indicates that the excited gas is in the low density limit Ne 100 cm-3. The high ratios of low ionization emission lines ([N ii] and [S ii]) to H are typical of shock heated gas (e.g. Blair & Long 1997). A high [N ii]/H ratio can also be produced by an overabundance of nitrogen, which cannot be excluded in this case. The emission lines are narrow and unresolved (i.e. their width is instrumental, FWHM 5 Å), thus indicating a low velocity shock.
We may roughly estimate the shock velocity. The non-detection of the [O iii] 5007 line enables us to give a first approximate upper limit for the shock velocity of 60 km s-1 (Raymond 1979; Fesen et al. 1992). Then, by using the diagrams presented in Hartigan et al. (1994) for a preshock density of 100 cm-3 and a small magnetic field (0 - 1 G) we estimated the shock velocity from the [S ii]6716+6731/H ratio of 1.3. According to these diagrams, our observed [S ii]/H ratio implies an ionization fraction 0.03 and a shock velocity in the range 20 - 35 km s-1. Also, the high [S ii] 6716/[S ii] 6731 ratio indicative of the low density limit approaches the expectations for slow shocks. Interestingly, the diagrams in Fig. 8 of Hartigan et al. show that, at such low shock velocities, the H/H ratio rises rapidly. This effect results from the relative excitation rates at temperatures that are relatively low, 2104 K or less. In particular, H/H 5, the estimated lower limit in our spectra, corresponds to shock velocities 35 km s-1, in agreement with what derived from the [S ii]/H ratio. Therefore, the slow shock, rather than a local dust patch, could be the explanation to the high value of the Balmer decrement and solve the discrepancy with the low foreground extinction value derived from Schlegel et al.’s maps.
However, we note that our observed spectrum does not fully agree with the models presented by Hartigan et al. (1994). In particular, while slow shock models predict high values ( 3) of [N i] 5198+5201/[N ii] 6583 and low values ( 0.1) of [N ii] 6583/[O i] 6300, in our spectra the [N ii] line is rather bright, while the [O i] line is very weak and the [N i] lines are not detected. In fact the observed [O i]/H ratio would imply an ionization fraction one order of magnitude higher than estimated from [S ii]/H and a shock velocity of 50 km s-1, and the [N ii]/[O i] ratio would imply an even higher shock velocity ( 80 km s-1). A possibility is that we are observing a superposition of different ionization layers. Another possibility is that the shock is taking place in partially ionized gas. Indeed, models of slow shocks in neutral gas, such as those of Hartigan et al. (1994), predict the high H/H ratios, but also very weak [N ii] emission. A shock of the same speed in ionized gas would enhance the [N ii] emission significantly, but the H/H ratio would be the radiative recombination value. A shock in partially ionized gas, could probably reproduce both the observed H/H and [N ii]/H ratios; however, to our knowledge, there are no published tabulations of models of such shocks.
For completeness, we also used our higher resolution spectrum to determine the radial velocity of the filament. To improve the precision of the measurement we adopted an improved version of the wavelength calibration procedure briefly described in Stecklum et al. (2004), which derives the dispersion curve by matching all detected night-sky emission lines with a template generated by folding the Osterbrock Sky Spectrum333Preparation of the Osterbrock Sky Spectrum files was supported by grant ATM-9714636 from the NSF CEDAR program; see http://www.nvao.org/NVAO/download/Osterbrock.html. to the observed resolution. Separate measurements of radial velocities were initially obtained for the eastern and western part of the filament in order to check for possible velocity differences between the them. [N ii] 6583, H, [N ii] 6548, [S ii]6716 and 6731 lines were used. Resulting radial velocities were VLSR = 39 4 km s-1 and 33 9 km s-1 for the eastern and western part, respectively. Since no significant difference in velocity was detected, we proceeded to an optimal extraction of the spectrum for the whole extent of the nebular emission. This yielded a radial velocity VLSR = 36.9 0.8 km s-1. The reported error is the formal one from the line fits. An inspection of the position of sky lines in the wavelength calibrated spectrum suggests that a more realistic estimate of the error is a few km s-1.
3.3 A filament of the Monogem Ring?
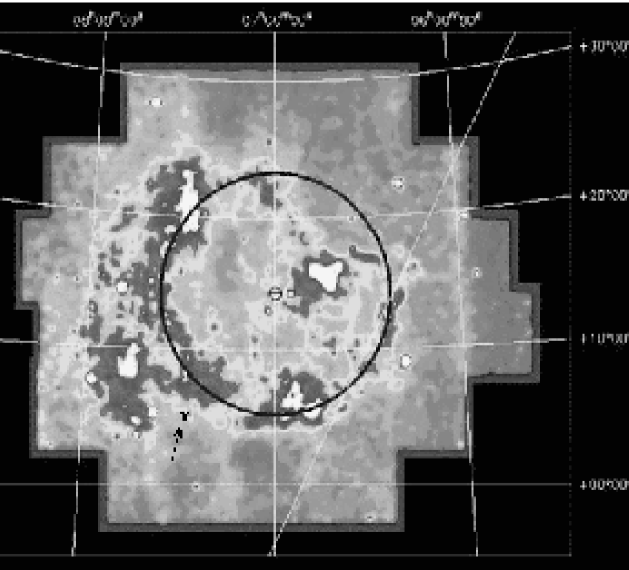
There are three main arguments why we believe that our optical filament is a part of the MR. First, its location at the south-eastern borders of the MR’s X-ray image; second, because the filament represents a nebula excited by a slow shock, as expected for this very extended SNR, which is close to pressure equilibrium with the ISM; third, since we could not find an alternative origin for the filament.
The first argument is obvious by examining Fig. 4, where the location of the filament is shown by a cross. In Plucinsky et al. (1996) a detailed comparison of the MR with e.g. and IRAS maps is presented. There, the region at and around the position of the filament is entirely inconspicuous, i.e. it neither coincides with an enhancement or obvious lack of or dust.
The second argument speaking in favour of a filament-MR association has been described above. We note that the line intensities and line ratios are strikingly similar to an other faint nebula which obviously is the outcome of the interaction of the very near (130 pc) and highly evolved SNR “Orion-Eridanus Bubble“ with a small ISM cloudlet (Zanin & Weinberger 1997); the main difference is, that the latter nebula with its intricate morphology is projected towards the centre of the SNR.
The third argument rests on our check of pulsars within a 20° radius around the filament’s position by use of the ATNF Pulsar Catalogue444http://www.atnf.csiro.au/research/pulsar/psrcat (Manchester et al. 2005): none of the one dozen pulsars (except PSR B0656+14, the pulsar associated with the MR) comes into question, either because of age and /or proper motion vector and/or distance. Also, there is no sign of any star forming region within many degrees. Further, using SIMBAD, we found no star in this region which might have blown a wind and might have created a bow-shock.
However, two objections against an association of the optical filament with the MR can be produced. First, the above mentioned lower limit to the foreground extinction of E() 0.5 mag. This value is uncomfortably high and - assuming that the value is reliable - rather speaks in favour of a much larger distance (than the distance of 300 pc for the MR) or in favour of the presence of a cold small dust cloud in the foreground (of say, 15-20 K) in order to be absent or very faint even at 100 m. Dust formed in situ, coincident with or very close to this filament cannot be excluded too. If the dust is in the foreground and has an angular extension of several arcmin, it must however be in the distance range 150 pc to 300 pc, since the F4V star GAT 1096 mentioned above appears to be unreddened and is about 150 pc distant. Nevertheless, as noticed in Sect. 3.2, the slow shock could be responsible for an increase of the Balmer decrement up to (or even above) our estimated value, without the need of assuming the presence of dust. A few discrepancies between some observed emission-line ratios and the expectations from slow shock models remain to be explained, though.
The second, less severe, objection is the overall orientation of the filament (N-S) and its curvature; from both one would not be able to deduce, even approximately, the centre of the MR. However, even a quick examination of SNRs teeming with optical filaments (like the Cygnus Loop) shows that, at the borders, one finds filaments showing all kinds of alignments and curvature. In fact, even modest variations in local density and shock velocity can lead to such phenomena.
Hence, we consider it as probable that we deal with a previously unexpected manifestation of a part of the MR in the optical. The 20′ long and 1′ wide filament has, at 300 pc distance, a length of 1.7 pc and a width of 0.09 pc. However, a more appropriate morphological description probably is, that we deal with a thin sheet of emission seen edge-on. The sub-sheets, particularly well visible in the southern straight part of the filament, might be useful for future attempts to determine their proper motion(s). A comparison of the 2m Schmidt telescope images with POSS II (DSS2) did not lead to any observable proper motion of the filament. Since the filament is located at the X-ray limb-brightened rim of the MR, its velocity seems to be almost entirely in the plane of the sky. For the epoch difference of 14 years between POSS II and the CCD imaging, an assumed tangential velocity of 100 km s-1, and a distance of 300 pc, a hard to detect proper motion of 1″ (i.e. about 1 pixel) would follow. If the tangential velocity were much bigger, a systematic shift in such an extended feature would be obvious. Therefore, the lack of any noticeable proper motion agrees with the slow shock interpretation.
4 Conclusions
We presented a previously unknown faint interstellar optical filament, located at or projected onto the south-eastern borders of the huge X-ray enhancement known as the Monogem Ring. This Ring is a huge, nearby supernova remnant of high astrophysical importance in several respects. Any optical emission was thought to be practically undetectable or very faint, since this SNR will hardly reach the radiative stage due to its expansion into ambient matter of extraordinarily low density. The location of the optical filament and the emission line ratios, which indicate the presence of a low velocity shock, render this tenuous filament in all probability to be an outlying portion of this evolved supernova remnant. Using wide-angle CCD imaging could pay off in searches for additional optical filaments along the borders of the Monogem Ring.
Acknowledgements.
We are grateful to Dr. J. Raymond, for his useful suggestions concerning shocks in partially ionized gas. This work was supported by the Austrian Science Fund (FWF), projects number P15316 and P17772. We acknowledge the use of NASA’s SkyView facility (http://skyview.gsfc.nasa.gov) located at NASA Goddard Space Flight Center and the use of the Southern H-Alpha Sky Survey Atlas (SHASSA), which is supported by the National Science Foundation. This research has made use of the SIMBAD database, operated at CDS, Strasbourg, France.References
- Blair & Long (1997) Blair, W. P. & Long, K. S., ApJS, 108, 261
- Chilingarian et al. (2003) Chilingarian, A. Martirosian, H., & Gharagyozyan, G. 2003, ApJ, 597, L129
- Erlykin & Wolfendale (2004) Erlykin, A. D., & Wolfendale, A. W. 2004, Astropart. Phys., 22, 47
- Fesen et al. (1992) Fesen, R. A., Kwitter, K. B., & Downes, R. A. 1992, AJ, 104, 719
- Gaustad et al. (2001) Gaustad, J. E., McCullough, P. R., Rosing, W., & Van Buren, D. 2001, PASP, 113, 1326
- Haffner et al. (2000) Haffner, L. M., Reynolds, R. J., & Tufte S. L. 2000, Rev.Mex. A&A (Ser. de Conf.), 9, 238
- Hartigan et al. (1994) Hartigan, P., Morse, J. A., & Raymond, J. 1994, ApJ, 436, 125
- Kobayashi et al. (2004) Kobayashi, T., Komori, Y., Yoshida, K., & Nishimura, J. 2004, ApJ, 601, 340
- Kulikov & Zotov (2005) Kulikov, G. V., & Zotov, M. Yu. 2005, preprint [astro-ph/0407138]
- Manchester et al. (2005) Manchester, R. N., Hobbs, G. B., Teoh, A. & Hobbs, M. 2005, AJ, 129, 1993
- Plucinsky et al. (1996) Plucinsky, P. P., Snowden, S. L., Aschenbach, B. et al. 1996, ApJ, 463, 224
- Raymond (1979) Raymond, J. C. 1979, ApJS, 39, 1
- Reimers & Wendker (1984) Reimers, D., & Wendker, H. J. 1984, A&A, 131, 375
- Schlegel et al. (1998) Schlegel, D. J., Finkbeiner, D. P., & Davis, M. 1998, ApJ, 500, 525
- Seeberger et al. (1996) Seeberger, R., Saurer, W., & Weinberger, R. 1996, A&AS, 117, 1
- Stecklum et al. (2004) Stecklum, B., et al. 2004, ApJ, 617, 418
- Thorsett et al. (2003) Thorsett, S. E., Benjamin, R. A., Brisken, W. F., Golden, A., & Goss, W. M. 2003, ApJ, 592, L71
- van Dokkum (2001) van Dokkum, P. G. 2001, PASP, 113, 1420
- Zanin & Weinberger (1997) Zanin, C., & Weinberger, R. 1997, A&A, 324, 1165