Magnetic fields in the Southern Galactic Plane Survey
Abstract
The Southern Galactic Plane Survey (SGPS) is a 1.4 GHz radio polarization and H i survey in a large part of the inner Galactic plane at a resolution of about an arcmin. Depolarization and Faraday rotation of polarized radiation from diffuse Galactic synchrotron emission, pulsars, and extragalactic sources can be used to infer information about the strength and structure of the Galactic magnetic field. Here, we discuss science results of the polarization data from the SGPS. We show from statistical analysis of rotation measures of polarized extragalactic sources that fluctuations in the magneto-ionized medium of the spiral arms are probably mainly caused by H ii regions, while the rotation measure fluctuations in the interarm regions may be connected to the interstellar turbulent cascade. Furthermore, the variations of rotation measure with Galactic longitude enable modeling of the large-scale component of the Galactic magnetic field, including determination of the number and location of magnetic field reversals. Finally, the SGPS is an excellent way to study subparsec-scale structure in the ionized ISM by way of depolarization studies in H ii regions.
keywords:
ISM: magnetic fields – ISM: structure – surveys – radio continuum: ISM – turbulencemhaverkorn@cfa.harvard.edu
1 Introduction
Despite the pivotal role of the Milky Way magnetic field in many physical processes such as turbulence in the interstellar medium (ISM), heating of the gas, star formation and cosmic ray propagation, details about its strength and structure remain elusive. This is in large part because of the difficulty in measuring magnetism: the known methods of observing the Galactic magnetic field are all indirect and only detect a certain component of the field, or only in a certain phase of the medium.
Magnetism in dense gas such as molecular clouds can be probed using Zeeman splitting, whereas magnetic fields in dust are revealed by optical polarization of starlight as well as submillimeter polarized emission from the dust itself (e.g. Heiles 1987). A unique method to explore magnetic fields in ionized gas in the Milky Way and external galaxies is radio polarization. The total intensity is a measure of the strength of the total magnetic field, whereas the polarized intensity gives information about the regular magnetic field component (e.g. Beck 2001). Faraday rotation and depolarization characteristics are used to study the strength and structure of both regular and random components of the magnetic field along the line of sight (Gaensler et al. 2001; Brown & Taylor 2001; Haverkorn, Katgert & de Bruyn 2004a, 2004b).
2 The Southern Galactic Plane Survey
The Southern Galactic Plane Survey (SGPS) is a survey in the neutral hydrogen line and full-polarization continuum at 1.4 GHz, obtained with the Australia Telescope Compact Array (ATCA) and Parkes 64m single dish (McClure-Griffiths et al. 2005). (However, the data presented here are solely from the ATCA.) The coverage of the SGPS is and in Galactic longitude, and in latitude, with a resolution of arcmin and a sensitivity of mJy/beam. The continuum data consist of 12 8 MHz-wide full-polarization frequency bands from 1332 MHz to 1436 MHz. The observables, Stokes parameters , , , and , are translated into polarization angle and debiased polarized intensity , assuming that circular polarization .
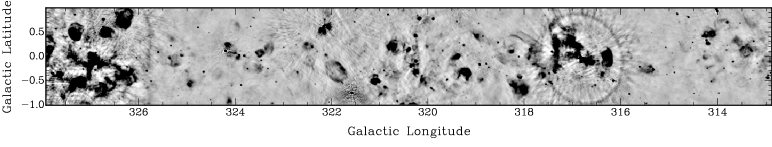
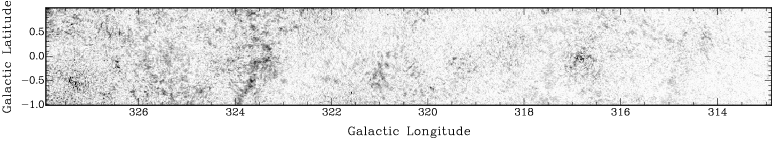
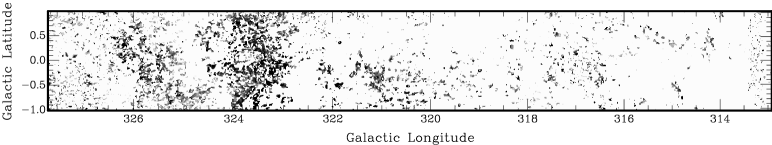
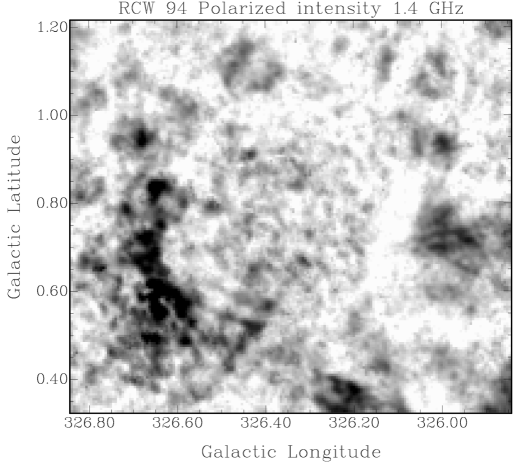
The polarized radiation is Faraday rotated111Faraday rotation of polarization angle occurs due to the birefringence of left and right circularly polarized radiation traveling through a medium which is ionized and magnetized. Faraday rotation is proportional to the wavelength of the radiation squared, i.e. . The rotation measure (RM) is given by RM , where is the electron density in the medium, the magnetic field, and the path length through the medium. while propagating through the Galactic magneto-ionized ISM, which allows determination of rotation measures (RMs). As an example, a part of the SGPS is given in Fig. 1, which shows total intensity , polarized intensity , and RM. The polarized emission consists of point sources (mostly extragalactic but also some pulsars) and diffuse emission. The diffuse polarized and total intensities are mostly uncorrelated, indicating Faraday rotation and depolarization. As can be seen from Fig. 1, RMs could only be determined for a small part of the field. In the rest of the field, there is either no polarized radiation due to complete depolarization, or due to missing short spacings and/or partial depolarization.
For a detailed description of the continuum part of the SGPS discussed here see Haverkorn et al. (2006); the neutral hydrogen part is described in McClure-Griffiths et al. (2005).
3 Results
3.1 An additional source of RM fluctuations in the spiral arms only
Statistical analysis of the RMs in the SGPS yields information about the scale of RM fluctuations in the Galactic plane. The five panels in Fig. 2 each show the structure function222The (second order) structure function SF of a function as a function of separation is defined as SF, where denotes averaging over all positions . Structure functions rise for increasingly larger fluctuations on increasingly larger scales , and saturate to a constant value at the maximum scale of structure present. of RM in five regions in the SGPS: the three top panels show interarm regions, whereas the bottom two panels represent RM data in the Crux and Carina spiral arms (Haverkorn et al. 2005).
A clear difference in the behavior of the structure functions in interarm regions and in spiral arms can be seen: the structure functions in interarm regions are all rising, whereas those in the spiral arms are consistent with flat. The rising structure functions in the interarm regions denote correlated RM fluctuations in the interarm regions up to the angular scales where the structure function turns over, i.e. several degrees. The power law in the structure function is reminiscent of turbulence, as is observed in velocity spectra, and the observed slopes agree with velocity spectra slopes for incompressible (magneto-)hydrodynamical turbulence (Kolmogorov 1941; Goldreich & Sridhar 1995). This suggests coupling of the observed density spectrum to a Kolmogorov-like velocity spectrum, which can only exist if the turbulence in the ionized ISM is nearly incompressible and not highly supersonic. Indeed, non-thermal linewidths in Galactic H seem to indicate transonic or only mildly supersonic turbulence (Reynolds 1985; Tufte, Reynolds & Haffner 1999).
On the other hand, in the spiral arms the structure functions are flat, i.e. the scale at which the structure function saturates is smaller than the scales sampled in these observations. As the RM is an integral along the whole line of sight, it is not possible to attribute a certain distance to the medium where the RM originates. However, assuming that the largest-scale structure comes from the nearby ISM, we can estimate an upper limit for the outer scale of structure in the Carina arm of about 17 pc, assuming that the nearest gas from that arm is at kpc (Russeil 2003). An obvious source for these fluctuations would be internal structure in H ii regions, which are sufficiently abundant in the spiral arms and of roughly the right size (Haverkorn et al. 2004c).

3.2 Depolarization around H ii regions
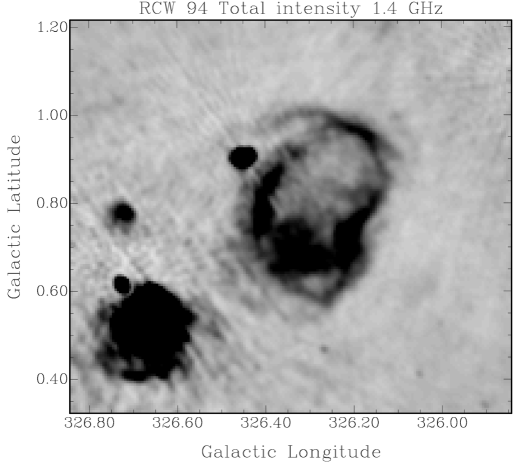
H ii regions do not emit polarized radiation. However, polarized radiation coming from behind an H ii region can be depolarized by it if strong enough fluctuations in the plasma density and/or magnetic field are present on scales smaller than the synthesized beam. From the amount of depolarization by an H ii region, combined with an estimate of its electron density, the strength of its random magnetic field and the outer scale of the fluctuations can be estimated. A beautiful example in the SGPS Test Region is shown in Fig. 3. The bottom map shows a depolarized shell around the H ii region, which extends beyond the radio continuum emission shown in the top map. This is evidence for a depolarization halo around the H ii region, probably caused by interaction with a molecular cloud (Gaensler et al. 2001). The H ii region dissociates H2 molecules from the molecular cloud, which results in a shell of H i around the H ii region, as observed (McClure-Griffiths et al. 2001).
A depolarization signature like the one observed cannot be produced by a spherical H ii region. Instead, the RM must be almost constant in the central part of the region, which is in agreement with H observations (Georgelin et al. 1994). The almost constant degree of polarization in the interior of the H ii region can be modeled with a random magnetic field of G, varying on scales of approximately 0.2 parsec (Gaensler et al. 2001).
3.3 Probing the regular Galactic magnetic field
As opposed to the diffuse polarized emission discussed in Section 3.2, RMs of unresolved polarized extragalactic sources do not suffer from depolarization. Therefore, RMs of polarized extragalactic sources represent the complete line of sight through the Milky Way. This, combined with their abundance in the SGPS, makes them ideal probes of the regular component of the Galactic magnetic field.
Fig. 4 shows the distribution of RMs of extragalactic point sources as a function of Galactic longitude, binned in 9\degr bins with 3\degr separation to average out the small-scale structure and the intrinsic RM of the sources (RM rad m-2). From the Figure, smooth large-scale structure on scales of tens of degrees is evident, believed to be caused by the magnetic field structure along the spiral arms. E.g. at longitude , the smoothed RM changes sign, which means that the magnetic field averaged over the line of sight changes direction. A regular sign change in RM like this can only happen if there is a large-scale reversal of the magnetic field direction at this longitude. This reversal near the Carina arm has been noted many times before (see e.g. Vallée 2002).
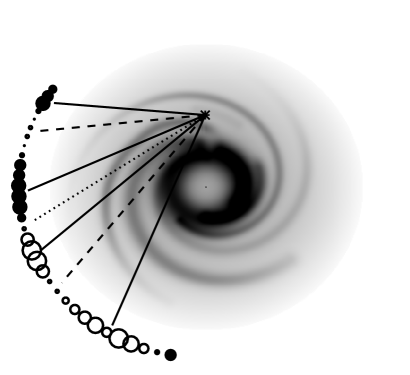
The lines in Fig. 4 mark positions where the RM is extreme or passes through zero. The directions of these lines of sight are given as well in Fig. 5, which is a bird’s eye view of the Milky Way. The gray scale denotes the electron density model NE2001 (Cordes & Lazio 2003) and the circles represent binned RMs of extragalactic sources set at an arbitrary distance outside the Galaxy. From Fig. 5 it can be seen that RM is roughly maximum at sight lines through spiral arms in the NE2001 model, and minimum in interarm regions. A smooth decrease of RM to almost zero can only occur if there are large-scale magnetic field reversals along the line of sight, although not necessarily on Galactic scales. Fitting the RM profile to models of the regular magnetic field yields information about the strength of the regular magnetic field component, and about the number and location of reversals (Brown et al. 2006).
Note that although reversals in the regular magnetic field direction must be on scales of tens of degrees to cause these large-scale RM variations, the sampled Galactic longitude range is too small to be able to say if the reversal or reversals trace the spiral arms around the entire Galaxy. Galaxy-scale reversals in magnetic field that follow the spiral arms seem to fit the present data, however, only very few reversals have been observed in external galaxies (Beck 2001).

Acknowledgements.
The ATCA is part of the Australia Telescope, which is funded by the Commonwealth of Australia for operation as a National Facility managed by CSIRO. MH and BMG acknowledge support from the National Science Foundation through grant AST-0307358 to Harvard University.References
- [Beck(2001)] Beck, R. 2001: SSRv 99, 243
- [Brown & Taylor(2001)] Brown, J. C., & Taylor, A. R. 2001, ApJ, 563, L31
- [Brown et al.(2006)] Brown, J. C., et al.: 2006, in prep
- [Cordes & Lazio(2003)] Cordes, J. M., Lazio, T. J. W.: 2003, preprint (astro-ph/0301598)
- [Gaensler et al.(2001)] Gaensler, B. M., Dickey, J. M., McClure-Griffiths, N. M., Green, A. J., Wieringa, M. H., Haynes, R. F.: 2001, ApJ 549, 959
- [Georgelin et al.(1994)] Georgelin, Y. M., Amram, P., Georgelin, Y. P., Le Coarer, E., Marcelin, M.: 1994, A&AS 108, 513
- [Goldreich & Sridhar(1995)] Goldreich, P., Sridhar, S.: 1995, ApJ 438, 763
- [Haverkorn et al.(2004a)] Haverkorn, M., Katgert, P., de Bruyn, A. G.: 2004a, A&A 427, 169
- [Haverkorn et al.(2004b)] Haverkorn, M., Katgert, P., de Bruyn, A. G.: 2004b, A&A 427, 549
- [Haverkorn et al.(2004c)] Haverkorn, M., Gaensler, B. M., McClure-Griffiths, N. M., Dickey, J. M., Green, A. J.: 2004c, ApJ 609, 776
- [Haverkorn et al.(2005)] Haverkorn, M., Gaensler, B. M., Brown, J. C., Bizunok, N. S., McClure-Griffiths, N. M., Dickey, J. M., Green, A. J.: 2005, ApJ submitted
- [Haverkorn et al.(2006)] Haverkorn, M., Gaensler, B. M., McClure-Griffiths, N. M., Dickey, J. M., Green, A. J.: 2006, in prep
- [Heiles(1987)] Heiles, C.: 1987, in Interstellar processes. Dordrecht, D. Reidel Publishing Co.
- [Kolmogorov(1941)] Kolmogorov, A. N.: 1941, Dokl. Akad. Nauk SSSR 30, 301
- [McClure-Griffiths et al.(2001)] McClure-Griffiths, N. M., Dickey, J. M., Gaensler, B. M., Green, A. J., Haynes, R. F., Wieringa, M. H.: 2001, PASA 18, 84
- [McClure-Griffith et al.(2005)] McClure-Griffiths, N. M., Dickey, J. M., Gaensler, B. M., Green, A. J., Haverkorn, M., Strasser, S.: 2005, ApJS 158, 178
- [Reynolds(1985)] Reynolds, R. J.: 1985, ApJ 294, 256
- [Russeil(2003)] Russeil, D.: 2003, A&A 397, 133
- [Taylor et al.(2003)] Taylor, A. R., Gibson, S. J., Peracaula, et al.: 2003, AJ 125, 3145
- [Tufte et al.(1999)] Tufte, S., Reynolds, R., Haffner, M.: 1999, in Interstellar Turbulence, eds. J. Franco and A. Carramiñana, Cambridge University Press
- [Vallée(2002)] Vallée, J. P.: 2002, ApJ 566, 261