22email: mribo@discovery.saclay.cea.fr 33institutetext: Departamento de Física, Ingeniería de Sistemas y Teoría de la Señal, Escuela Politécnica Superior, Universitat d’Alacant, Ap. 99, 03080 Alicante, Spain
33email: [ignacio;jmt]@dfists.ua.es 44institutetext: Institut de Ciència dels Materials, Universitat de València, PO Box 22085, 46071 Valencia, Spain
44email: pere.blay@uv.es 55institutetext: IESL, Foundation for Research and Technology, 71110 Heraklion, Crete, Greece 66institutetext: University of Crete, Physics Department, PO Box 2208, 710 03 Heraklion, Crete, Greece
66email: pau@physics.uoc.gr
Wind accretion in the massive X-ray binary 4U~2206+54: abnormally slow wind and a moderately eccentric orbit
Massive X-ray binaries are usually classified by the properties of the donor star in classical, supergiant and Be X-ray binaries, the main difference being the mass transfer mechanism between the two components. The massive X-ray binary 4U~2206+54 does not fit in any of these groups, and deserves a detailed study to understand how the transfer of matter and the accretion on to the compact object take place. To this end we study an IUE spectrum of the donor and obtain a wind terminal velocity () of 350 km s-1, which is abnormally slow for its spectral type. We also analyse here more than 9 years of available RXTE/ASM data. We study the long-term X-ray variability of the source and find it to be similar to that observed in the wind-fed supergiant system Vela~X-1, reinforcing the idea that 4U~2206+54 is also a wind-fed system. We find a quasi-period decreasing from 270 to 130 d, noticed in previous works but never studied in detail. We discuss possible scenarios for its origin and conclude that long-term quasi-periodic variations in the mass-loss rate of the primary are probably driving such variability in the measured X-ray flux. We obtain an improved orbital period of d with maximum X-ray flux at MJD 51856.60.1. Our study of the orbital X-ray variability in the context of wind accretion suggests a moderate eccentricity around 0.15 for this binary system. Moreover, the low value of solves the long-standing problem of the relatively high X-ray luminosity for the unevolved nature of the donor, BD~+53$°$2790, which is probably an O9.5 V star. We note that changes in and/or the mass-loss rate of the primary alone cannot explain the different patterns displayed by the orbital X-ray variability. We finally emphasize that 4U~2206+54, together with LS~5039, could be part of a new population of wind-fed HMXBs with main sequence donors, the natural progenitors of supergiant X-ray binaries.
Key Words.:
X-rays: binaries – X-rays: individual: 4U~2206+54 – stars: individual: BD~+53$°$2790 – stars: winds, outflows – stars: variables: general – stars: emission-line, Be1 Introduction
High Mass X-ray Binaries (HMXBs) are X-ray sources composed of an early-type massive star and an accreting compact object, either a neutron star (NS) or a black hole (BH). Depending on the nature of the companion, HMXBs are traditionally divided (see Corbet 1986) into three groups: Classical Massive X-ray binaries, Supergiant X-ray binaries (SXBs) and Be/X-ray binaries (BeXBs).
Classical Massive X-ray binaries are a very small group (in the Galaxy, only Cen~X-3) of very bright ( erg s-1) persistent X-ray sources (Lewin et al. 1995). They have close orbits, with short orbital periods, and accretion is believed to occur through localised Roche-lobe overflow leading to the formation of an accretion disc. Orbits have circularised and, when the compact object is an NS, it has been spun up to short spin periods, as a result of angular momentum transfer from the accreted matter on to the compact object.
In SXBs, the X-ray source is believed to be fed by direct accretion from the relatively dense wind of an OB supergiant, with little angular momentum transfer (see Waters & van Kerkwijk 1989), resulting in moderately high X-ray luminosities, erg s-1. The orbital periods of these systems are typically d. Some orbits are almost circular (Corbet & Mukai 2002), but finite eccentricities have been measured for several systems, some of them rather high (e.g., for 4U 153852; Clark 2000). The spin periods of systems with NSs are rather long, s.
In BeXRBs, an NS orbits an unevolved OB star surrounded by a dense equatorial disc. These systems can be bright X-ray transients or persistent low luminosity erg s-1 sources. With the exception of a few peculiar cases like the microquasar LS~I~+61~303 (Massi et al. 2004, and references therein) all of them appear to be X-ray pulsars. Their orbital eccentricities range from close to zero to very high, leading to the hypothesis that different kinds of supernova explosion are possible (Pfahl et al. 2002a), and their orbital periods are generally of the order of some tens of days. Spin periods also cover a wide range and there is a strong statistical correlation between and (Corbet 1986), suggesting effective transfer of angular momentum from the material accreted.
The peculiar HMXB 4U~2206+54 is difficult to place within this picture. It is a persistent source, with – erg s-1 and variability on timescales of hours similar to those of wind accreting systems. However, it is one of the few HMXBs not displaying X-ray pulsations, although there is strong evidence that the compact object is an NS (Torrejón et al. 2004; Blay et al. 2005). The X-ray flux is modulated with a periodicity of d (Corbet & Peele 2001), which can only be interpreted as the orbital period. The mass donor in 4U~2206+54, BD~+53$°$2790, is neither a supergiant nor a Be star, but a peculiar late O-type star, whose spectrum does not admit a standard spectral classification (Negueruela & Reig 2001). While most criteria favour an O9.5 V star, there are some indications of a much heavier mass loss than expected for that spectral type, such as strong H emission, a P-Cygni profile in He ii 4686 and a very strong P-Cygni profile in the ultraviolet C iv resonance doublet, suggesting a more luminous star (Negueruela & Reig 2001; Blay et al. 2006). If it has the luminosity of a normal O9.5 V star, it is located at a distance of 2.6 kpc (if it were an O9.5 III star it would be located at 4.8 kpc).
In a recent paper we used INTEGRAL and VLA data to constrain the nature of the compact object in 4U~2206+54 (Blay et al. 2005). Based on existing radio/X-ray correlations for black holes in the low/hard state, we excluded the black hole scenario. On the other hand, INTEGRAL is the third X-ray satellite providing marginal evidence for the presence of a cyclotron absorption line, leading to an NS with G. However, two problems persisted in the NS scenario: the lack of X-ray pulsations and an X-ray luminosity one to two orders of magnitude higher than expected.
Here we analyse an ultraviolet spectrum obtained with the International Ultraviolet Explorer (IUE), to better constrain the wind properties of the donor, and more than 9 years of data from the Rossi X-ray Timing Explorer (RXTE) to derive information on the mass loss from the optical star and the binary parameters. This work is organised as follows: in Sect. 2 we analyse and model the IUE spectrum, in Sect. 3 we present the RXTE data, in Sect. 4 we study and discuss the long-term X-ray variability, in Sect. 5 we focus on the orbital X-ray variability, and discuss the long-term wind variability in Sect. 6. We stress the existence of a population of wind-fed HMXBs with main sequence donors in Sect. 7 and summarise our conclusions in Sect. 8.
2 A measure of the wind terminal velocity
The observed X-ray luminosity of 4U~2206+54 is in the range 1035–1036 erg s-1 (Blay et al. 2005). In contrast, the expected Bondi-Hoyle accretion luminosity for a canonical NS in a 9.6 d orbit around a low-luminosity O9.5 III–V star, with a typically fast wind of 1500 km s-1, is of the order of or below 1034 erg s-1. This value is critically influenced by the wind terminal velocity, . To obtain a measure of for the wind of BD~+53$°$2790 we have analysed the only publicly available high-resolution UV spectrum of this star, obtained with IUE on 1990 June 18–19, with a total exposure time of 20 ks (middle time at JD 2 448 061.59). This is the high-dispersion IUE spectrum SWP 39112, described in Negueruela & Reig (2001), but we have used the new reduction available at the INES111http://ines.vilspa.esa.es/ines/ database. A heliocentric velocity correction of 16.37 km s-1 has already been applied to the source spectrum, and we have further applied a correction of 62.7 km s-1 to account for the radial velocity of BD~+53$°$2790 (Abt & Bautz 1963). We note that this value is the average of three measurements spanning 55.0–72.2 km s-1, obtained from September 1961 to May 1962 and covering different orbital phases (the precise phase of each data point is uncertain due to the error in the orbital period and the huge timespan between these observations and the current ephemeris). Moreover, a preliminary radial velocity curve (Blay 2006) shows total relative variations up to 30 km s-1, with a relative mean value of 010 km s-1 around the orbital phase when the IUE spectrum was obtained. Therefore, we estimate that the radial velocity correction is accurate to 10 km s-1.
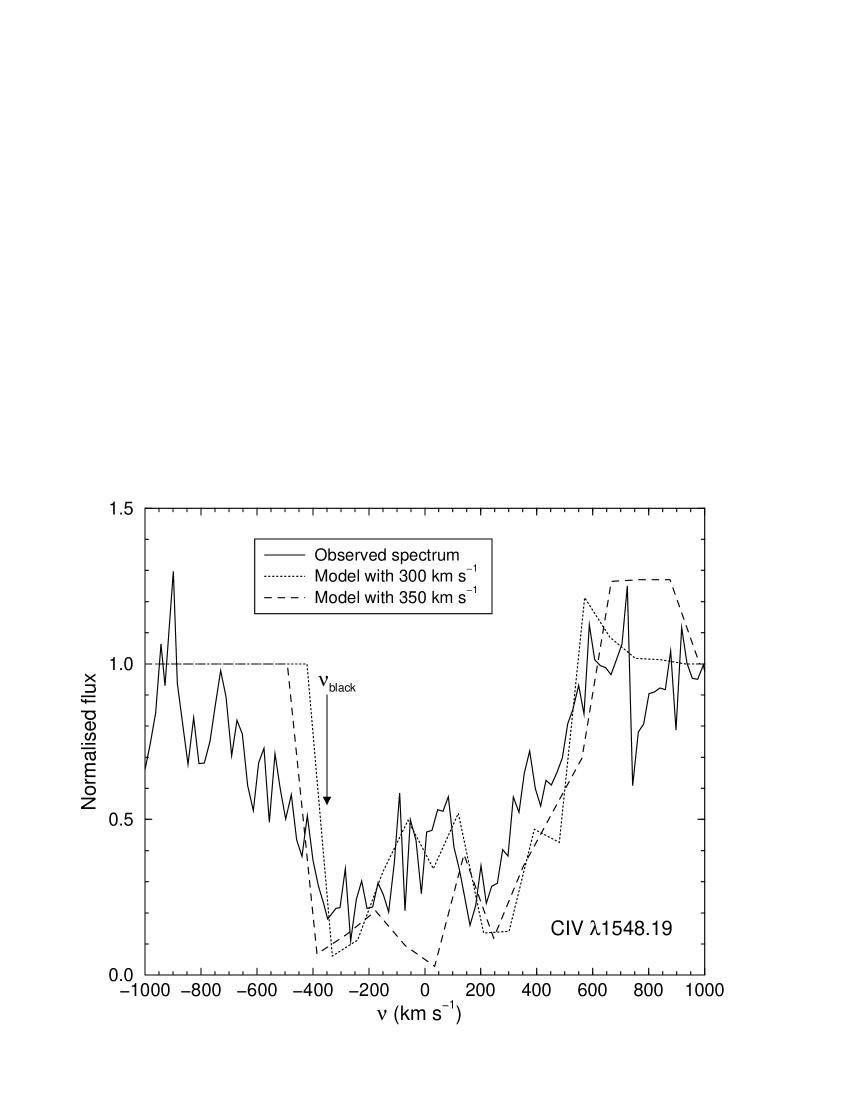
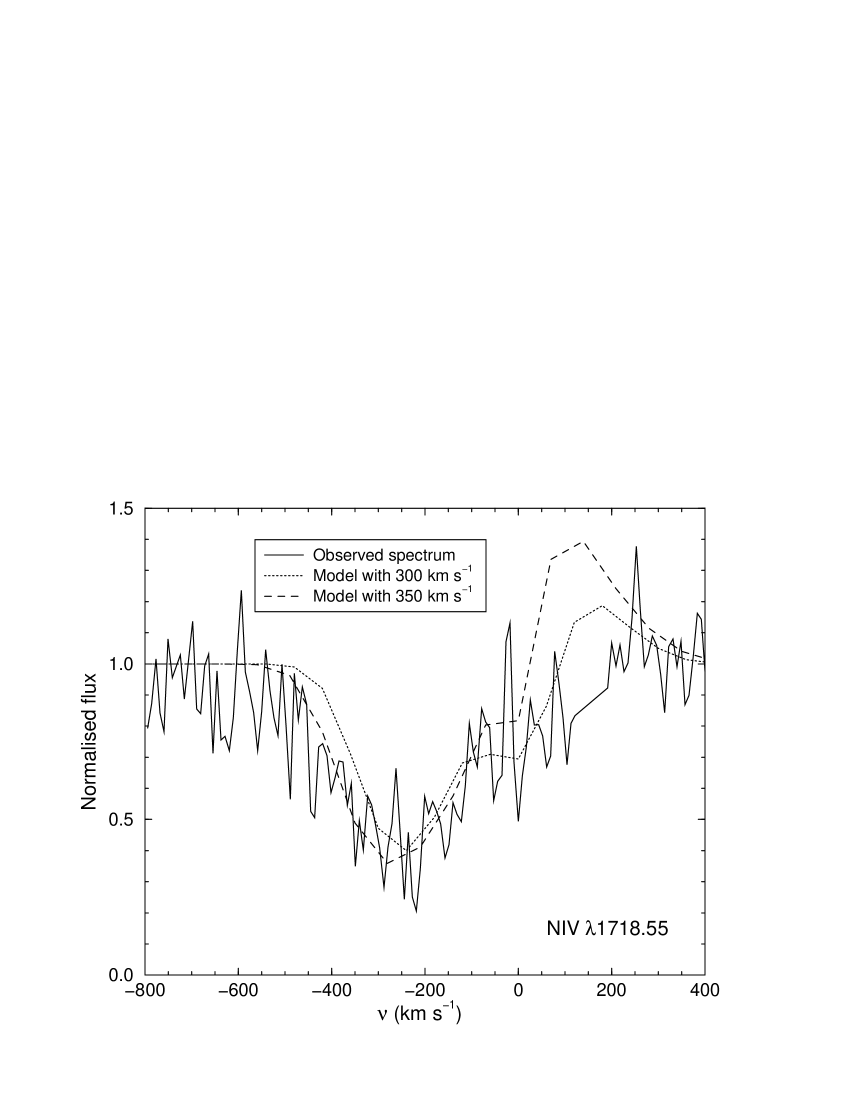
We have followed the SEI (Sobolev with Exact Integration of the transfer equation) method, as outlined in Lamers et al. (1987) in order to calculate theoretical wind line profiles. This method is a modification of the Sobolev approximation to the stellar wind problem (see Sobolev 1960). The procedure followed was to create a grid of theoretical profiles with different wind and photospheric parameters and then match them all against the observed profile. The indications from the extensive study of the stellar winds of Groenewegen et al. (1989) were followed and the parameters listed there for an O8 V star were chosen as initial values to build our grid of models. Theoretical models could not reproduce the data when using terminal velocities above 500 km s-1. Terminal velocities in the range 300–350 km s-1 and a turbulent motion with a mean velocity in the range 20–100 km s-1 yielded line profiles which resulted in the best match against the observed profiles. We show in Fig. 1 an example of two UV lines from BD~+53$°$2790 matched against two theoretical profiles, calculated for 300 and 350 km s-1. For the C iv 1548.19–1550.76 doublet an upper limit for the turbulent velocity of 80 km s-1 was found, while for the N iv 1718.55 line this limit was found to be 100 km s-1. We note that, due to the presence of many wind features in this spectral region and the relatively poor signal-to-noise ratio of the IUE spectrum, the position of the photospheric continuum is quite uncertain, and the choice of normalisation parameters can affect our results. However, the C iv doublet is saturated, and Prinja et al. (1990) showed that the point where saturated wind lines turn upwards towards the continuum level, namely , is a good estimator of . As shown in Fig. 1 left, the C iv doublet provides km s-1, in good agreement with the above estimates by using the SEI method. Finally, we used the automatic fitting procedure developed by Georgiev & Hernández (2005), based on genetic algorithms, which provides km s-1 for the C iv doublet and km s-1 for the N iv line, also in good agreement with the values quoted above.
Although an accurate measurement of the wind terminal velocity in BD~+53$°$2790 is prevented by the relatively noisy IUE spectrum, we stress that only models with km s-1 could reproduce the wind line positions and widths. This value is much lower than the range of 1120–1925 km s-1 for O9 V stars or the 1275–1990 km s-1 range for O9.5 III stars (Prinja et al. 1990). Therefore, we conclude that the stellar wind of BD~+53$°$2790 is abnormally slow for its spectral type. A similarly slow wind of 400 km s-1 has been measured in the O9.5 V extreme fast rotator HD~93521 (Prinja et al. 1990, excluded from their mean because it had very peculiar profiles; see also Howarth & Reid 1993 and Massa 1995). Another O-type star with an abnormally slow wind, of 510 km s-1 (Prinja et al. 1990), is HD~37022 (also known as $θ^1$~Ori~C), a spectral variable in the range O4–7 V (Walborn 1981; Smith & Fullerton 2005), whose anomalous properties are interpreted in terms of a misaligned magnetic rotator. Interestingly, Blay et al. (2006) have found that BD~+53$°$2790 has a high rotational velocity, km s-1, and have suggested a possible connection with HD~37022 based on their optical characteristics.
3 The RXTE/ASM data
In order to study the long-term X-ray behaviour of 4U~2206+54 we have analysed X-ray data in the energy range 1.3–12.1 keV obtained with the All Sky Monitor (ASM) on board RXTE. The RXTE/ASM data used here spans from 1996 late February to 2005 late July (from MJD 50135 to MJD 53576), amounting to a total of 3441 days or 9.42 years (the previous analysis by Corbet & Peele 2001 was performed with 5.5 years of data). Each data point in the original lightcurve represents the fitted source flux of a 90 s pointing or ‘dwell’ on the source, with a mean of 18.3 dwells per day in the case of 4U~2206+54. We have also analysed the one-day average lightcurve of individual RXTE/ASM dwells (see Levine et al. 1996 for details). This lightcurve contains 3315 flux measurements, with data lacking only for 126 days (less than 4% of the total). Since 4U~2206+54 is a weak X-ray source, when there are only a few individual dwells per day the one-day average flux derived is not very reliable. To avoid spurious points with large error bars, we have also constructed a one-day average lightcurve with at least 5 dwells per day, which contains 3050 data points (92% of the one-day average data), and another lightcurve with at least 10 dwells per day, which contains 2608 data points (79% of the one-day average data). We will consider all these four lightcurves when performing the timing analysis, and we will refer to them as DBD (Data By Dwell), ODA (One-Day Averages), 5D-ODA (5 Dwell ODA) and 10D-ODA (10 Dwell ODA).

The resulting 10D-ODA lightcurve is shown in Fig. 2. The source is clearly detected during most of the 9.42 year coverage, with a mean count rate of count s-1 (using weights as 1/; the plus and minus standard deviation of the mean have been computed separately for the points above and below it). Assuming a distance of 2.6 kpc to 4U~2206+54 (Blay et al. 2006), and taking into account that the average Crab count rate in the RXTE/ASM is 75.5 count s-1, we obtain a weighted mean and standard deviation of the absorbed X-ray luminosity of erg s-1. We note that using a hydrogen column density of atoms cm-2 (Torrejón et al. 2004) and the formalism described in Gallo et al. (2003), the unabsorbed luminosity would only be around 5% higher.
4 Long-term X-ray variability
Long-term variability of the mean X-ray flux is clearly seen in the RXTE/ASM data, as pointed out by Corbet & Peele (2001). To display this variability more clearly, we plot in Fig. 3a the same data as in Fig. 2 but after averaging (using weights as 1/) all data points within a running window of 30-day length (corresponding to 3 times the orbital period). The count rate varies between 0.009 and 0.9 count s-1, with a mean of 0.31 and a standard deviation of 0.17. For comparison, the mean obtained with adjacent 30 d windows is 0.31, with a standard deviation of 0.16 and an error of the mean of 0.015, implying that the variability is real at an 11- significance. Similar results are obtained by using running windows of 20 and 10 days, although spurious points reaching even negative flux values appear, due to the presence of intervals with few data points in the lightcurve. Therefore, we used the data shown in Fig. 3a to compute the range in luminosities, which turns out to be – erg s-1. This confirms the flux variations with a factor of 100 on timescales of years noted by Masetti et al. (2004) when comparing data from EXOSAT, RXTE and BeppoSAX, but now obtained with the same satellite and detector (although the value of the minimum flux is uncertain in this case).

This kind of lightcurve does not show any resemblance to that of any known Be/X-ray binary, persistent or transient. It is, however, similar to those of wind-accreting X-ray binaries. As a comparison, we have plotted in Fig. 3b the RXTE/ASM lightcurve of the wind accretor Vela~X-1, averaged and smoothed in exactly the same way as that of 4U~2206+54 (after excluding data taken during X-ray eclipses, which otherwise translates into a mean reduction in flux of 1.2 count s-1). Vela X-1 has rather similar orbital parameters to 4U~2206+54: it contains an NS ( s) in a low eccentricity orbit (, d) around the B0.5Ib star HD~77581 (see Quaintrell et al. 2003, and references therein). As can be seen, the lightcurve obtained for Vela~X-1 shows less variability (a factor 4) but, like 4U~2206+54, it also experiences recurrent peaks and troughs, with no clear periodicity (see next subsection).
As noted by Negueruela & Reig (2001) and by Blay et al. (2006), BD~+53$°$2790 is not a Be star, but a peculiar O9.5 V star with a relatively strong stellar wind. Therefore the comparison to the SXBs is fully justified, as the mass-loss mechanism in the mass donors is likely to be identical, i.e., a radiative stellar wind (see Kudritzki & Puls 2000, and references therein). The main difference between the two kinds of systems is the higher luminosity class of the mass donors in SXBs. This higher luminosity class will result in a higher X-ray luminosity through two effects: 1) a higher mass-loss rate at the base of the wind and 2) a larger radius for the mass donor, which will place the NS closer to the surface of the OB star and hence in the region where the wind is denser and slower (although we have shown in Sect. 2 that the wind of BD~+53$°$2790 is abnormally slow). Apart from this difference, all available evidence supports the idea that 4U~2206+54 is a wind accretor, not fundamentally different from the SXBs.
We have inspected if there is any trend of hardening or softening of the spectrum as the flux increases on these long-term timescales. We have done so by computing all possible hardness ratios that can be constructed with the three energy bands of RXTE/ASM data (1.3–3.0, 3.0–5.0, and 5.0–12.1 keV). We have worked with the 10D-ODA lightcurve before and after smoothing. All the results obtained are compatible, within errors, with a constant hardness as the flux increases, although we emphasize that the poor statistics are a strong limitation of the analysis of RXTE/ASM data of 4U~2206+54.
4.1 Timing analysis
We have searched for periodic signals in all lightcurves using standard techniques like the Phase Dispersion Minimisation (PDM, Stellingwerf 1978) and the CLEAN algorithm (Roberts et al. 1987). The periodograms obtained for the 10D-ODA lightcurve between 2 and 1000 d are shown in Fig. 4. As can be seen, the orbital period of 9.56 d is clearly detected with both methods (with two subharmonics in the case of PDM). On the other hand, significant signal is detected simultaneously with both methods around trial periods of 133, notably 267, 488 and 800 d. PDM also detects a 1-year signal, with a harmonic and a subharmonic, which is probably the result of our window function, since it is not detected by CLEAN. Apart from the orbital period, these trial periods are also clearly detected when analysing the smoothed data shown in Fig. 3a. We note that a peak at a frequency of 10-3 d-1 (corresponding to a period of 250 d) was already present in the power spectrum presented by Corbet & Peele (2001) in their figure 2, and also noticed by Masetti et al. (2004), who questioned if it could be a superorbital periodicity (see Clarkson et al. 2003a, b, for recent discussions on the topic).

To investigate further the long-term variability, we have split the 10D-ODA lightcurve in 2 equal data sets spanning 1720 d each, and then re-applied the PDM and CLEAN algorithms. The PDM results show a period in the range 255–265 d in the first part of the lightcurve, with a harmonic and two broad subharmonics. For the second part of the lightcurve there are minima around 180 and 415 d, and no significant signal around 260 d. The output of the CLEAN algorithm reveals similar differences: 256 d, its harmonic and less significant peaks for the first data set, and different peaks at 90, 180 d, and many less significant peaks in the second data set. All this indicates that we are not dealing with a periodic signal of 260 d, but with a quasi-periodic one, present in the first part of the lightcurve but not in the second one, and that the flux varies on timescales of hundreds of days. This quasi-period of 260 d can be easily seen as alternative local maxima and minima in Fig. 3a during the first 5 years of data (similar to the data analysed by Corbet & Peele 2001). We note that very similar results to the ones discussed above are obtained when analysing the DBD, ODA and 5D-ODA lightcurves.
A better understanding of how this quasi-period changes with time can be achieved with a two-dimensional time-period method. For this purpose, we have used the method presented by Szatmáry et al. (1994). We compute , which we will call the wavelet amplitude. This value will be high if the signal contains a cycle frequency at the time , and low otherwise. We have considered trial periods from 20 to 800 d, with a resolution of 1 d, and a total of 1720 times of analysis have been taken into account, which corresponds to one point every 2 d. We show in Fig. 5 the wavelet amplitude map obtained, where white coloured areas mean significant trial periods and black areas non-significant ones, while the two grey triangular areas have not been explored due to the presence of severe border effects (see Ribó et al. 2001 for a detailed discussion of this issue). One can see the variation of the long-term 200 d quasi-period over time, as well as the signal around 500 d and marginally at around 800 d.
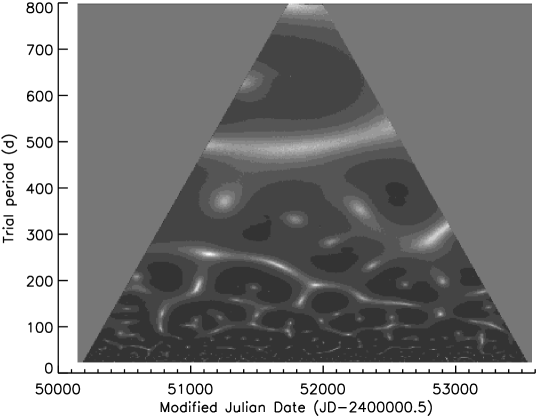
In Fig. 6 we plot, for any considered time in Modified Julian Date, the trial period that displays the maximum wavelet amplitude. A decreasing quasi-period is present in the data, and excluding very short trial periods found at the limits of the data set and eventual jumps to the 500 d signal, it varies from 270 d at the beginning of the observations to 130 d at the end. Very similar results are obtained when performing the same kind of analysis but using the smoothed data shown in Fig. 3a.
In contrast, a similar analysis of the Vela~X-1 data with PDM, CLEAN and the wavelet based method reveals no such kind of long-term quasi-periodic variability in this supergiant binary system.
4.2 Superorbital quasi-period or wind variability?
Superorbital periods with in the range 30–240 d and values in the range 5–22000 have been found in a group of around 15 X-ray binaries (see Wijers & Pringle 1999; Ogilvie & Dubus 2001, and references therein). These superorbital periods have often been explained as a precession of the accretion disc due to warping induced as a consequence of illumination from the central source. In the case of 4U~2206+54, if the quasi-periodic signal were a superorbital period, the ratio would decrease from 28 to 14 during the time interval covered by the RXTE/ASM data. The variability of this quasi-period appears much higher than in other systems. Interaction of modes could be invoked to explain such variations, and even the jumps to higher values of the period (Ogilvie & Dubus 2001). However, as discussed in Torrejón et al. (2004), there is no evidence for the existence of an accretion disc in 4U~2206+54, and conversely, there are strong reasons to think that the X-ray emission originates because of direct accretion on to the surface of an NS from the stellar wind, as discussed above and in Sect. 5. Therefore, we are inclined to think that the long-term X-ray variability we see is due, as suggested by Masetti et al. (2004), to variations in the wind of the primary.

Erratic variability on timescales of hours has been detected with RXTE and BeppoSAX, and attributed to wind density inhomogeneities. While in the first case Negueruela & Reig (2001) reported an increase of the 5–10/2–5 keV hardness ratio with increasing 2.5–30 keV intensity, in the second one Masetti et al. (2004) report a constant behaviour for the same hardness ratio with increasing 2–10 keV intensity. This later result suggests that variations in the accretion rate due to variations in the wind density do not change the slope of the soft X-ray spectrum. We have used the same scheme of hardness ratio versus intensity as in the later case with the RXTE/ASM and found the same behaviour. Despite the large errors present in these data, this would be consistent with the hypothesis that long-term X-ray variability is due to a changing wind of the primary.
Interestingly, correlated variations between a variable emission component in H and X-ray flux have been observed on timescales of years in the wind-fed HMXB system LS~5039/RX~J1826.2$-$1450 (Reig et al. 2003; McSwain et al. 2004; Bosch-Ramon et al. 2005). By analogy, the long-term variations in the X-ray flux from 4U~2206+54 might be due to changes in the wind of the mass donor BD~+53$°$2790. Stochastic variability in the wind may easily explain variations in the X-ray flux on timescales of hundreds of days with no periodicity. It is, however, much less obvious what physical mechanism could result in the quasi-periodic variability observed in 4U~2206+54.
BD~+53$°$2790 is too early to fit within any known category of pulsating stars – no Cep star is known with a spectral type earlier than B0 (Lesh & Aizenman 1973; Tian et al. 2003). Moreover, the timescales of variability are much longer than in any B-type pulsator of any kind (Waelkens et al. 1998). The possibility that non-radial pulsation activity is present in the Oef star BD~+60$°$2522 has been suggested to explain variability on time-scales of hours (Rauw et al. 2003), but the variability in BD~+53$°$2790 has a timescale more typical of Mira variables.
Although clearly BD~+53$°$2790 cannot share a physical mechanism with Mira variables, there must be a physical reason driving the long-term quasi-periodic variability that we have detected. Long-term (quasi-)periodicities have been observed in a few other peculiar O-type stars, such as HD~108 (Nazé et al. 2001). The recent discovery of a 538-d recurrence in the spectral changes of the Of?p star HD 191612 (Walborn et al. 2004) represents another interesting example of long-term periodicity of unclear origin. While for HD 191612, the possibility that a binary companion in a very eccentric orbit drives the changes is tenable, the quasi-periodic changes in BD~+53$°$2790 cannot be explained by a hypothetical third body in the system.
Whatever the physical driver, if the changes in the X-ray flux are associated with variability in the mass loss of BD~+53$°$2790, the average X-ray flux of 4U~2206+54 may be a good tracer of the recent wind history of the donor. Taking into account the observed correlation between H emission and X-ray flux in LS~5039, it may be worth considering the possibility that, at least in well detached HMXBs with wind accretion, X-ray monitoring might provide information on the long-term evolution of wind characteristics.
However, the existence of chaotic short-term variability on timescales from minutes to days in the X-ray flux from 4U~2206+54 (Negueruela & Reig 2001; Torrejón et al. 2004; Masetti et al. 2004) prevents the comparison between available optical spectroscopy and X-ray flux measurements taken even a few hours apart. Clearly, a detailed multiwavelength campaign has to be undertaken to be able to fully interpret the data in each energy domain.
5 Orbital X-ray variability
Corbet et al. (2000) performed a preliminary analysis of 4.5 years of RXTE/ASM data of 4U~2206+54 (after correction from a wrong position by 0.5 in the survey catalogue). They found a quasi-sinusoidal modulation with a period of 9.5700.004 d, and suggested it could be due to orbital motion. Later on, Corbet & Peele (2001) performed a detailed analysis of 5.5 years of RXTE/ASM data and refined this value to 9.5680.004 d. The folded lightcurve appeared again quasi-sinusoidal, and they derived an epoch of maximum X-ray flux at MJD 51006.10.2.
5.1 Timing analysis
As already explained in Sect. 4.1, we have performed a detailed timing analysis of the currently available 9.42 years of RXTE/ASM data. The orbital period is significantly detected in all data sets and using both the PDM and CLEAN algorithms. Since the PDM is an epoch folding method and there is clearly a great deal of long-term variability, we have preferred to trust the results obtained with CLEAN. We note that, since the folded lightcurve is quasi-sinusoidal, CLEAN is well suited for this analysis (see, e.g., Otazu et al. 2002, 2004). The ODA and 5D-ODA lightcurves contain spurious data, and since the results obtained with CLEAN may be influenced by them (because weights are not used), we have not considered these cases. For the DBD and 10D-ODA cases, the results obtained are 9.55890.0005 and 9.55930.0005 d, respectively. Fitting a cosine function to the DBD lightcurve provides a period of d and an epoch of maximum X-ray flux at MJD 51856.60.1. This will be the ephemeris considered hereafter. We note, however, that splitting the DBD lightcurve in two halves provides cosine fits with periods of d and d, respectively, with a difference of 0.017 d, much higher than the error of the fit quoted above. This is probably due to the superposition of long-term variability.

| Spectral type | Ratio in | ||||||||||
|---|---|---|---|---|---|---|---|---|---|---|---|
| () | () | ( yr-1) | (km s-1) | (d) | (erg s-1) | (erg s-1) | (erg s-1) | ||||
| O9.5 V | 16.0 | 7.3 | 3.010-8 | 350 | 0.8 | 9.5591 | 0.15 | 5.531035 | 2.951035 | 1.87 | 4.061035 |
| 500 | 0.8 | 2.191035 | 1.121035 | 1.96 | 1.571035 | ||||||
| 1000 | 0.8 | 0.221035 | 0.101035 | 2.10 | 0.151035 | ||||||
| O9.5 III | 20.8 | 13.3 | 2.010-7 | 350 | 0.8 | 9.5591 | 0.15 | 33.4 1035 | 17.9 1035 | 1.86 | 24.7 1035 |
| 500 | 0.8 | 15.2 1035 | 7.541035 | 2.02 | 10.8 1035 | ||||||
| 1000 | 0.8 | 1.851035 | 0.791035 | 2.34 | 1.211035 | ||||||
| Vela X-1 (80°, 1.96 ) | 24.2 | 28.0 | 1.010-6 | 1100 | 0.8 | 8.9644 | 0.0898 | 5.471036 | 2.521036 | 2.17 | 3.751036 |
We show in Fig. 7 the DBD lightcurve folded by using these ephemerides. We have weighted the data according to 1/ in each one of the 20 bins per period used, where is the error of each individual dwell. As can be seen, the modulation is quasi-sinusoidal, but showing a slightly slower rise and a faster decay. This behaviour is unaffected by small changes in the used or by small shifts in to average the data in a different way, indicating that it might be real. Nevertheless we must be cautious about this issue, since the long-term variability can affect the folded lightcurve in a noticeable way. On the other hand, the local minimum around maximum (phases 0.95–1.00) is washed out when using slightly different values for and/or , which makes it more uncertain.
As a further check of the orbital variability, and in an attempt to avoid the influence of the long-term variability, we have analysed the data in the following way. First of all, we have only considered the DBD data points falling on intervals of time when the average flux shown in Fig. 3a was in the range 0.25–0.55 count s-1, to avoid intervals of poor statistics and intervals of too much activity of the source. This corresponds approximately to 57% of the original DBD data. After that, we subtracted the average flux from the DBD data, to remove the remaining long-term variability. Finally, we analysed the resulting data set as previously done. CLEAN provides an orbital period of 9.55870.0005 d, compatible with the one reported above. The folded lightcurve obtained by using this filtered data set and the quoted period is very similar to the one shown in Fig. 7 (but with a mean count rate of 0). The local minimum around phases 0.95–1.00 is also present, although again with a low significance. Regarding the orbital period, we prefer the former value, d, because it was obtained with the original dataset, which contained about 2 times the number of flux measurements used in the latter case.
5.2 Wind accretion in an eccentric orbit?
The minimum and maximum RXTE/ASM count rates in Fig. 7 are 0.26 and 0.46 count s-1, respectively, implying a ratio between them of 1.8. Translating the observed count rates into absorbed X-ray luminosities, we obtain an orbital variability covering the range – erg s-1. This degree of variability is expected in a wind-accreting system with a low or moderate eccentricity. In order to explore whether the observed variability can provide constraints on system parameters, we have used a beta-law with spherical symmetry to model the wind of the donor, computed the position and velocity of the compact object in an eccentric orbit around it, and obtained the luminosity due to accretion by using a Bondi-Hoyle accretion model (Bondi & Hoyle 1944; Bondi 1952). A detailed explanation of the method is given in Reig et al. (2003). A comparison between the equation we have used to estimate the X-ray luminosity due to accretion, , and that of the commonly used formalism by Lamers et al. (1976), where , reveals that the efficiency factor for the conversion of accreted matter to X-ray flux is .
Since this is a very simple accretion model, we used Vela~X-1 to check its validity. Folding the RXTE/ASM data of the source with its orbital period, we find maximum and minimum count rates of 6.4 and 3.2 count s-1 (the presence of the X-ray eclipse close to the minimum X-ray flux prevents an accurate estimate in this latter case), thus providing a luminosity ratio 2.0. Assuming a distance to the source of 1.9 kpc (Sadakane et al. 1985), these count rates translate into absorbed X-ray luminosities of and erg s-1, with an average of erg s-1. On the other hand, by using (Sadakane et al. 1985) and the relationship by Howarth & Prinja (1989), we obtain a mass-loss rate of yr-1. For the wind terminal velocity we use the value km s-1, obtained from IUE spectra (Prinja et al. 1990). Hereafter we will use for the exponent of the wind law. The orbital period and the eccentricity are those of Quaintrell et al. (2003), while we have considered their intermediate case of =80°, which provides , , and (with the adopted values, ). The expected accretion luminosity values are quoted in the last row of Table 1. As can be seen, we obtain a ratio in of 2.2, compatible with the 2.0 ratio obtained with the RXTE/ASM data. On the other hand we find , since not all the accretion luminosity is released in the soft X-ray band. Indeed, from BeppoSAX data of Vela~X-1 by Orlandini et al. (1998), we found that between 1/3–1/4 of the total X-ray luminosity between 2 and 100 keV would be emitted in the RXTE/ASM energy range. Therefore, the accretion luminosities obtained through our model yield a ratio of maximum to minimum luminosity compatible with the RXTE/ASM data, and absolute values a factor of 3 to 4 above them, in agreement with observations.

In the case of 4U~2206+54 we have used and km for the NS (which provides ). We have run models with the parameters corresponding to both an O9.5 V star and an O9.5 III star. In the first case, we considered and (Martins et al. 2005), with yr-1 (by using from Martins et al. 2005 and the relationship by Howarth & Prinja 1989). In the second case, and using the same references, we have and , with yr-1. We have tried different eccentricities and found that we can approximately reproduce the quasi-sinusoidal shape of the folded lightcurve shown in Fig. 7 by using , as can be seen in Fig. 8 for the O9.5 V star considered above and using km s-1. We note that in this last figure phase 0 corresponds to periastron, and the maximum accretion luminosity takes place at phase 0.2 because of the low wind terminal velocity (i.e., if this model were correct, periastron would be at phase 0.8 in Fig. 7). The results of our simulations using an eccentricity of 0.15, for both the main sequence and giant cases, and different values for the wind terminal velocity are quoted in Table 1. As can be seen in the main sequence case for km s-1, we are able to reproduce the 1.8 maximum to minimum X-ray luminosity ratio and obtain an accretion luminosity 3 times the observed one (of erg s-1), similar to the factor of 2 between the 4–150 to 4–12 keV luminosities (Blay et al. 2005). However, for higher wind velocities we underestimate the average X-ray luminosity, consistent with the low-speed wind observed by IUE (see Sect. 2). In the giant case the system would be at 4.8 kpc, and the average X-ray luminosity erg s-1. Therefore we should expect average accretion luminosities between 15 and erg s-1, which can be achieved with km s-1, again compatible with the IUE data. We caution, nevertheless, that the wind terminal velocity has been derived with UV data taken several years before the X-ray flux measurements form RXTE/ASM.
It is important to note that, for the unevolved nature of BD~+53$°$2790 and the orbital parameters of the system, the low value of the wind velocity allows 4U~2206+54 to have an unexpectedly high X-ray luminosity even if containing an NS of 1.4 as the accreting compact object. This solves the main problem in accepting the NS hypothesis, the other one being the lack of X-ray pulses that can be explained by simple geometrical effects (Blay et al. 2005). Finally, from the absence of X-ray eclipses, and for , we derive an upper limit on the orbit inclination of 82.5° in the O9.5 V case, and 77.5° in the O9.5 III case.
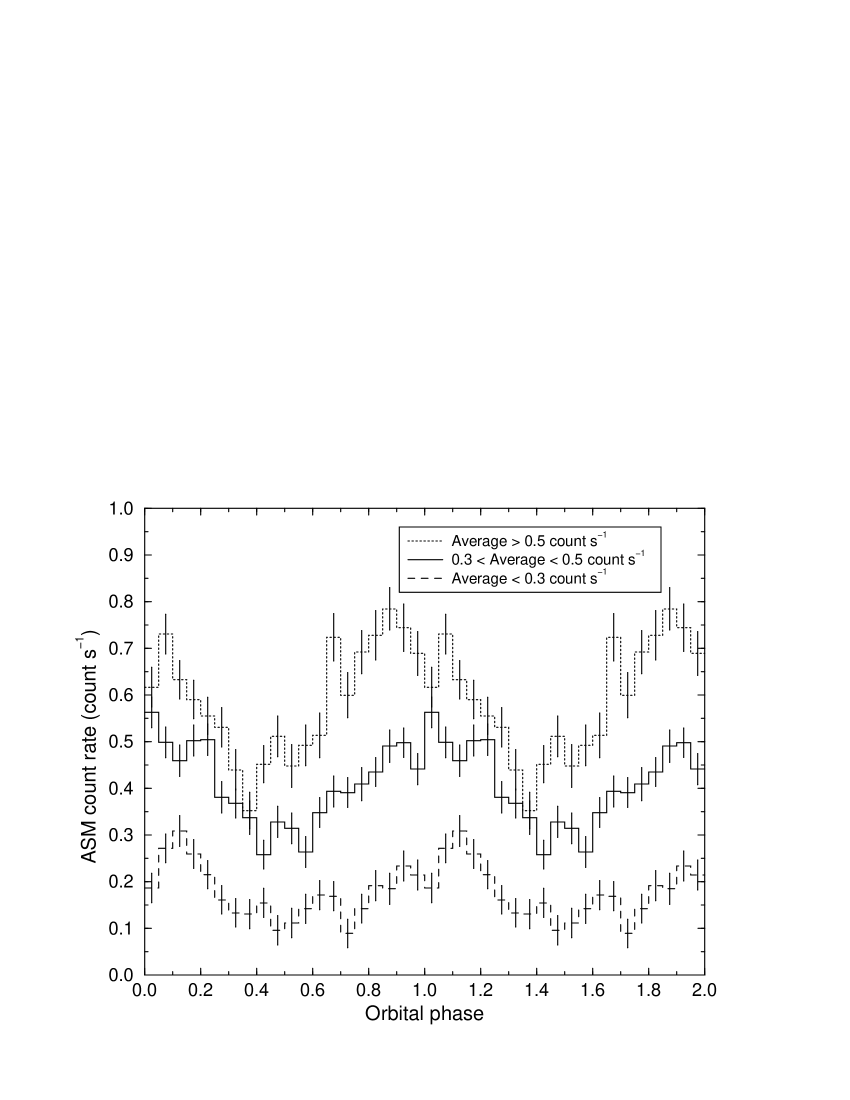
6 On the long-term wind variability
There are two simple ways to explain the long-term changes in the X-ray flux from 4U~2206+54: changes in the mass-loss rate of the donor and/or changes in the wind terminal velocity. Assuming a constant mass-loss rate of yr-1, wind terminal velocity changes between 200 and 1100 km s-1 should be invoked to provide accretion luminosities in the range – erg s-1, necessary to explain the observed long-term X-ray variability discussed in Sect. 4, of – erg s-1. These velocity changes would lead to different orbital variability patterns: for the lower values of we would have a higher X-ray flux with a maximum peaking at a phase 0.28 after periastron, while for the higher values of the lower X-ray flux would have its maximum around phase 0.06 after periastron. To check if this is the case, we have split the DBD data in three intervals according to whether the 30-day averages shown in Fig. 3a are in the following ranges: count s-1 (24% of data), and count s-1 (38% of data), count s-1 (38% of data). We have subsequently folded these data with the orbital period, as done in Fig. 7. We show the results in Fig. 9. For higher count rates the maximum X-ray flux takes place earlier than for lower count rates, contrary to what would be expected if only changes in drove the changes in X-ray luminosity.
If only changes in the mass-loss rate of the primary are invoked, then for km s-1 we would need dramatic long-term variations in the range – yr-1. Moreover, a change in the mass-loss rate does not modify the phase of the X-ray luminosity maximum. Despite the relatively noisy RXTE/ASM data of 4U~2206+54, we can say that the scenario is not so simple.
A general explanation of the various regimes of wind accretion on to a magnetised neutron star can be found in Stella et al. (1986). In our case, the accretion radius (Waters & van Kerkwijk 1989) varies along the eccentric orbit, and takes values in the range 2–31011 cm for the km s-1 case (1.51011 cm for km s-1, and 0.51011 cm for km s-1). This is one order of magnitude smaller than the separation of both objects at periastron passage. On the other hand, by using a surface magnetic field of G (Blay et al. 2005) and the dipole magnetic field formula (; Waters & van Kerkwijk 1989) we can compute the magnetic radius along the orbit, given by , which takes values in the range 0.6–1.01010 cm for all wind values considered. Indeed, considering the cases quoted in Table 1 and all possible orbital phases, the accretion radius is always between 5 and 40 times larger than the magnetospheric radius. Finally, since we do not know the spin period of the NS, we cannot compute the corotation radius. However, if we want to avoid centrifugal inhibition of accretion, also known as the propeller mechanism (see Stella et al. 1986), we must have . Therefore, to have direct wind accretion in 4U~2206+54, the spin period has to be longer than 470 s. We have computed the magnetospheric radius as a function of the orbital phase, and it is at its minimum just before periastron and shifted in phase 0.3 before the maximum of accretion luminosity. Therefore, we suggest that the behaviour shown in Fig. 9 could be the result of enhanced accretion when the magnetospheric radius is minimum, during epochs of high mass-loss rates of the primary.
In addition, geometric variations in the X-ray irradiation of the wind of the primary can lead to changes in the ionization states of the wind species that we see, resulting in variations of the measured (Hatchett & McCray 1977). This effect has been observed in Vela~X-1 (Kaper et al. 1993) and in 4U~1700$-$37 (Iping et al. 2004). Moreover, for higher X-ray irradiation one has a higher ionization and a slower wind, thus a higher accretion rate and X-ray luminosity. The eccentricity of 4U~2206+54 could lead to additional significant changes in the amount of X-ray irradiation of the primary wind along the orbit, and thus in , providing a different orbital variability pattern from the one obtained with a simple Bondi-Hoyle model. There are certain epochs when the RXTE/ASM maximum to minimum orbital flux ratio appears to be a factor of 5. This can be seen in data with relatively good signal-to-noise ratios after averaging with a 2-day running window. An example of this variability is shown in Figure 4 of Corbet & Peele (2001). If this behaviour were only due to accretion variability in an eccentric orbit, a value of would be needed. However, these factor of 5 flux variations are not seen in the average folded lightcurve. Even when considering the split data in Fig. 9, variations with a factor in the range 2–3 are seen. Clearly, a radial velocity curve is needed to constrain the eccentricity of 4U~2206+54 and allow a better modeling of the data.
7 HMXBs with main sequence donors
4U~2206+54 has been known since the early days of X-ray astrophysics (Giacconi et al. 1972), although a complete understanding of its accreting properties has only been possible after analysing an IUE spectrum. The abnormally slow wind of the donor in this binary system, 350 km s-1, results in a relatively high X-ray luminosity, – erg s-1, for its relatively wide orbit, 9.6 d, which has allowed its detection in all X-ray surveys. In addition, the system is relatively nearby, 2.6 kpc (Blay et al. 2006), and does not suffer an extremely high absorption, atoms cm-2 (Torrejón et al. 2004). Similar systems containing main sequence donors with normal fast winds would have one to two orders of magnitude lower X-ray luminosities, preventing their detection in existing X-ray surveys.
The only exception is the nearby (2.5 kpc) X-ray binary system LS~5039 (see Casares et al. 2005, and references therein). The donor is an O6.5 V((f)) star (Clark et al. 2001) displaying a fast wind of 2440 km s-1 (McSwain et al. 2004), but the system is present in the ROSAT All Sky Bright Source Catalog (Voges et al. 1999; Motch et al. 1997), because of its close orbit, 3.9 d (Casares et al. 2005), and relatively low absorption, atoms cm-2 (Martocchia et al. 2005). We note that the X-ray luminosity of this system, erg s-1 (Bosch-Ramon et al. 2005), is only a small fraction, a factor of 1/80, of the accretion luminosity (Casares et al. 2005), making its detection even more difficult.
In this context, sensitive pointed observations of the Galactic centre with Chandra revealed the existence of a population of 1000 low-luminosity hard X-ray sources (Wang et al. 2002; Muno et al. 2003). Although a substantial fraction of them could be wind-fed accreting NSs in HMXBs with main sequence donors (Pfahl et al. 2002b), their nature is still under debate (see Bandyopadhyay et al. 2005 and Laycock et al. 2005).
On the other hand, available all-sky (or Galactic-plane) X-ray surveys are not sensitive and/or hard enough to detect sources of this kind a few kpc away from us, where interstellar absorption probably plays a crucial role. Therefore, the existence of a population of wind-fed HMXBs with main sequence donors (and s in the case of NSs to avoid the propeller effect), which would be the natural progenitors of SXBs, could be unveiled if new sensitive all-sky surveys with energies above 5 keV are performed (like the planned ROSITA222http://www.rssd.esa.int/index.php?project=Rosita and EXIST333http://exist.gsfc.nasa.gov/ surveys). Their study could have fundamental consequences for models of evolution and population synthesis of binary systems.
8 Conclusions
After a study of an IUE spectrum of BD~+53$°$2790 and 9.4 years of RXTE/ASM data of 4U~2206+54, we conclude that:
-
1.
The ultraviolet spectrum reveals that, in mid June 1990, the O9.5 V star BD~+53$°$2790 had a wind terminal velocity of 350 km s-1, abnormally slow for its spectral type, but similar to the ones measured in two peculiar fast rotators.
-
2.
An improved orbital period of d was obtained, to be compared with the slightly longer period of 9.5680.004 d reported previously by Corbet & Peele (2001) using the first years of RXTE/ASM data.
-
3.
Long-term X-ray flux variability on timescales of hundreds of days is present in the data, compatible with a quasi-period that decreases from 270 to 130 d during the course of the RXTE/ASM monitoring between February 1996 and July 2005. We conclude that this reflects changes in the wind of the donor, whose quasi-periodic nature remains puzzling.
-
4.
Using a Bondi-Hoyle accretion model, a spherically symmetric wind with km s-1 and an eccentric orbit with , we are able to reproduce quite well the average X-ray luminosity variations of the source with the orbital period, as well as the absolute X-ray luminosity of the system, which no longer poses problems in accepting a (non-pulsating) NS as the compact object in this binary system.
-
5.
The different patterns of the orbital X-ray variability for different average X-ray fluxes indicates that the long-term X-ray variability cannot be explained by variations in and/or alone. Due to the orbital eccentricity we expect changes in the magnetospheric radius and perhaps changes in caused by variations in the ionization states in the wind of the primary due to changes in the X-ray irradiation. These parameters could vary as well on long-term scales for different mass-loss rates of the primary. We suggest that they might play a role in explaining the different patterns of orbital X-ray variability.
-
6.
If the magnetic field of the NS is G (Blay et al. 2005), its spin period has to be longer than 470 s to allow direct wind accretion.
-
7.
Long-term coordinated observations in the optical and X-rays could confirm the proposed variability of the wind, by a correlation between X-ray flux and H excess.
-
8.
Observations are underway to obtain the radial velocity curve of 4U~2206+54 and constrain the eccentricity of the system, which is needed to properly model the observed orbital X-ray variability of the source.
-
9.
The nearby X-ray binaries 4U~2206+54 and LS~5039 are the only two known wind-fed HMXBs with main sequence donors. We suggest that more sensitive and harder X-ray surveys than the available ones could unveil a new population of objects of this kind, which are the natural progenitors of supergiant X-ray binaries.
Acknowledgements.
Based on quick-look results provided by the RXTE/ASM team. We thank the anonymous referee for useful comments. We thank A. Herrero for useful suggestions when analysing the IUE spectrum and L. Georgiev and X. Hernández for kindly supplying their genetic algorithm code. We thank S. Chaty for useful comments on a draft version of the manuscript. This research is supported by the Spanish Ministerio de Educación y Ciencia (former Ministerio de Ciencia y Tecnología) through grants AYA2001-3092, ESP-2002-04124-C03-02, ESP-2002-04124-C03-03 and AYA2004-07171-C02-01, partially funded by the European Regional Development Fund (ERDF/FEDER). M.R. acknowledges financial support from the French Space Agency (CNES) and by a Marie Curie Fellowship of the European Community programme Improving Human Potential under contract number HPMF-CT-2002-02053. I.N. is a researcher of the programme Ramón y Cajal, funded by the Spanish Ministerio de Educación y Ciencia and the University of Alicante, with partial support from the Generalitat Valenciana and the European Regional Development Fund (ERDF/FEDER). P.B. acknowledges support by the Spanish Ministerio de Educación y Ciencia through grant ESP-2002-04124-C03-02. This research has made use of the NASA Astrophysics Data System Abstract Service and of the SIMBAD database, operated at the CDS, Strasbourg, France.References
- Abt & Bautz (1963) Abt, H. A., & Bautz, L. P. 1963, ApJ, 138, 1002
- Bandyopadhyay et al. (2005) Bandyopadhyay, R. M., Miller-Jones, J. C. A., Blundell, K. M., et al. 2005, MNRAS, 364, 1195
- Blay (2006) Blay, P. 2006, Ph.D. Thesis, University of Valencia
- Blay et al. (2005) Blay, P., Ribó, M., Negueruela, I., et al. 2005, A&A, 438, 963
- Blay et al. (2006) Blay, P., Negueruela, I., Reig, P., et al. 2006, A&A, 446, 1095
- Bondi (1952) Bondi, H. 1952, MNRAS, 112, 195
- Bondi & Hoyle (1944) Bondi, H., & Hoyle, F. 1944, MNRAS, 104, 273
- Bosch-Ramon et al. (2005) Bosch-Ramon, V., Paredes, J. M., Ribó, M., et al. 2005, ApJ, 628, 388
- Casares et al. (2005) Casares, J., Ribó, M., Ribas, I., et al. 2005, MNRAS, 364, 899
- Clark (2000) Clark, G. W. 2000, ApJ, 542, L131
- Clark et al. (2001) Clark, J. S., Reig, P., Goodwin, S. P., et al. 2001, A&A, 376, 476
- Clarkson et al. (2003a) Clarkson, W. I., Charles, P. A., Coe, M. J., et al. 2003a, MNRAS, 339, 447
- Clarkson et al. (2003b) Clarkson, W. I., Charles, P. A., Coe, M. J., & Laycock, S. 2003b, MNRAS, 343, 1213
- Corbet (1986) Corbet, R. H. D. 1986, MNRAS, 220, 1047
- Corbet & Mukai (2002) Corbet, R. H. D., & Mukai, K. 2002, ApJ, 577, 923
- Corbet & Peele (2001) Corbet, R. H. D., & Peele, A. G. 2001, ApJ, 562, 936
- Corbet et al. (2000) Corbet, R., Remillard, R., & Peele, A. 2000, IAUC, 7446
- Gallo et al. (2003) Gallo, E., Fender, R. P., & Pooley, G. G. 2003, MNRAS, 344, 60
- Georgiev & Hernández (2005) Georgiev, L., & Hernández, X. 2005, RMxAA, 41, 121
- Giacconi et al. (1972) Giacconi, R., Murray, S., Gursky, H., et al. 1972, ApJ, 178, 281
- Groenewegen et al. (1989) Groenewegen, M. A. T., Lamers, H. J. G. L. M., & Pauldrach, A. W. A. 1989, A&A, 221, 78
- Hatchett & McCray (1977) Hatchett, S., & McCray, R. 1977, ApJ, 211, 552
- Howarth & Prinja (1989) Howarth, I. D., & Prinja, R. K. 1989, ApJS, 69, 527
- Howarth & Reid (1993) Howarth, I. D., & Reid, A. H. N. 1993, A&A, 279, 148
- Iping et al. (2004) Iping, R. C., Sonneborn, G., Kaper, L., Hammerschlag-Hensberge, G. 2004, [arXiv:astro-ph/0411458]
- Kaper et al. (1993) Kaper, L., Hammerschlag-Hensberge, G., & van Loon, J. Th. 1993, A&A, 279, 485
- Kudritzki & Puls (2000) Kudritzki, R., & Puls, J. 2000, AR&A, 38, 613
- Lamers et al. (1976) Lamers, H. J. G. L. M., van den Heuvel, E. P. J., & Petterson, J. A. 1976, A&A, 49, 327
- Lamers et al. (1987) Lamers, H. J. G. L. M., Cerruti-Sola, M., & Perinotto, M. 1987, ApJ, 314, 726
- Laycock et al. (2005) Laycock, S., Grindlay, J., van den Berg, M., et al. 2005, ApJ, 634, L53
- Lesh & Aizenman (1973) Lesh, J. R., & Aizenman, M. L. 1973, A&A, 22, 229
- Levine et al. (1996) Levine, A. M., Bradt, H., Cui, W., et al. 1996, ApJ, 469, L33
- Lewin et al. (1995) Lewin, W. H. G., van Paradijs, J., & van den Heuvel, E. P. J. 1995, X-ray Binaries (Cambridge Univ. Press, Cambridge)
- Martins et al. (2005) Martins, F., Schaerer, D., & Hillier, D. J. 2005, A&A, 436, 1049
- Martocchia et al. (2005) Martocchia, A., Motch, C., & Negueruela, I. 2005, A&A, 430, 245
- Masetti et al. (2004) Masetti, N., Dal Fiume, D., Amati, L, et al. 2004, A&A, 423, 311
- Massa (1995) Massa, D. 1995, ApJ, 438, 376
- Massi et al. (2004) Massi, M., Ribó, M., Paredes, J. M., et al. 2004, A&A, 414, L1
- McSwain et al. (2004) McSwain, M. V., Gies, D. R., Huang, W., et al. 2004, ApJ, 600, 927
- Motch et al. (1997) Motch, C., Haberl, F., Dennerl, K., Pakull, M., & Janot-Pacheco, E. 1997, A&A, 323, 853
- Muno et al. (2003) Muno, M. P., Baganoff, F. K., Bautz, M. W., et al. 2003, ApJ, 589, 225
- Nazé et al. (2001) Nazé, Y., Vreux, J.-M., & Rauw, G. 2001, A&A, 371, 195
- Negueruela & Reig (2001) Negueruela, I., & Reig, P. 2001, A&A, 371, 1056
- Ogilvie & Dubus (2001) Ogilvie, G. I., & Dubus, G. 2001, MNRAS, 320, 485
- Orlandini et al. (1998) Orlandini, M., Dal Fiume, D., Frontera, F., et al. 1998, A&A, 332, 121
- Otazu et al. (2002) Otazu, X., Ribó, M., Peracaula, M., Paredes, J. M., & Núñez, J. 2002, MNRAS, 333, 365
- Otazu et al. (2004) Otazu, X., Ribó, M., Paredes, J. M., Peracaula, M., & Núñez, J. 2004, MNRAS, 351, 215
- Pfahl et al. (2002a) Pfahl, E., Rappaport, S., Podsiadlowski, P., & Spruit, H. 2002a, ApJ, 574, 364
- Pfahl et al. (2002b) Pfahl, E., Rappaport, S., & Podsiadlowski, P. 2002b, ApJ, 571, L37
- Prinja et al. (1990) Prinja, R. K., Barlow, M. J., & Howarth, I. D. 1990, ApJ, 361, 607
- Quaintrell et al. (2003) Quaintrell, H., Norton, A. J., Ash, T. D. C., et al. 2003, A&A, 401, 313
- Rauw et al. (2003) Rauw, G., De Becker, M., & Vreux, J.-M. 2003, A&A, 399, 287
- Reig et al. (2003) Reig, P., Ribó, M., Paredes, J. M., & Martí, J. 2003, A&A, 405, 285
- Ribó et al. (2001) Ribó, M., Peracaula, M., Paredes, J. M., Núñez, J., & Otazu, X. 2001, in proceedings of Fourth INTEGRAL Workshop, Exploring the Gamma-Ray Universe, A. Giménez, V. Reglero & C. Winkler (eds.), ESA Publications Division, Noordwijk, p. 333
- Roberts et al. (1987) Roberts, D. H., Lehár, J., & Dreher, J. W. 1987, AJ, 93, 968
- Sadakane et al. (1985) Sadakane, K., Hirata, R., Jugaku, J., et al. 1985, ApJ, 288, 284
- Smith & Fullerton (2005) Smith, M. A., & Fullerton, A. W. 2005, PASP, 117, 13
- Sobolev (1960) Sobolev, V. V. 1960, Moving envelopes of stars, Harvard University Press
- Stella et al. (1986) Stella, L., White, N. E., & Rosner, R. 1986, ApJ, 308, 669
- Stellingwerf (1978) Stellingwerf, R. F. 1978, ApJ, 224, 953
- Szatmáry et al. (1994) Szatmáry, K., Vinkó, J., & Gál, J. 1994, A&AS, 108, 377
- Tian et al. (2003) Tian, B., Men, H., Deng, L. C., Xiong, D. R., & Cao, H. L. 2003, Chin. J. Astron. Astroph. 3, 125
- Torrejón et al. (2004) Torrejón, J. M., Kreykenbohm, I., Orr, A., Titarchuk, L., & Negueruela, I. 2004, A&A, 423, 301
- Voges et al. (1999) Voges, W., Aschenbach, B., Boller, Th., et al. 1999, A&A, 349, 389
- Waelkens et al. (1998) Waelkens, C., Aerts, C., Kestens, E., Grenon, M., & Eyer, L. 1998, A&A, 330, 215
- Walborn (1981) Walborn, N. R. 1981, ApJ, 243, L37
- Walborn et al. (2004) Walborn, N. R., Howarth, I. D., Rauw, G., et al. 2004, ApJ, 617, L61
- Wang et al. (2002) Wang, Q. D., Gotthelf, E. V., & Lang, C. C. 2002, Nature, 415, 148
- Waters & van Kerkwijk (1989) Waters, L. B. F. M., & van Kerkwijk, M. H. 1989, A&A, 223, 196
- Wijers & Pringle (1999) Wijers, R. A. M. J., & Pringle, J. E. 1999, MNRAS, 308, 207