Bimodal Galaxies and Bimodality in Globular Cluster Systems
Abstract
Various galaxy properties are not continuous over a large range in mass, but rather reveal a remarkable transition or ‘bimodality’ at a stellar mass of 3 M⊙. These properties include colors, stellar populations, Xray emission and mass-to-light ratios. This behavior has been interpreted as the transition from hot to cold flows by Dekel & Birnboim (2005).
Here we explore whether globular cluster (GC) systems also reveal a bimodal nature with regard to this critical mass scale. Globular clusters probe star formation at early epochs in the Universe and survive subsequent galaxy mergers and accretions. We use new data from the ACS Virgo Cluster Survey (Peng et al. 2005), which provides a homogeneous sample of the GC systems around one hundred Virgo early-type galaxies covering a range of five hundred in galaxy mass. Their classification of the GC color distributions is taken to examine a key quantity – the number of GCs per unit galaxy luminosity. Below the critical mass, this quantity (called the GC specific frequency) increases dramatically in its mean value and spread. This increase may be due to regulated star formation in low mass galaxies, which in turn is due to mass loss via winds and the transition from hot to cold gas accretion flows. We also note that above the critical mass, galaxies possess two GC subpopulations (with blue and red mean colors) but below this mass, galaxies reveal an increasing proportion of single (blue) GC systems.
1 Introduction
The general galaxy population reveals a bimodal color-magnitude distribution (Lilly et al. 1995), which is seen in both the local Universe by SDSS (Blanton et al. 2005) and out to modest redshifts in COMBO17 (Bell et al. 2004). This blue/red bimodality shows a well-defined transition at a stellar mass of about 3 M⊙ or halo mass of 6 M⊙ (e.g. in SDSS by Kauffmann et al. 2003). Other galaxy properties, such as stellar populations (in 2dFGRS by Madgwick et al. 2003), Xray properties (O‘Sullivan et al. 2001) and galaxy mass-to-light ratios (Marinoni & Hudson 2002) also reveal a bimodality about this critical stellar mass (see Dekel & Birnboim 2005 for a more complete list).
This bimodality has been interpreted in terms of whether the accreted material undergoes a virial shock when it enters the galaxy halo (a hot flow) or not (a cold flow). Recent simulations show that the transition from hot to cold mode accretion occurs at the same critical stellar mass as the observed galaxy bimodality (Keres et al. 2005; Dekel & Birnboim 2005).
It is of interest to know whether globular cluster (GC) systems show a dichotomy along with the general galaxy population or if their properties are continous over a large range in galaxy mass. The spectra of GCs in massive galaxies indicate that the bulk of the GCs are old, i.e. 10 Gyrs with formation at epochs zf 2 (e.g. Strader et al. 2005a). The situation for low mass galaxies is less well constrained. However, recent Keck spectra of GCs in the Virgo dwarf VCC 1087 indicate that they are also old and hence formed in the very early stages of the dwarf galaxy formation (Beasley et al. 2005). Thus GCs are formed during the earliest star and galaxy formation processes in the Universe. Being of single age and chemical composition, they do not suffer from the complication of multiple star formation events as their host galaxies do. They are also fairly robust, with many surviving the process of galaxy mergers and accretions. Globular clusters therefore provide a useful probe of the early stages of galaxy formation and their subsequent evolution.
The number of globular clusters per unit galaxy luminosity (called specific frequency) is a key measure of GC systems, which varies with Hubble type and environment (see review by Elmegreen 1999). In this Letter we examine how the GC specific frequency varies in relation to the critical mass and hence how it relates to the widely observed bimodality in galaxy properties. From the Advanced Camera for Surveys (ACS) Virgo Cluster Survey, Peng et al. (2005) noted that the only property of GC systems that varied with the critical stellar mass was the fraction of red GCs, i.e. it is nearly constant for high masses and declines rapidly for low masses. Strader et al. (2005b) studied the total specific frequency for a subset of 37 Virgo dwarf galaxies (all with masses below the critical mass). They found no strong difference between dE and dE,N dwarfs, contrary to the earlier claims of Miller et al. (1998) using WFPC2 data. Here, using the ACS data of Peng et al. , we extend these earlier works to investigate the GC specific frequency for a homogeneous sample of one hundred early-type galaxies in the Virgo cluster. We also briefly discuss the implications for GC and galaxy formation.
2 Observational Data
The ACS Virgo Cluster Survey (Cote et al. 2004) consists of deep and band imaging of the 100 brightest early-type galaxies in the Virgo cluster, using the ACS on-board the Hubble Space Telescope. This survey has the advantages of increased depth, spatial coverage and metallicity sensitivity (to detect any GC subpopulations) compared to previous WFPC2 studies (e.g. Forbes et al. 1996; Larsen et al. 2001; Kundu & Whitmore 2001). Blank fields were used to assist in determining the background contamination rate, which is very low. The integration times are such as to include of the GC luminosity function; the spatial coverage is complete for small galaxies but severely incomplete for the GC systems of the largest galaxies (see below for further details).
Recently Peng et al. (2005) examined the GC color
distributions for each galaxy in the survey (only VCC 1627 had no
detectable GCs). A number of galaxies revealed bimodal GC color
distributions in the largest homogeneous sample of GC systems to date.
Such bimodality has been detected in the
GC systems of numerous large galaxies (e.g. Zepf & Ashman 1993;
Forbes et al. 1996; Larsen et al. 2001; Kundu &
Whitmore 2001). This color bimodality indicates two distinct
GC subpopulations are present – one blue and one
red. These subpopulations are thought, from spectroscopy, to be metal-poor and
metal-rich respectively, both being 10 Gyrs old with hints that
the red GCs may be slightly younger than the blue GCs
(e.g. Strader et al. 2005a).
Other GC properties, such as their orbits and
spatial distributions, are also distinct when separated into
blue/red subpopulations. Peng et al. determined mean
colors for the blue and red subpopulations if the distribution
was statistically bimodal; for unimodal color distributions, the
GCs are all blue. They also list the
number of GCs observed and the blue/red
fraction in bimodal systems. From this data we have determined
the specific frequencies of the blue and red GCs separately, i.e.
S (1)
S (2)
where is the fraction of blue or red GCs, NGC is the total number of GCs and MV is the galaxy absolute V-band magnitude calculated from the B-band values listed in Cote et al. (2004) assuming B–V = 0.9 with no reddening and m–M = 31.09. Ideally one would like to explore the relation between GC subpopulations and the appropriate field stars within the galaxy, but resolving individual stellar populations is currently only possible for the very nearest elliptical galaxies (e.g. Harris, Harris & Poole 1999).
3 Results
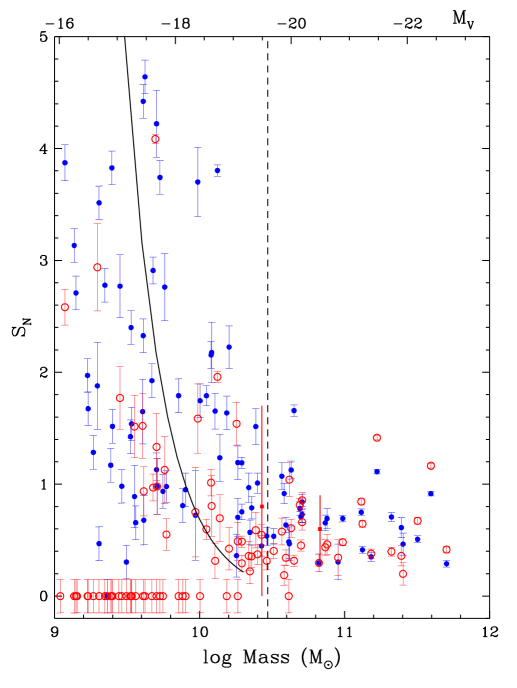
In Fig. 1 we plot the SNblue and SNred separately against the host galaxy stellar mass. To calculate stellar masses we have assumed a constant M/LV = 5 from the dynamical study of Virgo dwarf galaxies by Geha et al. (2002). We note that a similar value is obtained by Fukugita et al. (1998). This gives a range in mass of a factor of 500. The data points with an SNred value of zero indicate the GC systems that appear unimodal in color, i.e. the GCs are all attributed to the blue subpopulation by Peng et al. (2005). For such systems we show typical errors. The plot also shows the critical stellar mass of 3 M⊙ (equivalent to MV = –19.6), about which the general galaxy population reveals a bimodality in properties (see summary by Dekel & Birnboim 2005). The compact elliptical NGC 4486B (VCC 1297) has been excluded from this plot as it has an abnormally high specific frequency of SNblue = 9.5 and SNred = 4.1 (this is probably due to a combination of tidal stripping reducing the galaxy’s luminosity and contamination from M87’s extensive GC system; Peng et al. 2005).
Figure 1 shows that below the critical mass galaxies reveal a wide range in GC specific frequencies, whereas above the critical mass the specific frequencies are confined to a relatively narrow range. For masses below the critical mass we include a curve showing a galaxy mass-to-light ratio M/LV M-2/3 (Dekel & Birnboim 2005), which corresponds to LV M5/3. The vertical normalization is arbitrary.
Below a mass of 109 M⊙ the trend for higher SN values continues (Durrell et al. 1996) but appears to halt at galaxy masses of 107 M⊙ which have no GC systems (Forbes et al. 2000; Strader et al. 2005a). This lower mass limit for the occurrence of GC systems may be set by atomic cooling, which is inefficient for virial temperatures less than 104K corresponding to halo masses less than 108 M⊙ (Moore et al. 2005).
Above the critical mass, both the red and blue specific frequencies are fairly constant. For galaxies with masses 3 1010 M/M⊙ 3 1011 the mean SNred = 0.51 0.05 and the mean SNblue = 0.75 0.06. Figure 1 also shows the location of the bulge specific frequency for M31 and the Milky Way from Forbes et al. (2001), i.e. the total number of red GCs per unit bulge stellar mass. Within the errors, the SNred of the bulges of these two spiral galaxies are consistent with the trend seen in the Virgo early-type galaxies.
For the more massive galaxies, the ACS Virgo Cluster Survey is missing a significant fraction of the GC system beyond its 3.4 3.4 arcmin field-of-view which would render the SN value a significant underestimate, however this only significantly affects a small fraction of the overall survey. For example, the GC system of Virgo’s brightest galaxy M49 (VCC 1226) extends out to 23 arcmin and has a total GC population of 5,900 (Rhode & Zepf 2001). For Virgo dwarf galaxies, Durrell et al. (1996) find that the entire GC system is contained within 0.5 arcmin. The transition from partial to full areal coverage by the ACS is not well defined but occurs at intermediate galaxy luminosities. For example, a wide area study of the GC system in the low luminosity (MB = –19.35) Fornax elliptical NGC 1374 suggests about 83% of the GC system would lie within the ACS field-of-view if placed at the Virgo distance. This galaxy would be the 16th brightest in the ACS Virgo sample. An additional, but smaller effect, for the brightest galaxies is that the blue-to-red GC ratio will also be underestimated as blue GCs are preferentially located in galaxy outer regions.
4 Discussion
Figure 1 shows that GC specific frequencies reveal a large range in values below the critical stellar mass, and that specific frequencies are generally higher in lower mass galaxies. If GCs form at early epochs and with a similar efficiency for all galaxies (McLaughin 1999; Moore et al. 2005), then some mechanism must be reducing the stellar mass in low mass galaxies to raise the GC specific frequencies. Physical mechanisms for regulating the stellar mass include: tidal stripping from the interaction of a dwarf galaxy with a massive galaxy (e.g. Mayer et al. 2001; Forbes et al. 2003), ram pressure stripping of dwarf galaxies (van Zee, Skillman & Haynes 2004), photoionization at early epochs that suppresses further globular cluster and star formation (Beasley et al. 2002; Santos 2003; Bekki 2005; Moore et al. 2005), supernova feedback and mass loss via winds (Durrell et al. 1996; Dekel & Silk 1986) and cold accretion flows (Keres et al. 2005; Dekel & Birnboim 2005). The latter has the advantage of explaining the remarkable transition in GC specific frequency at the critical stellar mass seen in Fig. 1, as well as the bimodality in galaxian properties.
We note that a halo mass-to-light ratio of the form M/LV M-2/3 given by Dekel & Birnboim (2005), equivalent to LV M5/3, provides a reasonable representation of the increasing GC specific frequency with decreasing mass. However there is still substantial spread in the SN values. In other words, below the critical mass the number of GCs per unit galaxy mass appears to vary from galaxy to galaxy assuming the mass-to-light ratio varies in a systematic way with halo mass. This may indicate a variation of baryonic to halo dark mass.
Above the critical mass there is evidence for a fairly constant SNred, i.e. a constant number of red GCs per unit galaxy luminosity, which may extend to the bulge component of spirals as first suggested by Forbes et al. (2001). This would support the idea that spheroid growth is intimately linked to the formation of red GCs.
Interestingly, the correlation between the mean color of the GC subpopulations and galaxy luminosity (or mass) does not show a strong break or change in slope at the critical stellar mass. For example, both Strader et al. (2005b) and Peng et al. (2005) found a continuous GC color–galaxy luminosity trend in the ACS Virgo Cluster Survey data used here. Thus the number of GCs per unit galaxy luminosity and the blue-to-red fractions change at the critical mass, whereas the individual properties responsible for GC colors (e.g. age and metallicity) do not change abruptly. This is consistent with the idea that GC individual properties are fixed at early epochs, whereas galaxy properties (such as total luminosity) can be modified by subsequent evolution.
In terms of the evolutionary scenario outlined by Dekel & Birnboim (2005), low mass galaxies at high redshift are largely blue starforming disks which grow by accretion and cold flows. Supernova feedback and mass loss regulate their star formation. Shock-heating at a lower redshift in dense environments shutoffs the cold flows, which in turn suppresses any further star formation. These galaxies move quickly onto the red sequence. Subsequent gas-poor (‘dry’) merging allows the red sequence to extend from low mass galaxies to the most massive ellipticals seen today.
Star formation via cold accretion flows is thought to be very efficient, thus to explain the higher specific frequency of low mass galaxies as seen in Fig. 1 GC formation must be even more efficient or the stellar luminosity is subsequently reduced. In nearby galaxies for which we can assign the blue GCs (assumed to be the first formed) to the appropriate fraction of the galaxy starlight (e.g. NGC 5128; Harris, Harris & Poole 1999) high SNblue values, and hence high GC formation efficiencies, are inferred. So it may be possible that early GC formation in low mass galaxies is similarly enhanced relative to the star formation but this is very hard to verify observationally. Reduction of the stellar luminosity (e.g. due to supernova winds, stripping etc) is also a possibility.
An additional feature of the critical mass is that it represents the onset of unimodal GC color distributions (with the exception of the star-forming SB0 galaxy NGC 4340 (VCC 654) which may have its luminosity enhanced by ongoing star formation). Thus essentially all galaxies above the critical mass possess bimodal GC color distributions, i.e. evidence for blue and red GC subpopulations. Below the critical mass, the frequency of unimodal (i.e. blue only) GC color distributions increases, and conversely the incidence of bimodality decreases, for decreasing host galaxy mass (see Table 1).
We speculate that this tendency towards blue-only GC systems may be related to different evolutionary paths for dwarf galaxies in cluster environments. For example if a bulgeless dIrr is transformed into a dSph/dE via tidal stripping (Mayer et al. 2001), then we might expect the resulting dSph/dE to have few if any red GCs. The diversity of kinematic properties for dwarfs (both non-rotating and rotating systems have been found) suggests multiple evolutionary paths are possible (e.g. van Zee, Skillman & Haynes 2004). We note that the kinematic anisotropy parameter reveals increased scatter for dwarf galaxies below the critical mass, reminiscent of Fig. 1.
5 Conclusions
Large surveys such as the 2dF, SDSS and COMBO17 have focused
attention on the fact that the general galaxy population reveals
a bimodality in properties at a critical stellar mass of M⊙.
These properties are largely bimodal in
nature, and include blue vs red colors, discrete vs diffuse
sources for the Xray emission and disk vs bulge domination.
To this list, we add another two properties
that reveal a bimodality around this critical mass,
namely:
Above the critical mass galaxies reveal a
relatively narrow range in globular cluster specific frequencies,
whereas below they show an increasing mean value and spread.
Above the critical mass galaxies
possess two globular cluster subpopulations, below they
increasingly reveal single blue globular cluster populations.
Several physical mechanisms, which regulate star formation, may explain the increased specific frequencies of low mass galaxies, however the observed transition corresponds to the critical stellar mass which would therefore favor an origin in supernova feedback and accretion flows as suggested by Dekel and co-workers.
References
- (1)
- (2) Beasley, M., Baugh, C., Forbes, D., Sharples, R., Frenk, C., 2002, MNRAS, 333, 383
- (3) Beasley, M., et al. 2005, MNRAS, submitted
- (4) Bekki, K., 2005, ApJL, 626, 93
- (5) Bell, E., et al. 2004, ApJ, 608, 752
- (6) Blanton, M., Eisenstein, D., Hogg, D., Schlegel, D., Brinkmann, J., 2005, ApJ, 629, 143
- (7) Cote, P., et al. 2004, ApJS, 153, 223
- (8) Dekel, A., Silk, J., 1986, ApJ, 303, 39
- (9) Dekel, A., Birnboim, Y., 2005, astro-ph/0412300
- (10) Durrell, P., Harris, W., Geisler, D., Pudritz, R., 1996, AJ, 112, 972
- (11) Elmegreen, B., 1999, in Toward a New Millennium in Galaxy Morphology, ed. D. Block, I. Puerari, A. Stockton and D. Ferreira, Kluwer Dordrecht
- (12) Forbes, D., Franx, M., Illingworth, G., Carollo, C., 1996, ApJ, 467, 126
- (13) Forbes, D., Masters, K., Minniti, D., Barmby, P., 2000, A&A, 358, 471
- (14) Forbes, D., Brodie, J., Larsen, S., 2001, ApJ, 556, 83
- (15) Forbes, D., Beasley, M., Bekki, K., Brodie, J., Strader, J., 2003, Science, 301, 1217
- (16) Fugukita, M., Hogan, C., Peebles, P., 1998, ApJ, 503, 518
- (17) Geha, M., Guhathakurta, P., van der Marel, R., 2002, AJ, 124, 3073
- (18) Harris, G., Harris, W., Poole, G., 1999, AJ, 117, 855
- (19) Kauffmann, G., et al. 2003, MNRAS, 341, 54
- (20) Keres, Katz, N., Weinberg, D., Dave, R., 2005, MNRAS, 363, 2
- (21) Kundu, A., Whitmore, B., 2001, AJ, 121, 2950
- (22) Larsen, S., Brodie, J., Huchra, J., Forbes, D., Grillmair, C., 2001, AJ, 121, 2974
- (23) Lilly, S., Tresse, L., Hammer, F., Crampton, D., Le Fevre, O., 1995, ApJ, 455, 108
- (24) Madgwick, D., Somerville, R., Lahav, O., Ellis, R., 2003, MNRAS, 343, 871
- (25) Marinoni, C., Hudson, M., 2002, ApJ, 569, 101
- (26) Mayer, L., et al. 2001, ApJ, 559, 754
- (27) McLaughlin, D., 1999, AJ, 117, 2398
- (28) Miller, B., Lotz, J., Ferguson, H., Stiavelli, M., Whitmore, B., 1998, ApJL, 508, 133
- (29) Moore, B., Diemand, J., Madau, P., Zemp, M., Stadel, J., 2005, MNRAS, in prep.
- (30) O’Sullivan, E., Forbes, D., Ponman, T., 2001, MNRAS, 328, 461
- (31) Peng, E., et al. 2005, astro-ph/0509654
- (32) Rhode, K., Zepf, S., 2001, AJ, 121, 210
- (33) Santos, M., 2003, in Extragalactic Globular Cluster Systems, ed. M. Kissler-Patig, Springer Heidelberg, p 348
- (34) Strader, J., Brodie, J.,Forbes, D., 2004, AJ, 127, 3431
- (35) Strader, J., Brodie, J., Cenarro, A., Beasley, M., Forbes, D., 2005a, AJ, 130, 1315
- (36) Strader, J., Brodie, J., Spitler, L., Beasley, M., 2005b, astro-ph/0508001
- (37) van Zee, L., Skillman, E., Haynes, M., 2004, AJ, 128, 121
- (38) Zepf, S., Ashman, K., 1993, MNRAS, 264, 611
- (39)
| Log Mass (M⊙) | No. of Galaxies | % Unimodal |
|---|---|---|
| 10.5 | 27 | 0 |
| 10.5–10.3 | 7 | 0 |
| 10.3–10.1 | 10 | 20 |
| 10.1–9.9 | 7 | 29 |
| 9.9–9.7 | 9 | 56 |
| 9.7–9.5 | 13 | 69 |
| 9.5–9.3 | 14 | 86 |
| 9.3–9.1 | 10 | 80 |