A new sample of broad-absorption-line quasars exhibiting the ghost of lyman alpha
Abstract
We have searched the broad-absorption-line quasar (BAL QSO) sample presented by Reichard et al. for objects exhibiting the so-called ‘ghost of Lyman alpha’. This ghost manifests as a hump near 5900 km s-1 in the troughs of the broad absorption lines and provides strong evidence for the importance of line-driving in powering the outflows from BAL QSOs. Of the 224 sample BAL QSOs selected from the Sloan Digital Sky Survey (SDSS) Early Data Release (EDR), 198 satisfy our redshift constraints and 58 show clear evidence of multiple-trough (MT) structure in the C iv 1550Å line. A composite spectrum constructed from this MT sample already shows evidence for a ghost feature. Narrowing our classification scheme further, we define a set of 36 objects that individually show evidence of a ghost feature, and then apply further cuts to arrive at a final ‘best sample’ that contains our seven strongest ghost candidates. A further five objects show evidence for a ghost feature that is almost strong enough to merit inclusion in our best sample. Despite its limited size, our best sample more than doubles the number of known BAL QSOs with clear ghost signatures and should make an excellent basis for detailed follow-up studies.
1 Introduction
Approximately 10–20% of quasi-stellar objects (QSOs) display strong, broad, blue-shifted absorption lines in their spectra (Foltz et al. 1990, Weymann et al. 1991, Reichard et al. 2003b, Hewett & Foltz 2003). These sources, the so-called broad absorption-line (BAL) QSOs, are predominantly radio quiet (Stocke et al. 1992) with the majority (85%; Sprayberry & Foltz 1992) displaying strong broad absorption troughs only in lines of high ionization (HiBALs), e.g., N v (1240Å), Si iv (1400Å), C iv (1550Å). The remainder exhibit additional BALs in lines of low-ionization species (LoBALs), most notably Mg ii (2800 Å) (Weymann et al. 1991). The emission-line properties of BAL QSOs and non-BAL QSOs appear identical, while their continua differ only in their power-law indices and degree of reddening, suggesting that they are drawn the same parent population (Reichard et al. 2003b). A straightforward interpretation of these differences is that BAL QSOs are simply broad-emission-line objects viewed at a particular orientation. Indeed, in the context of unified models, aside from differences in radio power, orientation is the key to unifying all AGN classes.
The broad absorption troughs have long been regarded as signs of large-scale outflows or winds, whose velocities (as inferred from the widths of the troughs) can reach 0.1–0.2 (Korista et al. 1992). These outflows remove mass, energy and momentum (both linear and angular) from the QSO and deposit them in the host galaxy. As a result, they can significantly affect the evolution of the QSO and the chemical enrichment of its host, for example. Consequently, analyses of the physics, as well as the overall statistics, of BAL QSOs are also important to studies of QSOs and AGN more generally. An observational feature that has provided much insight into the physics of outflows from BAL QSOs is the so-called ‘ghost of Ly ’ (Arav et al. 1995). This term refers to a hump near 5900 km s-1 seen in the troughs of the broad absorption lines of some BAL QSOs. This local maximum can be explained naturally if the outflow is radiatively accelerated via resonance-line scattering (see Arav 1996 and references therein for details). Briefly, according to this model, the ghost is produced when Ly- broad emission line (BEL) photons are resonantly scattered by N v ions in regions of the outflow that are moving at 5900 km s-1 (relative to the Ly emission line region). These scatterings transfer momentum and thus accelerate the wind locally, causing a decrease in the optical depth at 5900 km s-1 in velocity space. Thus observers viewing the QSO through the outflow will see an increase in flux at this velocity within the BAL troughs. Furthermore, the profile of this feature directly reflects the profile of the Ly BEL; hence the resultant feature is appropriately named ‘the ghost of Ly ’.
If this picture is correct, the ghost feature is a direct signature of the wind driving mechanism and can be used to study the physics governing the outflows from QSOs. Despite the potential significance of the ghost of Ly for our understanding of (BAL) QSOs, the set of four objects discussed by Arav (1996) is currently still the only observational sample of BAL QSOs exhibiting clear ghost signatures. It is the purpose of this paper to expand this sample. We note from the outset that our selection method is purely observational and thus differs from that used by Arav (1996), who based his selection on criteria derived directly from the radiative-driving model. Our goal here is simply to construct a new empirical sample of strong ‘ghost candidates’, based only on the appearance of their C iv (and, in some cases, Si iv) BALs. We do check (Section 5) that none of the objects in our final sample violate the criteria set out by Arav. However, in many cases the wavelength coverage of the SDSS data we use is insufficient to confirm that all of the criteria are satisfied. We therefore defer detailed comparison of the sample properties to the predictions of the line-driving model for future investigations.
2 Data
We require a set of BAL QSOs not previously scrutinized for ghost signatures. With the recent data releases from the Sloan Digital Sky Survey (SDSS), we have access to an unprecedented number of QSOs, including many BAL QSOs. As a first step, here we take as our parent sample the BAL QSO catalogue presented by Reichard et al. (2003), which is based on the SDSS Early Data Release (EDR). For the purpose of our analysis, we have chosen to select only objects whose spectra fully cover the C iv BEL and its associated BAL. The C iv BAL tends to display a particularly deep, well-defined trough and is thus the most likely BAL to exhibit a clear ghost feature. Thus, given the wavelength coverage of the SDSS 1-D spectra, a suitable redshift window of was identified111We adopt the redshifts given by Reichard et al. (2003) unless otherwise noted.. Reichard et al.’s (2003) sample, almost inevitably, covers this nicely and, out of a possible 224, immediately provided us with 198 suitable BAL QSOs. The 1-D spectra of these objects were extracted directly from the SDSS web site, using the on-line data query form. These spectra are fully reduced, wavelength-calibrated, sky-subtracted and corrected for galactic extinction.
3 Methodology
The approach taken in this study is to progressively sub-divide our BAL QSO sample into sensible categories, at each step eliminating those objects that do not show convincing ghost signatures. For each sub-sample, we produce a composite spectrum to highlight structure that is common to objects across the sample.
Figure 1 illustrates our attempt to sub-divide the full BAL QSO sample into manageable and, hopefully, more revealing data sets. Starting from the complete set of BAL QSOs contained within our redshift window, we first create two subsets, namely, the high-ionization BAL QSOs (HiBALs) and low-ionization BAL QSOs (LoBALs). We adopt Reichard et al.’s ‘by eye’ classifications for this purpose with his FeLoBALs being classified as LoBALs. The primary reason for this step is that it is more common to see highly structured BALs in LoBALs. One might therefore expect it to be more difficult to find clear ghost signatures amongst individual LoBALs.
The next sub-division splits these samples into groups exhibiting single trough (ST) and multiple trough (MT) BALs. Our working definition of a MT BAL is simply that it should exhibit more than one clear minimum in its absorption trough. This classification process was done by eye. The justification for this division is that all ghost candidates must exhibit MTs, as by definition the ghost feature is a local maximum in a BAL thus dividing what would have been a single trough into a double trough. As expected, the proportion of MTs is somewhat higher amongst the LoBALs (36%) than the HiBALs (28%). Even though we expect it to be more difficult to find convincing ghost candidates amongst the LoBAL MT set, we feel it is nevertheless important to inspect all BAL QSO exhibiting MTs for this feature. We therefore re-merge the MT HiBAL and LoBAL sets before making our final rejection cuts.

In order to help us distinguish likely ghost features from other BAL structure, we now introduce the concept of a ‘ghost zone’ (GZ). This is defined as the region in velocity space within which we would expect to see the peak of the ghost signature. More specifically, we define the limits of the GZ by the most extreme combinations of the doublet structures that give rise to the signature itself (see Arav 1996 for further discussion). Thus we first calculate the rest-frame velocity differences between Ly and each of the two N v doublet transitions. We then locate where in the spectra these velocities occur for each of the doublet pairs in the BELs/BALs of interest (C iv [always] and Si iv [where available]). The maximum and minimum values of these locations fundamentally define the edges of the GZs for Si iv and C iv. We finally slightly expand the GZs to allow for redshift errors. These are larger for BAL QSOs than ‘ordinary’ QSOs, in part due to the blue wing absorption of the BEL, with typical values (statistical + systematic) around (Donald Schneider, personal communication; see also Schneider et al. 2002). In practice, we actually expect uncertainties to be more constant in velocity than in redshift. We therefore expand the GZs by multiplying the limiting wavelengths by a factor , where is the median redshift of the full BAL QSO sample, and the positive and negative signs refer to the red and blue edges of the GZ, respectively.
We now pare down our full MT sample by carrying out three rejection cuts. In the first cut, we remove what we consider obvious non-ghosts and weak candidates. Thus, in this cut, we reject objects exhibiting bumps well away from ‘ghost’ velocities; sources with particularly low S/N spectra; and sources with highly structured BALs. At the end of this iteration, we are left with our ‘Rejection Cut 1’ (RC1) and ‘Ghost Candidates First Cut’ (GC1) samples.
The second and third rejection cuts are necessarily more subjective and designed to leave a final sample that contains only sources with clear, strong, local maxima in their BALs that appear well within their GZs. The corresponding sets of rejected objects (‘Rejection Cut 2’ [RC2] and ‘Rejection Cut 3’ [RC3]) thus contain objects with more than one local maximum in their BALs, features at/beyond the edges of the GZ, etc. The distinction between RC2 and RC3 is simply that the RC3 sample comprises only those objects that narrowly missed inclusion in our best sample. We thus regard the five objects in RC3 as fairly strong ghost candidates in their own right. The set of seven objects that pass all of our rejection cuts comprise our best sample of ghost candidate (‘Ghost Candidates Final Cut’ [GCF]).
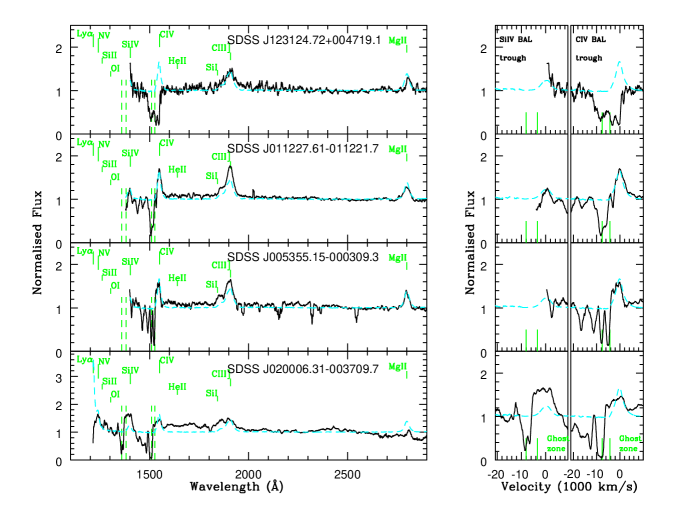
Since the three rejection steps outlined above are the most subjective aspects of our selection process, we show in Fig. 2 selected spectra from the RC1 & RC2 samples, and in Fig. 3 all spectra for the RC3 sample. These figures illustrate the sort of decisions we were faced with, and we now briefly describe our reasoning in making these decisions.

The top two panels in Fig. 2 show objects selected from the RC1 sample. SDSS J123124.71+004719.1 displays a feature in the C iv GZ, but is rejected at this stage due to the additional structure in its BAL and the relatively low S/N ratio of its spectrum. SDSS J011227.60011221.7 is clearly an MT BAL QSO, but no feature is located in or near to the GZ of C iv.
The bottom two panels in Fig. 2 show spectra drawn from the RC2 sample. SDSS J005355.15000309.3 shows a clear local maximum centred in the GZ of C iv. However, there are also two other local maxima blueward of this potential ghost feature. In fact, this object might not be a BAL QSO at all, and the apparent BAL structure might instead be due to multiple narrow absorbers. SDSS J20006.31003709.7 also has a clear feature in the C iv BAL, but, for the redshift adopted by Reichard et al. (2003), it is well outside the C iv GZ. We have nevertheless classified this as RC2 (rather than RC1), since the flattened appearance of the BELs casts some doubts over the reliability/accuracy of the redshift estimate for this object.
Finally, we comment briefly on the RC3 spectra shown in Fig. 3. SDSS J143022.47002045.2, SDSS J145045.42004400.3 and SDSS J171330.98+610707.8 all display deep, broad BAL troughs with significant features right on the blue edges of their respective GZs. The off-centre location of the features is the reason for their rejection, but clearly all are nevertheless reasonable ghost candidates. SDSS J113544.33+001118.6 appears to have a feature that is more closely centred in the C iv GZ. The only reason for its inclusion in RC3 rather than GCFC is the fact that the spectrum is relatively noisy. Finally, SDSS J110736.67+000329.4 also has a feature in the C iv GZ, but this feature is of similar size as those found to the red of the Si iv BEL.
Indeed, it is worth emphasizing again at this point that our main goal here is simply to construct a sample of BAL QSO showing particularly strong and convincing ghost of Ly feature in their spectra. By its nature, this sample is not complete in any statistically meaningful sense. In particular, we believe the rejection cuts leading to our GCF sample are quite conservative. Thus our rejection samples may contain additional ghost candidates, and the RC3 sample, in particular, contains objects that missed inclusion in our best GCFC sample by only the narrowest of margins.
4 Composite spectra
In this section, we present and discuss composite spectra we have produced for our various samples. Our rationale for producing these composites is that they allow us to search for spectral features that are common to a significant fraction of a given sample. This is useful, since, if BAL QSO outflows are radiatively driven, ghosts should be more common than other types of BAL structure. We may then expect to see ghosts even in composites constructed from samples that have not been specifically selected for displaying this feature (i.e., samples high up in the hierarchy in Fig. 1).
Each composite is constructed as the arithmetic mean of the normalized BAL QSO spectra within a given sample. The normalization is done by fitting a composite spectrum, allowing for differences in reddening, systematic offset and power law index, to selected continuum windows for each source in the sample and dividing the spectrum by the fit. This method is based upon that described by Reichard et al. (2003). The resulting normalized composites are shown in Figs. 4 and 5. For comparison, we have also constructed a composite from the full EDR QSO sample in the same way, and this is shown overlaid on each of our BAL QSO composites.
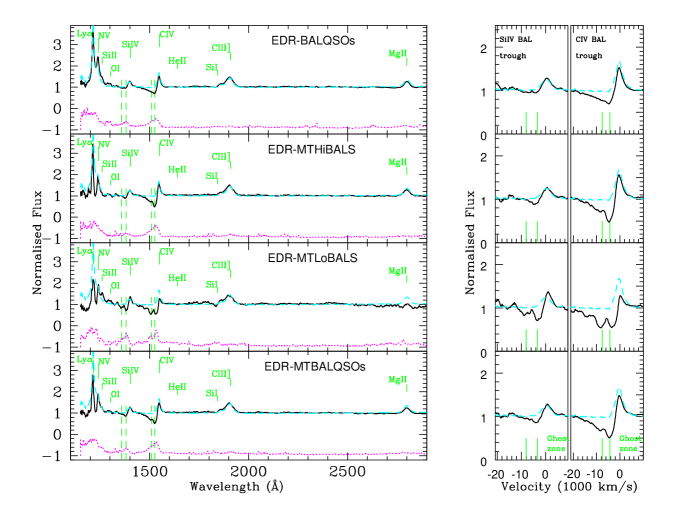
We begin by displaying the composite of the full set of 198 BAL QSOs satisfying our redshift constraints (Fig. 4, EDR-BAL QSOs). This spectrum is well matched by the EDR-QSO, except within the BAL regions themselves. This is as expected, since the EDR-QSO sample is dominated by non-BAL QSOs with only a small admixture (15%) of BAL QSOs.
Fig. 4, EDR-MTHiBALs shows the composite for the EDR multi-trough HiBALs sample. Again we see very good agreement with the EDRQSO composite throughout the spectrum with the exception of the BALs. However, unlike the EDR-BAL QSO full sample we do see a feature starting to appear within the GZ of C iv. It is also interesting to note that the C iv BAL trough is deeper in this composite than in the full BAL QSO one. In line with this, the trough between Ly and N v, which is most likely due to the N v BAL, is much deeper in the MTHiBAL composite than in the full BAL QSO one. Thus, whatever the origin of the multiple-trough structure, it appears to be associated with (or more easily seen in) objects displaying particularly strong BALs. The relative strength of the N v BAL trough in a composite displaying a feature in the GZ is, of course, in line with the dynamical model for the ghost of Ly . After all, in the context of this model, the feature is due to locally enhanced acceleration due to the scattering of Ly photons by N v ions in the flow.
Fig. 4, EDR-MTLoBALs shows the multi-trough LoBAL composite. This spectrum contains strong C iv and Si iv BALs, with clear features in both ghost zones. This confirms the detection of an apparent ghost feature in the LoBAL composite presented by Reichard et al. (2003b). Closer inspection of the feature within the Si iv GZ reveals that it is double-peaked, with a peak-to-peak separation consistent with the Si iv doublet separation (2000 km s-1). This is consistent with the idea that this feature is caused by an optical depth reduction due to Ly -N v line-locking.
The final composite in Fig. 4, EDR-MTBAL QSOs, corresponds to the merged MT HiBALs and MT LoBALs samples. This composite looks very similar to the MTHiBALs one, which is unsurprising, since the MT HiBALs out-number the MTLoBALs by about 4:1.
We now turn to the composites for the samples generated by our various rejection cuts, including that for our final, best-bet ghost candidate sample. These composites provide a useful test of our selection criteria and are shown in Fig. 5.
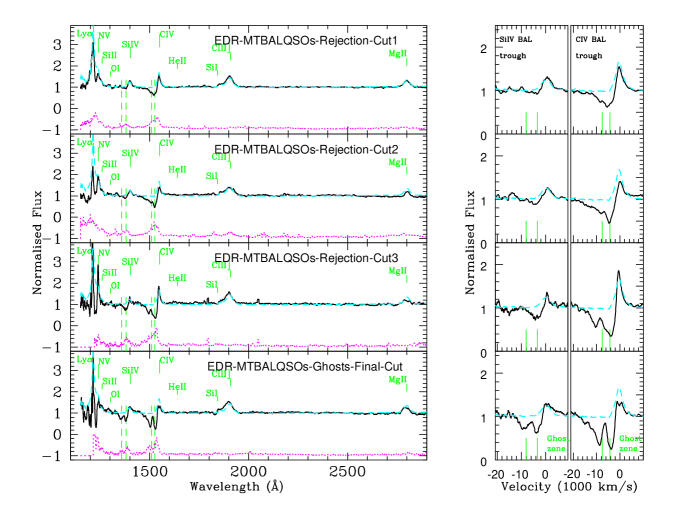
Fig. 5, ‘EDR-MTBAL QSOs-Rejection-Cut1’, shows the composite for the sample of objects rejected in Rejection Cut 1. Since none of the objects removed by this cut individually exhibited a convincing ghost feature, we also do not expect to see a clear feature in the GZs of the composite. This expectation is largely confirmed although even this composite shows a slight hint of a feature in the C iv GZ.
The next two composites (‘EDR-MTBAL QSOs-Rejection-Cut2’ and ‘EDR-MTBAL QSOs-Rejection-Cut3’) correspond to the samples of objects removed by Rejection Cuts 2 and 3. As already discussed above, these cuts (especially RC3) were quite stringent, and the resulting samples are quite likely to contain objects with genuine (and possibly even quite strong) ghost features. It is therefore not surprising that both samples show clearer features in the C iv GZ, and that the RC3 composite, in particular, displays quite a strong local maximum just beyond the blue edge of the GZ. The off-centre location of these features in the composites deserves additional comment. At first sight, this would seem to be inconsistent with the ghost of Ly mechanism. However, it is important to remember that we are dealing with composites constructed from BAL QSOs whose redshifts are uncertain to about , whose underlying BAL troughs can be quite asymmetric (being deeper redwards of the GZ), and whose ionisation fractions can differ (ref. section 3, GZ definition). The combination of slightly shifted spectra with asymmetric BALs of this type will produce a composite in which any ghost feature is offset to the blue, even if the ghosts in individual spectra are intrinsically at the correct location. In the specific case of the RC3 sample, inspection of the individual spectra in Fig. 3 shows that three objects in this sample exhibit features near the centre of the GZ, while two show features near or just beyond the blue edge.
The final composite displayed in Fig. 5 is that of our best sample of ghost candidates (EDR-MTBAL QSOs-Ghosts-Final-Cut). This composite shows a very clear ghost signature in C iv. Given the way in which this sample has been selected, this is no great surprise. However, it is encouraging that, in this composite, there is even a feature in the GZ of Si iv.
5 Notes on individual objects
In this section we present and briefly discuss the seven objects that make up our final sample. These objects have survived all of our rejection cuts, and we thus consider all of them to be extremely strong ghost candidates. Table LABEL:Table01 gives additional information for each object.
One of our goals here is to check to what extent the objects in our sample satisfy the criteria laid out by Arav (1996) for ghost formation. Briefly, these criteria are
-
1.
The presence of a significant C iv BAL trough between 3000 km s-1 and 9000 km s-1.
-
2.
The presence of a strong and relatively narrow Ly- emission line.
-
3.
A clear BAL associated with N v.
-
4.
The power () emitted in the region 200–1000Å should be weak compared that emitted longward of Ly. As explained below, this criterion can be tested indirectly by requiring weak/absent He ii 1640Å.
The last condition arises from the requirement that N v should contribute a significant fraction of the total radiative acceleration of the BAL flow. The Ly- forest region contains a result of the large number of resonant transitions, so if a lot of energy is available in this region of the spectrum, these transitions will contribute strongly to the total driving force. As noted by Arav (1996), the equivalent width of He ii 1640Å is known to correlated with the intrinsic flux at the He ii ionization energy at 228Å, so weak or absent He ii 1640Å can serve as a convenient proxy for the last criterion.
Having laid out the criteria for the formation of the ghost of Ly , we now briefly discuss each of our strong ghost candidates, displayed in Fig. 6.
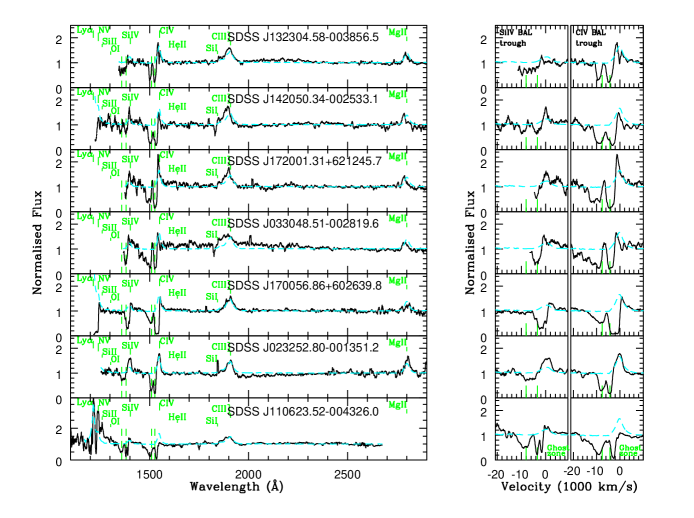
5.1.1 SDSS J132304.58003856.5
(HiBAL) We first note the lack of Ly and N v coverage for this object, which prevents us from testing criteria 2 and 3. Criteria 1 and 4 are clearly met, however. The ghost feature itself is very pronounced and surrounded by a strong, deep BAL trough on both sides. The local maximum is located closer to the blue edge of the GZ, but inspection of the C iii] and Mg ii BELs suggests that the redshift may be at fault. If the redshift is adjusted so that these two BELs are found at their expected locations, the ghost feature is also better centred in the GZ.
5.1.2 SDSS J142050.34002553.1
(LoBAL) This object again shows a strong C iv BAL and a clear feature centred in the ghost zone. However, Mg ii and C iii] again appear to be somewhat misaligned, and in this instance centring on these lines shifts the peak of the ghost feature further to the red edge of the GZ. The Si iv BAL shows a deep trough either side of the Ghost feature. Shifting the spectrum to centre Mg ii and C iii] serves to centre this feature in the middle of the GZ. Closer inspection of the Si iv feature also reveals the expected double peak structure. Again there appears to be little or no trace of a He ii 1640Å. There is no coverage of Ly , but the steep drop near the blue end of the spectrum probably corresponds to the red end of the N v BAL. Thus we cannot test for criterion 2, but criteria 1, 3 and 4 are satisfied by this object.
5.1.3 SDSS J172001.31+621245.7
(HiBAL) Again there is a lack of coverage of both Ly and N v for this object. The C iv BAL is strong and broad, and exhibits a clear local maximum in the GZ. This feature again sits close to the blue edge of the GZ, but a redshift adjustment that centres Mg ii again centres the ghost feature also. There is no obvious He ii emission. Thus two of the four criteria are clearly met, while the other two cannot be tested.
5.1.4 SDSS J033048.51002819.6
(HiBAL) All of the comments just made for SDSS J172001.31+621245.7 also apply here. This includes the improvement in the position of the ghost feature when the redshift is optimized to centre the Mg ii line. Again, two criteria are met, and two cannot be tested.
5.1.5 SDSS J170056.85+602639.8
(HiBAL) This object displays a spectrum that cuts off near N v. There is no coverage of Ly , but, as in the case of SDSS 142050.34-002553.1, the steep drop at the blue end of the spectrum suggests the presence of a strong N v BAL. The candidate ghost feature is well centred in the C iv GZ, in line with the fact that Mg ii and C iii] appear to be well centred. There is no obvious He ii 1640Å emission, so criteria 1, 3 and 4 are met and only criterion 2 (presence of strong Ly ) cannot be tested.
5.1.6 SDSS J023252.80001351.2
(HiBAL) The candidate ghost feature in the object is located in a deep, clear C iv BAL trough and is well centred in the GZ. Mg ii and C iii] are also well centred, confirming Reichard et al.’s (2003) redshift estimate. There is again no coverage of Ly and N v, but also no sign of He II 1640Å. Thus two of the ghost criteria are met, and two cannot be tested.
5.1.7 SDSS J110623.52004326.0
(LoBAL) Our final ghost candidate is the only object in this sample that does have coverage of the Ly BEL. The line is certainly strong, although its breadth is difficult to judge due to the presence of other transitions (including N v). A strong N v BEL is also present and accompanied by a deep BAL. The C iv BAL is strong and deep, and contains a clear local maximum that is centred in the GZ. The spectral coverage does not extend to Mg ii, but C iii] appears to be reasonably well centred. This object also shows a clear feature in the Si iv GZ, but there is also another, narrower local maximum redwards of the putative ghost feature in this line. All of the ghost criteria are satisfied making this our strongest candidate.
| Object ID | Reichard’s BI | Redshift | Magnitude | S/N | Category |
|---|---|---|---|---|---|
| J110623.52004326.0 | 4034 | 2.450 | 19.38 | 10.140 | GC : FC |
| J023252.80001351.2 | 2092 | 2.025 | 19.28 | 10.160 | GC : FC |
| J170056.85+602639.8 | 1400 | 2.125 | 19.24 | 9.427 | GC : FC |
| J033048.51002819.6 | 5548 | 1.779 | 19.62 | 6.593 | GC : FC |
| J172001.31+621245.7 | 3290 | 1.762 | 19.47 | 5.781 | GC : FC |
| J142050.34002553.1 | 3442 | 2.103 | 19.90 | 4.345 | GC : FC |
| J132304.58003856.5 | 287 | 1.828 | 18.64 | 8.491 | GC : FC |
| J143022.47002045.2 | 1957 | 2.544 | 20.72 | 2.473 | PG : RC3 |
| J145045.42004400.3 | 238 | 2.078 | 18.59 | 14.120 | PG : RC3 |
| J171330.98+610707.8 | 0 | 1.685 | 19.10 | 8.611 | PG : RC3 |
| J113544.33+001118.6 | 3379 | 1.723 | 20.32 | 4.958 | PG : RC3 |
| J110736.67+000329.4 | 123 | 1.740 | 18.65 | 18.570 | PG : RC3 |
| J005355.15000309.3 | 1088 | 1.715 | 18.60 | 13.230 | PG : RC2 |
| J010616.05+001523.9 | 2520 | 3.050 | 20.46 | 2.649 | PG : RC2 |
| J010612.21+001920.1 | 2453 | 3.110 | 19.19 | 7.406 | PG : RC2 |
| J020006.31003709.7 | 9550 | 2.136 | 18.81 | 14.020 | PG : RC2 |
| J025042.45+003536.7 | 3544 | 2.380 | 19.29 | 7.418 | PG : RC2 |
| J100809.63000209.9 | 56 | 2.561 | 19.24 | 5.162 | PG : RC2 |
| J104109.85+001051.8 | 1913 | 2.250 | 19.14 | 12.090 | PG : RC2 |
| J104233.86+010206.3 | 401 | 2.123 | 18.93 | 14.020 | PG : RC2 |
| J104841.02+000042.8 | 1176 | 2.022 | 18.91 | 12.730 | PG : RC2 |
| J120657.01002537.8 | 110 | 2.005 | 19.45 | 6.306 | PG : RC2 |
| J123947.61+002516.2 | 7299 | 1.869 | 20.27 | 2.972 | PG : RC2 |
| J130035.29003928.4 | 853 | 3.630 | 20.28 | 2.994 | PG : RC2 |
| J134544.55+002810.8 | 1510 | 2.516 | 18.83 | 11.070 | PG : RC2 |
| J134808.79+003723.2 | 1309 | 3.620 | 20.36 | 2.697 | PG : RC2 |
| J143054.03003627.3 | 9064 | 3.710 | 22.31 | 0.372 | PG : RC2 |
| J145913.72+000215.8 | 356 | 1.910 | 18.63 | 12.990 | PG : RC2 |
| J151636.79+002940.4 | 4035 | 2.240 | 18.48 | 12.650 | PG : RC2 |
| J171944.76+554408.3 | 205 | 3.886 | 21.74 | 1.230 | PG : RC2 |
| J171949.92+532132.8 | 4903 | 1.777 | 18.22 | 16.940 | PG : RC2 |
| J173911.52+565550.9 | 919 | 1.772 | 19.28 | 8.888 | PG : RC2 |
| J234506.32+010135.5 | 2488 | 1.794 | 19.70 | 7.732 | PG : RC2 |
| J134145.13003631.0 | 870 | 2.205 | 19.57 | 8.652 | PG : RC2 |
| J000056.89010409.8 | 1560 | 2.111 | 20.41 | 3.437 | PG : RC2 |
| J143022.47002045.2 | 1957 | 2.544 | 20.72 | 2.473 | PG : RC2 |
| J003551.98+005726.3 | 1731 | 1.905 | 19.24 | 8.533 | PG : RC1 |
| J004041.39005537.3 | 0 | 2.092 | 18.18 | 17.240 | PG : RC1 |
| J011227.60011221.7 | 3033 | 1.755 | 18.12 | 16.320 | PG : RC1 |
| J012913.70+011428.0 | 345 | 1.782 | 19.50 | 6.105 | PG : RC1 |
| J015048.82+004126.2 | 105 | 3.703 | 19.76 | 5.479 | PG : RC1 |
| J024221.86+004912.7 | 229 | 2.071 | 18.54 | 16.480 | PG : RC1 |
| J031227.13003446.2 | 0 | 1.772 | 19.72 | 7.315 | PG : RC1 |
| J104152.61001102.1 | 1588 | 1.703 | 19.21 | 12.580 | PG : RC1 |
| J110041.19+003631.9 | 4687 | 2.017 | 18.62 | 15.030 | PG : RC1 |
| J121803.28+001236.8 | 269 | 2.010 | 19.44 | 8.181 | PG : RC1 |
| J122228.39011011.0 | 678 | 2.284 | 19.74 | 5.290 | PG : RC1 |
| J123124.71+004719.1 | 3134 | 1.720 | 19.57 | 5.513 | PG : RC1 |
| J123824.90+001834.5 | 220 | 2.154 | 19.30 | 6.652 | PG : RC1 |
| J130348.94+002010.4 | 1425 | 3.655 | 20.77 | 1.525 | PG : RC1 |
| J170903.06+594530.7 | 4936 | 1.708 | 19.18 | 10.250 | PG : RC1 |
| J170931.00+630357.1 | 0 | 2.402 | 18.41 | 13.090 | PG : RC1 |
| J170951.03+570313.7 | 528 | 2.547 | 20.95 | 2.505 | PG : RC1 |
| J172012.40+545601.0 | 1249 | 2.099 | 18.47 | 21.920 | PG : RC1 |
| J232205.46+004550.9 | 222 | 1.820 | 20.55 | 3.032 | PG : RC1 |
| J032246.82005148.9 | 0 | 1.680 | 19.60 | 7.193 | PG : RC1 |
| J130208.26003731.6 | 0 | 1.672 | 18.44 | 13.510 | PG : RC1 |
| J125241.55002040.6 | 2524 | 2.898 | 18.90 | 10.230 | PG : RC1 |
6 Discussion
Of the 198 SDSS EDR BAL QSOs identified by Reichard et al. (2003), 33 are identified as LoBALs and 165 as HiBALS. This is consistent with the incidence of HiBALs and LoBALs amongst the BAL QSO population (Sprayberry & Foltz 1992). We find that , the fraction of BAL QSOs displaying clear ghost signatures, lies in the range . This corresponds to a ghost frequency of (a few per cent) amongst QSOs in general. While it is of interest to compare the relative fractions of ghosts amongst HiBALs and LoBALs (5/165 and 2/33 respectively), the small-number statistics preclude us from drawing any firm conclusions at this time concerning their likely incidence.222The classification of J142050.34002553.01 as a LoBAL is uncertain (Reichard et al. 2003) This question will be addressed in a forthcoming analysis of BAL QSOs in the SDSS DR3/4 releases. Whilst we have endeavored to test Arav’s selection criteria for ghost candidates (see Section 5), this was not possible in every circumstance. We note that adherence to Arav’s stringent selection criteria will only be possible, whilst providing good statistics, with the far larger SDSS DR3/4 datasets. However, we note that none of our Ghost Candidate Final Cut (GCFC) set violates Arav’s selection criteria (in so far as they can be verified) for ghost candidates.
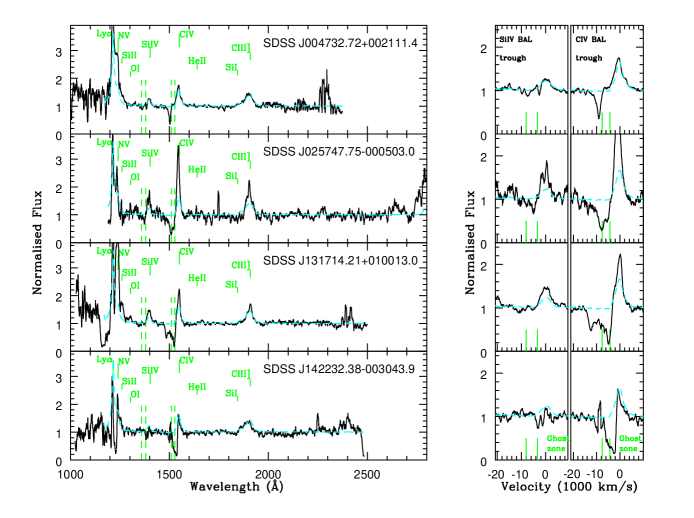
As a final sanity check, we felt it important to perform two additional tests. The first was to turn Arav’s theorem around and ask if there are objects in the SDSS EDR sample that satisfy all of the criteria but do not exhibit ghost features. If the line-locking interpretation for the origin of the ghost is correct, such objects should not exist (Arav 1996). We have carried out this exercise and inspected by eye all 74 objects in the SDSS-EDR BAL QSO sample, but not present in our GCFC set, that contain the region between Lyman alpha and He ii that is the minimum necessary to test all the criteria. We find that 56 of these 74 BAL QSOs clearly do not satisfy at least one of Arav’s selection criteria (e.g. Fig. 7, SDSS J004732.72+002111.4). The remaining 18 appear to be borderline cases, i.e., they exhibit a degree of ambiguity in just one of the criteria. All of these objects were cut at RC1. Of these, most show the C iv BAL returning to continuum level at around 9000 km s-1 but do contain the slightest hint of a ghost (e.g. Fig. 7, SDSS J025747.75000503.0). In line with this is the appearance of a relatively weak N v BAL; thus only a weak ghost should, perhaps, be expected. Of the remaining MT BAL QSOs, a couple actually appear to satisfy all criteria but show no ghost (e.g. Fig. 7, SDSS J131714.21+010013.0). However, we note that for these two objects there is relatively weak continuum emission compared to the red end of the Ly forest and thus Arav’s criteria still hold. This does, however, cast some doubt on the reliability of using He ii emission as a proxy for Ly- forest flux. One final object in this set of 18 BAL QSOs is the clearest object that ‘should’ reveal a Ghost (ref. Fig. 7, SDSS J142232.38003043.9). However, this was rejected at RC1 purely on the basis that it possesses an additional emission feature just blueward of the ghost zone (most likely a residual sky line), which obscures what otherwise appears to be a genuine ghost. Evidently, these results show a small degree of ambiguity, but again, the vast numbers of DR3/DR4 will enable us to provide robust evidence as to the validity of this hypothesis.
The second test we performed was to confirm that there really is an excess of objects with "bumps" in the ghost zone. To achieve this we have carried out the following. The GZ was systematically offset by 2000 km s-1 both to the red and to the blue of its correct location. The full analysis of the MTBAL QSO set was then reperformed for these two new locations. With the GZ shifted artificially to the red there were no objects that made it to the GCFC stage. Clearly, the distribution of objects within each rejection cut stage was altered but the net effect was to find no ‘good’ ghost candidates. With the GZ shifted artificially to the blue a GCFC set of six objects was produced. Of these 6 objects, 4 are from our original RC3 sample, 1 is from the original GCFC sample and only 1 new object was introduced. Again, as for the red-shifted GZ the distributions amongst the rejection cut stages were altered slightly. However, this analysis clearly confirms that the "bumps" in the absorption troughs of our best ghost candidates are likely to be genuine ghosts of Lyman alpha.
7 Conclusions
We have searched Reichard et al.’s (2003) BAL QSO catalogue, based on the SDSS EDR, for objects displaying clear ‘ghost of Ly ’ signatures. To this end, we have carried out several stages of rejection, constructing a number of sub-samples along the way. Since our selection criteria are quite strict, some of the features we have rejected along the way may nevertheless be genuine ghosts (and this is especially true for the 5 objects rejected in our third and final cut, i.e., the RC3 sample).
Our very best sample contains seven objects that have survived all of our cuts. All of these display strong and broad C iv BALs, and all exhibit clear local maxima at the locations expected for the ghost signature. None of them have been found to violate any of the criteria laid out by Arav (1996) for the formation of the ghost of Ly . However, in most cases the limited wavelength coverage of the data prevents us from testing for all criteria simultaneously. Nevertheless, we believe that all objects in this sample are excellent ghost candidates.
It is our hope that this paper will encourage follow-up observations and detailed modelling of the objects in our sample. After all, the ghost of Ly represents the clearest observational signature of (and the only direct evidence for) the mechanism that powers outflows from (BAL) QSOs. As such, it has been underexploited. For example, the variability properties of the ghost signature remain completely unknown at present. We plan to rectify this in the near future, using our new sample of objects as a basis. The goal of this program will be to test if ghost variability can be used to gain insight into the BAL region, in the same way that classical reverberation mapping has yielded key information regarding the nature of the BEL region.
Acknowledgements
We thank Professor Kirk Korista for his valuable input into the production of this paper and also thank Dr Gordon Richards for his positive and helpful contribution.
References
- (1) Arav, N., Korista, K.T., Barlow, T.A., Begelman, M.C. 1995, Nature, 376, 576.
- (2) Arav, N. 1996, ApJ, 465, 617.
- (3) Foltz, C.B., Chaffee, F.H., Hewett, P.C., Weymann, R.J., Morris, S.L. 1990, BAAS, 22, 806.
- (4) Hewett, P.C., Foltz, C.B. 2003, AJ 125 1784.
- (5) Korista, K.T., et al. 1992, ApJ, 401, 529.
- (6) Reichard, T.A., et al. 2003, AJ, 125, 1711. (2003)
- (7) Reichard, T.A., et al. 2003, AJ, 126, 2594. (2003b)
- (8) Schneider, D.P., et al, 2002, AJ, 123, 567.
- (9) Sprayberry, D., & Foltz, C. B. 1992, ApJ, 390, 39.
- (10) Stocke, J.T., Morris, S.L., Weymann, R.J., Foltz, C.B., 1992, ApJ, 396, 487.
- (11) Weymann, R.J., Morris, S.L., Foltz, C.B., Hewett, P.C. 1991, ApJ, 373, 23.