Prompt optical observations of GRB050319 with the Swift UVOT
Abstract
The UVOT telescope on the Swift observatory has detected optical afterglow emission from GRB 050319. The flux declines with a power law slope of between the start of observations some 230 seconds after the burst onset (90s after the burst trigger) until it faded below the sensitivity threshold of the instrument after s. There is no evidence for the rapidly declining component in the early light curve that is seen at the same time in the X-ray band. The afterglow is not detected in UVOT shortward of the B-band, suggesting a redshift of about 3.5. The optical V-band emission lies on the extension of the X-ray spectrum, with an optical to X-ray slope of . The relatively flat decay rate of the burst suggests that the central engine continues to inject energy into the fireball for as long as a few s after the burst.
1 Introduction
The Swift observatory (Gehrels et al. 2004) is designed to localise Gamma-ray bursts on the sky rapidly and then bring its X-ray and ultraviolet/optical telescopes to bear on that location within about one minute to provide panchromatic observations of the bursts and their afterglows. Initial information on the burst location and properties is transmitted to the ground in near real time for distribution to follow-up observers. In this letter we describe Swift observations of the burst GRB050319, concentrating on the data from the Ultraviolet and Optical Telescope.
2 Observations and Analysis
The Swift Burst Alert Telescope (BAT; Barthelmy et al. 2005) triggered on the Gamma-ray Burst GRB050319 at 09:31:18.44 UT (Krimm et al. 2005a). The burst lightcurve was initially reported as having a single peak with duration T90 = 10 2 seconds (Krimm et al. 2005b). However subsequent analysis has shown that this was a multi-peaked burst that actually began about 138s before the Swift trigger (Figure 1). The burst exhibits several peaks during an initial period of about 80 seconds, followed by a similar length interval during which the BAT flux is indistinguishable from background, and then the final peak that generated the BAT trigger. The BAT did not trigger on the earlier activity because the spacecraft was slewing; triggers are disabled during slews. The slew ended about 50s before the final peak. The energy index of the 1-s peak spectrum (starting at the trigger time, T, +0.36 sec.) is 0.3 (90% confidence; defined such that ). The time-averaged spectrum of the final peak yields an energy index of –1.2 0.2 (Krimm et al. 2005b).

The Swift spacecraft executed a slew immediately to bring the narrow field X-ray Telescope (XRT; Burrows et al. 2005) and Ultraviolet/Optical Telescope (UVOT; Roming et al. 2005) to bear on GRB050319, and observations with these started about 90 seconds after the burst trigger (230s after the burst onset). In this paper we concentrate on the analysis of the UVOT data and compare with the results from the XRT observations reported by Cusumano et al. (2005). We also consider data from a number of ground-based observatories that responded to the Swift trigger (Yoshioka et al. (2005), Quimby et al (2005), Kiziloglu et al. (2005), Misra et al. (2005), Sharapov et al. (2005a,b), Greco et al. (2005) and Woźniak et al (2005)). The earliest observations were made 27s after the Swift trigger (Quimby et al. 2005).
2.1 Optical decay
The Swift UVOT executed a standard series of exposures, the first of which was a ‘finding chart’ exposure of duration 100s in the V filter that began 90s after the BAT trigger. Thereafter, the instrument cycled through each of six color filters, V, B and U together with filters defining three ultraviolet passbands, UVW1, UVM2 & UVW2 (see Table 2 for central wavelengths). The exposure duration per filter was initially 10 seconds, subsequently increasing to 100s and then 900s at predetermined times after the trigger. The initial data (up to 1700s after the trigger) were taken in ‘event mode’ in which the time and detector position of each individual photon is recorded. For the later exposures, the instrument was switched to ‘image mode’, in which the image is accumulated onboard to conserve telemetry volume, discarding the photon timing information within an exposure. The intrinsic spatial pixel size of the detector is approximately 0.5 arc seconds on the sky, but the image mode data were taken with the data binned 2x2 to give 1 arc second pixels.
| Mid Time1 | Exposure | Magnitude | Error | |
|---|---|---|---|---|
| (s) | Time | (Mag) | ||
| (s) | ||||
| V Band | ||||
| 102 | 25 | 17.03 | 0.22 | |
| 127 | 25 | 16.99 | 0.21 | |
| 152 | 25 | 16.67 | 0.17 | |
| 177 | 25 | 17.28 | 0.26 | |
| 319 | 20 | 17.21 | 0.28 | |
| 506 | 20 | 17.56 | 0.34 | |
| 788 | 40 | 18.70 | 0.69 | |
| 1249 | 100 | 18.54 | 0.35 | |
| 7088 | 700 | 19.65 | 0.29 | |
| 18664 | 689 | 20.35 | 0.57 | |
| 30217 | 726 | 20.07 | 0.42 | |
| 41791 | 718 | 20.09 | 0.43 | |
| B Band | ||||
| 243 | 10 | 18.24 | 0.38 | |
| 333 | 10 | 18.17 | 0.36 | |
| 428 | 10 | 18.73 | 0.52 | |
| 522 | 10 | 19.19 | 0.86 | |
| 756 | 40 | 19.42 | 0.48 | |
| 1036 | 100 | 18.76 | 0.17 | |
| 1637 | 26 | 19.5 | ||
| 5370 | 900 | 20.63 | 0.25 | |
| 16951 | 900 | 21.54 | 0.60 | |
| 28491 | 897 | 21.27 | 0.47 | |
| 40064 | 900 | 21.5 | ||
| 51638 | 900 | 21.5 |
Note. — 1 Time since 2005 Mar 19 9hr 31m 18.44s
| Filter | Effective | Integrated | Counts/s | Zeropoint | Flux |
|---|---|---|---|---|---|
| Wavelength) | exposure | (units 10-16 | erg cm-2 s-1 Å-1) | ||
| (Å) | (s) | ||||
| V | 5430 | 80 | 1.05 0.18 | 2.64 | |
| B | 4340 | 80 | 1.31 0.22 | 1.33 | |
| U | 3440 | 90 | 0.36 | 1.54 | |
| UVW1 | 2600 | 90 | 0.15 | 3.37 | |
| UVM2 | 2200 | 90 | 0.09 | 7.60 | |
| UVW2 | 1930 | 80 | 0.09 | 4.94 |
Note. — upper limits are quoted at 3. The zeropoint is the flux corresponding to 1 c/s.
Examination of the UVOT finding chart exposure reveals a new source within the XRT positional error circle of the burst (Krimm et al. 2005a) at RA = 10h 16m 47.76(3)s Dec = +43d 32m 54.9(5)s J2000. The source fades with time, demonstrating that it is the afterglow of the burst. It has a mean V magnitude of 17.5 during the exposure, which is centered 140s after the burst trigger (278s after burst onset). The position of the afterglow is consistent with that reported by Rykoff et al. (2005). The afterglow is also seen in the UVOT B filter, in which the first observation is a ten second exposure centered 243s after the trigger. It is not present in observations made with any of the shorter wavelength UVOT filters taken around the same time.
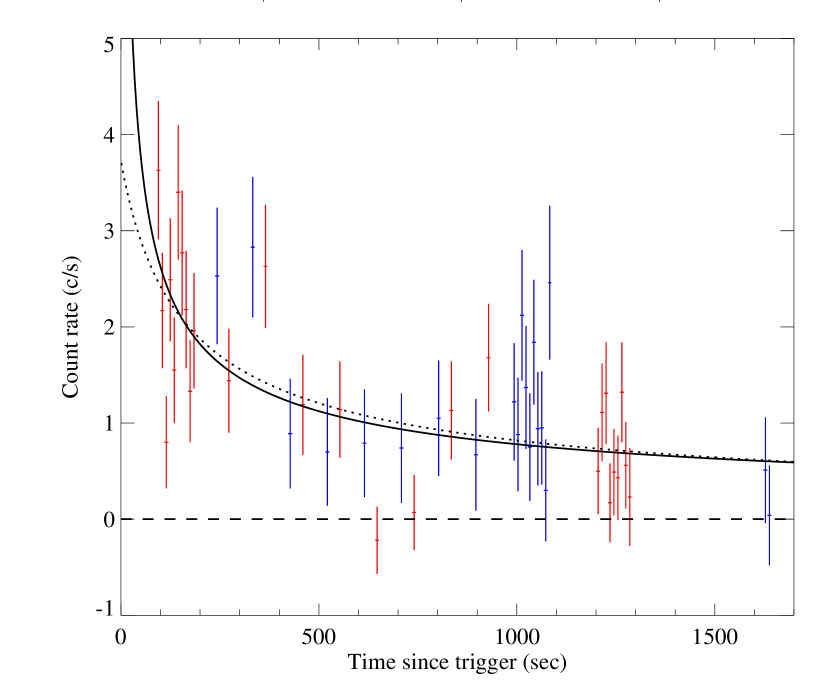
The brightness of the afterglow was measured by extracting the counts from a circular aperture of 6 arc seconds radius centered on the source position. The background was measured from an annular region surrounding the source that had an inner radius of 6 arc sec and an outer radius of 30 arc seconds. Pixels in the background region that were significantly above the mean (due for example to the presence of another star) were rejected. The background count rate varies with Earth aspect angle but is typically 0.01 c/s/arcsec2 in V and 0.02 c/s/arcsec2 in B. In Figure 2 we show the earliest UVOT data, plotted as a detector count rate on a linear scale in 10s bins. These data, taken in event mode, extend to 1700s after the trigger. We include both the V-band and B-band data. By coincidence the count rate in the two filters is very similar, the greater transmission of the instrument in the B band being compensated for by the fact that source is brighter in V. If we compare the count rate in the interval 250-950s after the trigger, when the instrument was cycling often through the two filters, we get a mean count rate of 1.050.18 c/s in V and 1.310.22 c/s in B. These are consistent within the 1 sigma error bounds, but we have multiplied the B-band data in Figure 2 by the mean factor of 0.8 for consistency. A power-law fit to the combined V-band and B-band data, shown as a solid line in the figure, has a slope of . We have included the UVOT datapoints beyond 1700s in this fit. The origin of the power law in this treatment, is taken to be the time of the BAT trigger. However, as noted above, the burst actually began about 138s before the trigger, so the appropriate value of is debateable. We have fit the data allowing to be a free parameter, which yields s, and a slightly steeper slope of . This fit is shown as a dashed line in Figure 2, but is statistically indistinguishable from the case. The reduced value for the power law fit to the time evolution data in 10s bins is 0.75 per d.o.f., which is statistically acceptable.
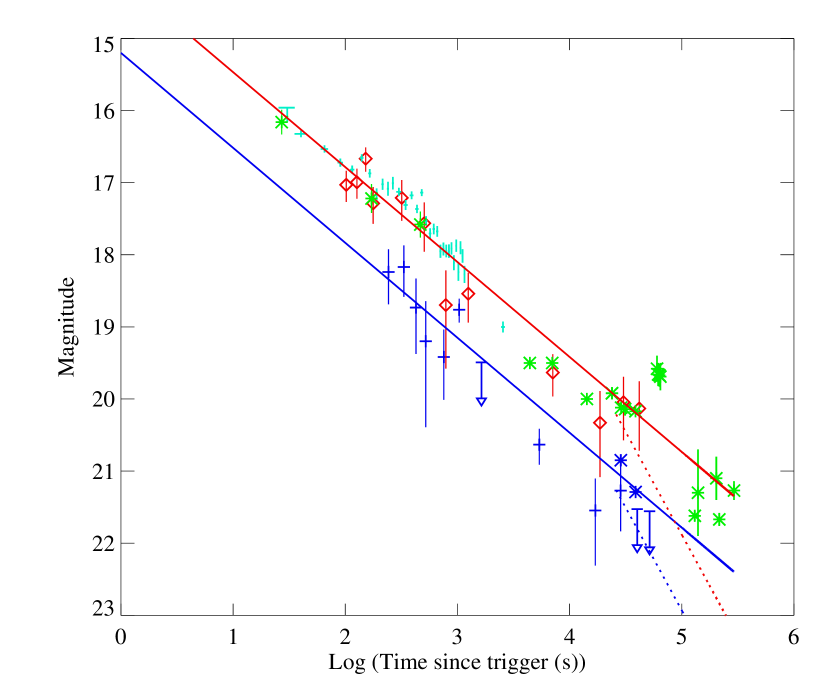
Figure 3 shows the B and V magnitude of the afterglow as a function of time since the trigger. The data, listed in Table 1, have been binned in time with respect to Figure 2 to increase signal to noise. The instrumental count rates are converted to magnitudes and fluxes using preliminary on-orbit calibration data, which might be subject to slight revision as calibration knowledge improves. The zeropoints used are listed in Figure 2. The magnitudes quoted here differ significantly, particularly in the V-band, from those reported by Boyd et al. (2005), which were derived before on-orbit calibration data were available and were therefore based only on ground calibration estimates of the zeropoints. The UVOT magnitude system is defined such that the magnitude of Vega would be zero in each filter.
The power law derived above is compared to both the V-band and B-band data in Figure 3. Both wavebands are consistent with the same overall slope. Specifically, the UVOT data indicate a B-V color of 1 with no evidence of systematic evolution with time. We also show ground-based telescope data reported by Yoshioka et al. (2005), Quimby et al (2005), Kiziloglu et al. (2005), Misra et al. (2005), Sharapov et al. (2005a,b), Greco et al. (2005) and Woźniak et al (2005), most of which report R-band or broadband measurements referenced to the R-band magnitudes of field stars. Comparison of these data with those from UVOT suggest V-R0. However we caution that the transformation of broadband measurements into standard color systems by reference to field stars is subject to systematic uncertainty, particularly, as in this case, when the intrinsic spectrum of the object of interest is likely to be different from that of the average field star.
It is interesting that the decay slope derived from the UVOT data extrapolates well to the early measurement of Quimby et al. (2005) and Woźniak et al (2005); the former authors find R=16.160.17 27s after the Swift trigger, while the latter quote R=16.3230.046 40s after the trigger. Woźniak et al (2005) find that there are systematic deviations from a simple power law during the early decline phase. Though of lower statistical quality, the UVOT data are very consistent with these data in suggesting an excess above the power law in the interval 200-800s after the trigger. Woźniak et al fit a broken power law decay to their data (with Ts). However the later time UVOT and ground based measurements suggest that these deviations can be characterised as fluctuations about a mean slope.
At late times, analysis of the Swift XRT data by Cusumano et al. (2005) indicate that there is a break in the X-ray light curve of GRB 050319 at about sec, from a slope consistent with that of the optical data, to one with . Such a break is indicated in Figure 3 for illustration. While the UVOT data do not constrain the presence of such a break, the late ground based optical data seem to favour an extension of the slope.
2.2 Spectrum
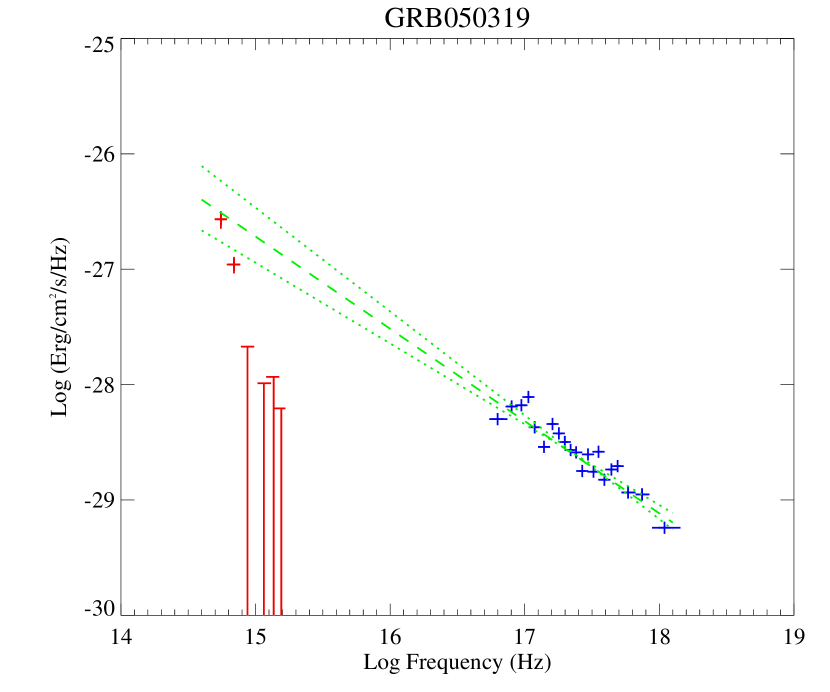
To examine the spectrum of GRB050319, we use data from the interval between 240s and 930s after the trigger, when the UVOT was cycling though each of its six color filters with exposure times of 10s per filter, ensuring that the data from each filter sample the same portion of the decay light curve. The filter wheel was rotated 8.5 times during this interval, yielding 8 observations in the V, B and UVW2 filters, and nine in each of U, UVW1 and UVM2. The mean count rate and flux, or three sigma limit on these quantities, is listed in Table 2. The spectral flux distribution is shown in Figure 4. Reddenning due to the Galaxy in the direction of the burst is very low. At A (Schlegel, Finkbeiner & Davis 1998), no correction is applied in the plot. We also show X-ray data from the Swift XRT averaged over exactly the same time interval as the UVOT data. The count data derived from the XRT during this time period are fitted to a power law spectrum absorbed by a fixed Galactic absorbing column of NH= cm-2. The best fit spectrum has a slope () of . This fit is used to convert the count rate data to incident flux, and these data are then plotted in Figure 4, corrected for the Galactic absorption, to compare with the UVOT measurements.
A simple power law extrapolation of the XRT X-ray spectrum predicts the V-band flux well. However, the UVOT B-band measurement at 435nm and the upper limits to the flux in the U, UVW1, UVM2 and UVW2 filters, which cover the wavelength range 180-390 nm, lie significantly below any reasonable distribution joining the V-band and X-ray data. The B-band flux is lower than the power law joining X-ray and V-band by a factor of 2. This suggests that the optical spectrum is cut-off in the B band. If this is solely due to the Lyman edge at 91.2 nm in the rest frame, the implied redshift of the burst is 3.8. This is effectively an upper limit to the burst redshift since there may be additional sources of opacity in the spectrum longward of the Lyman edge. For example Lyman absorption in the host galaxy or the Lyman forest could contribute to the flux deficit. Fynbo et al. (2005) report an absorption line system at a redshift of 3.24 in the spectrum of the afterglow. This would imply a Lyman edge at 387nm, shortward of 97% of the response of the UVOT B-band filter. The absorption line system is not necessarily due to the host galaxy of the burst, so conservatively we could bracket the burst redshift between 3.24 and 3.8. However the UVOT data would be consistent with a host galaxy redshift of 3.24 provided there is indeed significant additional absorption, due to Lyman for example, in the B band. Based on the IGM transmission model of Madau (1995) the transmission through the B filter is consistent with z=3.24 up to 3.5 at the 1 sigma level, and with z3.8 at the 3 sigma level.
3 Discussion
The UVOT instrument detected and followed the optical afterglow of GRB050319 from when it was acquired by the Swift narrow-field instruments, about 90s after the burst trigger, until it faded below the UVOT sensitivity threshold, about 50,000s later. The afterglow was detected in the V and B bands, but not at shorter wavelengths. Interpreting this spectral cut-off as being due to the Lyman edge of hydrogen suggests an upper limit to the burst redshift of . This is consistent with the reported absorption line system at z=3.24 (Fynbo et al. 2005), which is likely to be the host galaxy of the burst. There is no evidence for significant evolution of the B-V color as a function of the burst decay (Figure 3).
The multiwavelength spectrum of the afterglow, derived from the interval between 240s and 940s after the trigger, suggests that the observed V-band flux (which is at a wavelength of 1300Å in the rest frame of the burst) is an extension of the X-ray spectral distribution. Indeed the combined X-ray and V-band data are perfectly consistent with this slope. The interval used to compile this spectrum begins just after the first break in the X-ray time evolution curve (see below) as reported by Cusumano et al. (2005). The X-ray spectrum before this break is significantly softer () than after () and the interval used for the X-ray spectrum in Figure 4 may be slightly contaminated by the remnants of the soft component. However Cusumano et al. derive a weighted average spectral slope for all the X-ray data after this break of , which is consistent with our X-ray – V-band slope within errors, suggesting any such contamination is minor. The multiwavelength spectrum of GRB 050319 is in accord with expectations from the relativistic fireball model (e.g. Granot & Sari 2002) and suggests that a single optically thin synchrotron afterglow spectrum extends from the X-ray to the (rest frame) UV band. This idea is supported by the fact that the mean optical decay slope is indistinguishable from the decay slope of the X-ray flux in the interval between about 230s and s after the trigger, which is (Cusumano et al. 2005).
The optical flux decays with a mean power law slope of , but there is good evidence for fluctuations from this steady decline, from the UVOT and particularly from the well-sampled early phase coverage of Woźniak et al. (2005). Such variability might be due to fluctuations in the density of the circum-burst medium, or due to continued injection of relativistic material into the fireball (refreshed shock). The shallow overall decay slope, combined with the observed spectral slope would require an unusually flat electron energy spectral index in the context of the simple fireball model (e.g. Granot & Sari 2002). However the idea that the central engine is continuously injecting energy into the fireball may be a more natural explanation of the shallow decay. If we parameterize the injection as producing a luminosity , this continuous injection would influence the dynamics of the fireball, and hence the lightcurves, as long as (Zhang & Mészáros 2001). Assuming that the central engine stops injecting energy after s, we get a consistent solution for the UVOT and XRT lightcurve with in the range and . Both the optical and the X-ray bands are between the injection frequency, and the cooling frequency, throughout. This is satisfied within a wide parameter regime.
Interestingly, prior to T+230s the X-ray flux decays much more steeply, with a power law slope of (Cusumano et al. 2005). Thus at T+90s, when the burst was first acquired by the Swift narrow field instruments, the X-ray flux was more than 20 times brighter than it was at T+230s. There is no evidence for a similar rapidly decaying component in the flux measured with the UVOT, which would have needed to be at about 14th magnitude rather than the observed 17th magnitude at T+100s to match the XRT data. Furthermore, the ROTSE and Raptor data taken as early as 27s after the BAT trigger (Quimby et al. 2005; Woźniak et al. 2005) are also consistent with an extrapolation of the UVOT decay profile to earlier times with no rapidly decaying component. This is firm evidence that the early X-ray afterglow lightcurve is composed of two distinct components. The steep decay is likely to be the tail emission from the internal shocks (mainly due to the so-called curvature effect; Kumar & Panaitescu 2000), while the shallow broadband decay component comes from the external shock afterglow.
Early rapid decay phases have now been seen in a number of bursts with the XRT (cf. Cusumano et al. 2005). Optical observations have been made while the Gamma-ray burst is ongoing in two bursts thus far, GRB990123 (Akerlof et al. 1999) and GRB041219 (Vestrand et al. 2005). In the case of GRB990123 the optical emission was not correlated in time with the gamma-rays, peaking instead approximately 20s after the gamma-ray emission. A possible explanation for the optical light in this case is that it arose in the reverse shock driven in to the ejecta by interaction with the surrounding medium (Mészáros & Rees 1997; Sari & Piran 1999; Zhang, Kobayashi & Mészáros 2003). However, in the case of GRB041219, the optical emission was well corellated with the gamma-rays, suggesting that it arose due to internal shocks in the ultra-relativistic ejecta itself (Vestrand et al. 2005). If the rapidly decaying XRT flux in GRB050319 is related to the prompt emission, then neither mechanism resulted in a detectable optical flash in GRB050319. This might be due to various mechanisms that suppress the reverse shock optical flash (e.g. Kobayashi 2000; Zhang & Kobayashi 2005), and because of the strong synchrotron self-absorption effect during the prompt emission phase which suppresses the internal shock optical flash (Fan et al. 2005).
References
- (1) Akerlof, C. et al. 1999 Nature 398, 400.
- (2) Barthelmy, S. et al. 2005 Space Sci Rev (in press).
- (3) Boyd, P. et al. 2005 GCN Circ 3129.
- (4) Burrows, D. et al. 2005 Space Sci Rev (in press).
- (5) Cusumano, G. et al. 2005 ApJL, (submitted).
- (6) Fan, Y. Z., Zhang, B. & Wei, D. M. 2005, ApJL, submitted (astro-ph/0504165).
- (7) Fynbo, J. P. U. et al. 2005 GCN Circ 3136
- (8) Gehrels, N. et al. 2004 Ap.J. 611, 1005.
- (9) Granot, J. & Sari, R. 2002, Ap.J. 568, 820.
- (10) Greco, G. et al. 2005 GCN Circ 3142.
- (11) Kiziloglu, U. et al. 2005 GCN Circ. 3139.
- (12) Kobayashi, S. 2000, ApJ, 545, 807.
- (13) Krimm, H. et al. 2005a GCN Circ. 3117.
- (14) Krimm, H. et al. 2005b GCN Circ. 3119.
- (15) Kumar, P. & Panaitescu, A. 2000, ApJ, 541, L51.
- (16) Madau, P. 1995, ApJ 441, 18
- (17) Mészáros, P. & Rees, M. J. 1997, ApJ, 476, 232.
- (18) Misra, K. et al. 2005 GCN Circ. 3130.
- (19) Quimby, R. M. et al. 2005 GCN Circ. 3135.
- (20) Roming, P. et al. 2005 Space Sci Rev (in press).
- (21) Sari, R. & Piran, T. 1999, ApJ, 515, L109.
- (22) Sharapov, D. et al. 2005a GCN Circ. 3124.
- (23) Sharapov, D. et al. 2005b GCN Circ. 3140.
- (24) Schlegel, D. J., Finkbeiner, D. P. & Davis, M. 1998, ApJ, 500, 525.
- (25) Vestrand, W. T. et al. 2005 Nature (in press).
- (26) Woźniak, P. R., Vestrand, W. T., Wren, J. A., White, R. R., Evans, S. M. & Casperson, D. 2005, ApJL, in press (astro-ph/0505336)
- (27) Yoshioka, T., Chen, C. W., & Nishiura, S. 2005 GCN Circ. 3120.
- (28) Zhang, B. & Kobayashi, S. 2005, ApJ, in press (astro-ph/0404140).
- (29) Zhang, B., Kobayashi, S. & Mészáros, P. 2003, ApJ 595, 950.
- (30) Zhang, B., & Mészáros, P. 2001, ApJ 552, L35.