Mass Profiles and Shapes of Cosmological Structures
Gravitational Lensing & Stellar Dynamics
Abstract
Strong gravitational lensing and stellar dynamics provide two complementary and orthogonal constraints on the density profiles of galaxies. Based on spherically symmetric, scale-free, mass models, it is shown that the combination of both techniques is powerful in breaking the mass-sheet and mass-anisotropy degeneracies. Second, observational results are presented from the Lenses Structure & Dynamics (LSD) Survey and the Sloan Lens ACS (SLACS) Survey collaborations to illustrate this new methodology in constraining the dark and stellar density profiles, and mass structure, of early-type galaxies to redshifts of unity.
1 Introduction
Strong gravitational lensing has matured over the last decades in to a powerful tool in astrophysical and cosmological studies. Whereas research initially focused on cosmology, in particular on the determination of cosmological parameters, and conducting large surveys to find new strong lens systems, emphasis is now shifting toward the use of strong lenses in the study of the mass distribution of galaxies and their environments (see e.g. Kochanek et al. 2004). This became feasible in the 1990s because of the advent of powerful new space and ground-based telescopes for imaging and spectroscopic follow-up of many newly discovered lens systems.
The combination of high-resolution multi-colour optical imaging with spectroscopic redshifts, and sometimes with high-resolution radio-imaging and more recently X-ray observations, of these lens systems, is now providing a very detailed picture of the lens galaxies and allows their mass, some-times mass profile, to be constrained. However the mass-profile degeneracy introduces a limit to the accuracy with which mass-profiles of strong-lens galaxies can be determined.
On way to break this degeneracy is to have independent information on the lens mass distribution, on a scale different from the Einstein radius. One particularly powerful measure of galaxy mass, or its density profiles, is obtained through stellar kinematics. The latter has been particularly productive in the study of the mass distribution in nearby galaxies. However, the high-quality data required to break for example the mass-anisotropy degeneracy has severely limited similar studies of distant galaxies, even with the availability of 8–10 m class telescopes.
The combination of strong gravitational lensing and stellar-kinematic constraints – the focus of this review – provides a way to break the above-mentioned degeneracies in both methods and overcome the additional limit set by the high S/N-ratio required for the stellar-kinematic data. In Section 2, using scale-free spherical models, it is shown how the combination of lensing and dynamics can break existing model degeneracies. In Section 3, the results from two observational programs (LSD and SLACS) are highlighted regarding constraints on the dark and stellar mass structure of early-type galaxies to . In Section 4, a short summary and forward look is given.
2 Spherical Scale-Free Lensing & Stellar-Dynamical Models
Despite the complexity of real galaxies, studying spherically symmetric scale-free galaxies turns out to be enlightening in touching upon the strengths and weaknesses of combining gravitational lensing and stellar-kinematic constraints.
2.1 Combining Lensing Mass and Stellar Velocity Dispersions
Let us suppose the following spherical scale-free model for the lens galaxy:
| (1) |
where is the luminosity density of stars – a trace component – embedded in a total (i.e. luminous plus dark-matter) mass distribution with a density . The anisotropy of the stellar velocity ellipsoid is , constant with radius. For a lens galaxy with a projected mass inside the Einstein radius , the luminosity weighted average line-of-sight velocity dispersion inside an aperture is given, after solving the spherical Jeans equations, by
| (2) |
where
| (3) | |||||
with . Similarly,
| (4) |
In the simple case of a SIS with and , we recover the well-known result
| (5) |
for the Singular Isothermal Sphere mass model. At high redshifts (e.g. ), one can often only hope to measure a luminosity-weighted stellar velocity dispersion of a (lens) galaxy within a give aperture, even when observed with 8-10 m class telescopes. In combination, with the mass measured inside the Einstein radius of a lens galaxy, how does this provide us with information about the galaxy’s density profile? When studying Equation 2, we see two ways is changed: through the exponent () and through a change in the normalisation .
-
•
If =, the normalisation only depends on . For a given , the slope then determines the gradient of the potential inside that radius. Steeper density profiles lead to larger potential gradients and, on-average, larger stellar velocities for a given luminosity profile () and given anisotropy .
-
•
If , the stellar velocity dispersion inside an aperture also depends on through the factor . Hence, roughly speaking, gravitational lensing determines the mass inside and stellar kinematics determining the mass inside . The average density profiles between and is then quantified, with the stellar velocity anisotropy often a secondary effect.
Both physical interpretations are at the basis of determining the average density profile in the inner regions of gravitational-lens galaxies. Real galaxies are obviously more complex, but this toy-model illustrates the basic ideas of combining lensing and dynamics and how it is used to measure the density profiles of (lens) galaxies and break the mass-profile and mass-anisotropy degeneracies.
2.2 How reliable can the density profile be measured?
To answer this question, we take the derivative of Equation 2 with respect to and , assuming can be determined to good accuracy and is known or assumed. In that case, one finds
| (6) |
with
where indicate the fractional errors on the respective quantities. Because in general , one finds the simple rule of thumb that the error for close-to-isothermal mass models (typically one finds ). We thus conclude that the fractional error on the determine density slope is of the same order as the measurement error on . This simple rule-of-thumb is confirmed for more complex models as well (e.g. Koopmans et al. 2005) and typically for reasonable (spectroscopy) integration times of 4 hrs on 8–10 m class telescopes for lens galaxies out to .
3 Observational Programs
Two observational programs to combine gravitational lensing and stellar kinematic constraints are described, that are currently underway: (i) The Lenses Structure and Dynamics (LSD) Survey and (ii) the Sloan Lens ACS (SLACS) Survey. I will mainly focus on their results regarding the determination of galaxy density profiles and their mass structure.
3.1 The Lenses Structure & Dynamics Survey – LSD
The Lenses Structure and Dynamics (LSD) Survey was started to combine stellar-kinematic constraints with those from gravitational lensing (e.g. Koopmans & Treu 2003; Treu & Koopmans 2004), to extend E/S0 studies beyond the local Universe.
Analysis of the five pressure supported E/S0 galaxies in our sample at was presented in Treu & Koopmans (2004), with the following results: (1) Extended dark-matter halos is detected in all five E/S0 galaxies at CL and dark matter contributes 40–70% (15–65%) of the total mass within the Einstein (effective) radius. (2) The inner power-law slope of the total mass distribution is (with ), close to isothermal. Including two more similarly analysed systems (PG1115+080 and B1608+656) gives with 0.3 rms scatter, indicating that dark and luminous mass already ‘conspire’ at to produce a close-to-flat rotation curve, while preserving their spatial segregation, similar to what is found in disk-dominated galaxies. (3) The inner power-law slope of the dark-matter mass distribution is (68% CL), consistent with numerical simulations for isotropic models with little adiabatic contraction at low redshifts. Although these results show that good-quality stellar kinematics of E/S0 lens galaxies provide powerful constraints on the inner structure of individual E/S0 galaxies out to , the study of trends or evolution is clearly limited by the small sample size.
3.2 The Sloan Lens ACS Survey – SLACS
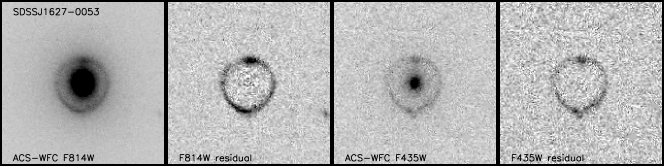
To increase the number of E/S0 galaxies suitable for lensing and stellar dynamical studies, the Sloan Lens ACS (SLACS) Survey was initiated (e.g. Bolton et al. 2005a&b; Treu et al. 2005; Koopmans et al. 2005). E/S0 lens candidates were initially selected from the SDSS Luminous Red Galaxy (LRG) sample, based on the presence of multiple emission lines at a redshift larger than that of the E/S0 galaxy (Bolton et al. 2004). The 49 candidates were ranked based on their lensing probability and 39/49 were successfully targeted in a cycle–13 HST snapshot survey through filters F435W and F814W. The survey is continuing in cycle-14. Thus far a total of 25 new lens systems have been discovered (e.g. Fig.1), making it the largest sample of lens systems from a single well-defined survey.
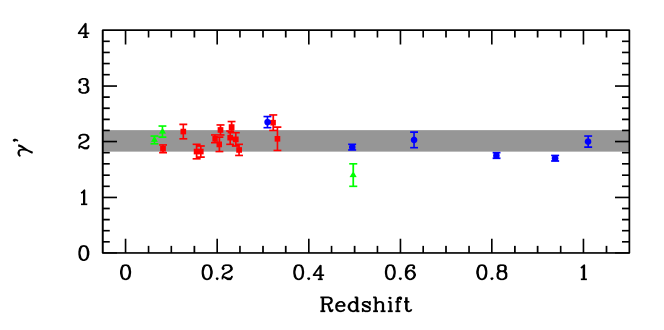
The main results, thus far, presented in Bolton et al. (2005a&b), Treu et al. (2005) and Koopmans et al. (2005) are: (1) The SLACS E/S0 lens galaxy sample appears in all respects (e.g. colours, FP) to be a random sub-sample of the LRG sample, only skewed toward the brighter (i.e. more massive) and higher surface brightness systems, because of the lensing and lensing-cross-section selection effects. The SLACS sample should therefore represents the general population of massive E/S0 galaxies. (2) The ratio between the central stellar velocity dispersion () and the velocity dispersion that best fits the lensing models () is with 0.065 rms scatter. (3) The average logarithmic density slope for the total mass density of (68% C.L.) inside kpc. The inferred intrinsic rms spread in logarithmic density slopes is . (4) The average position-angle difference between the light distribution and the total mass distribution is found to be degrees (rms of 10 degrees), setting an upper limit of on the average external shear. The total mass has an average ellipticity =0.780.03 (rms of 0.12), which correlates extremely well with the stellar ellipticity, , resulting in (rms of 0.11) for km s-1. Assuming an oblate mass distribution and random orientations, the distribution of ellipticities implies with an error of 0.2. (5) The average projected dark-matter mass fraction is (rms of 0.22) inside , using the stellar mass-to-light ratios derived from the Fundamental Plane as priors. (6) Combined with results from the Lenses Structure & Dynamics (LSD) Survey at , we find no significant evolution of the total density slope inside one effective radius for galaxies with km s-1 (Fig.2): a linear fit gives (1 ) for the range =0.08–1.01 .
4 Conclusions
The joint gravitational-lensing and stellar-kinematic analysis of E/S0 galaxies is a new, powerful, method that allows their density profiles and mass structure (among other things) to be studied beyond the local Universe. Two observational programs, the LSD and SLACS Surveys, have shown very promising first results, quantifying the structure and evolution of galaxies for the first time out to . This ultimately allows us to directly compare with and test the hierarchical galaxy-formation scenario in the CDM paradigm, based not on light but on mass.
References
- [Bolton et al.(2004)] Bolton, A.S., Burles, S., Schlegel, D.J., Eisenstein, D.J., Brinkmann, J. 2004, AJ, 127, 1860
- [Bolton et al.(2005)] Bolton, A.S., Burles, S., Koopmans, L.V.E., Treu, T., Moustakas, L.A. 2005a, ApJL, 624, L21
- [] Bolton, A.S., Burles, S., Koopmans, L.V.E., Treu, T., Moustakas L.A. 2005b, ApJ, accepted
- [] Kochanek, C.S., Schneider, P., Wambsganss, J., 2004, Part 2 of Gravitational Lensing: Strong, Weak & Micro, Proceedings of the 33rd Saas-Fee Advanced Course, G. Meylan, P. Jetzer & P. North, eds. (Springer-Verlag: Berlin)
- [Koopmans & Treu(2003)] Koopmans, L.V.E., Treu, T. 2003, ApJ, 583, 606
- [] Koopmans, L.V.E., Treu, T., Bolton, A.S., Burles, S.C., Moustakas L.A. 2005, ApJ, submitted
- [Treu & Koopmans(2004)] Treu, T., Koopmans, L.V.E. 2004, ApJ, 611, 739
- [] Treu, T., Koopmans, L.V.E., Bolton, A.S., Burles, S.C., Moustakas L.A. 2005, ApJ, submitted