Stellar Populations of Elliptical Galaxies in Virgo Cluster I.
The Data and Stellar Population Analysis
Abstract
We have determined spectroscopic ages of elliptical galaxies in the Virgo cluster using spectra of very high signal-to-noise ratio (S/N Å100). We observed 8 galaxies with the Subaru Telescope and have combined this sample with 6 galaxies previously observed with the WHT. To determine their ages we have used a new method based on the H age indicator, which is virtually independent of the effects of metallicity. Apart from ages we have estimated abundances of various elements. In this paper we present the observations, the data reduction and the reliability of the H method. The results of this investigation are presented in a companion paper (Yamada et al. 2006).
1 Introduction
An important issue in current-day astronomy is whether the stellar populations in elliptical galaxies are uniformly old or a complex mixture of various populations of different ages. One of the classical formation scenarios, the monolithic collapse scenario (Eggen, Lynden-Bell & Sandage 1962) suggests that all elliptical galaxies consist of uniformly old stars : i.e., they formed at high redshift (2) and evolved passively. The fundamental plane (Djorgovski & Davis 1987; Dressler et al. 1987; Bender, Burstein & Faber 1993) and the Mg relation (Bender et al. 1993; Ziegler & Bender 1997; Colless et al. 1999) show indications towards this possibility. On the other hand, the hierarchical clustering scenario predicts that elliptical galaxies were formed as a result of merging of galaxies accompanied by intensive starbursts (e.g. Toomre & Toomre 1972; Kauffman & Charlot 1998). Results based on spectroscopic line strength analysis by several authors (e.g. González 1993; Trager et al. 2000b) seem to support this scenario, since a significant scatter in ages is found. Recent results from the SLOAN survey (Kauffmann et al. 2003) seem to indicate that large ellipticals are old and small ellipticals are younger. Although measuring accurate ages and metallicities would lead to a breakthrough in our understanding of the formation of elliptical galaxies, this has been considerably difficult due to the age-metallicity degeneracy (Worthey 1994; Arimoto 1996). Photometric and spectroscopic properties such as colors, absorption line indices, change almost in the same way to differences in age and metallicity of the stellar populations, so that it is difficult to determine unambiguous ages.
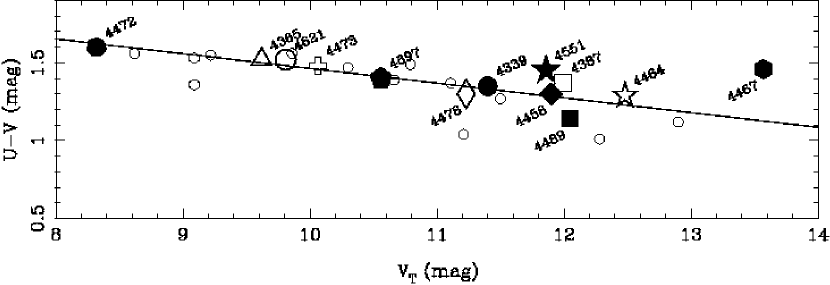
In understanding the formation of elliptical galaxies in clusters, the color-magnitude relation (CMR) plays a fundamental role. The CMR is an important tool, since in clusters it is tight and as a result provides a relation that can be used to tie together ages, metallicities and masses of galaxies. The scatter in the CMR is known to be small ( 0.05 mag in the relation between and (see Bower, Lucey & Ellis 1992a,b; Terlevich et al. 2001 for low redshift galaxies), and is also established in clusters at high redshift (Stanford, Eisenhardt & Dickinson 1998; Blakeslee et al. 2003), supporting the monolithic collapse scenario. The origin of the CMR has been explored extensively. A model based on the monolithic collapse scenario with a galactic wind has been able to explain the CMR as a sequence of metallicity (Arimoto & Yoshii 1987; Kodama & Arimoto 1997). This is not the only way to explain the CMR: models based on hierarchical clustering (Kauffmann & Charlot 1998; Ferreras, Charlot & Silk 1999; Terlevich et al. 1999; Ferreras & Silk 2000) producing a combination of age and metallicity variations could also explain the CMR. This controversial situation is almost due to the age-metallicity degeneracy. In short, the origin of the CMR is still under debate.
Spectroscopic properties, such as absorption line strengths, can partially break the age-metallicity degeneracy. Worthey (1994) showed that the H index, defined in Burstein et al. (1984), is sensitive to the luminosity-weighted age of galaxies and less to their metallicity. If a galaxy contains ionized gas, however, its emission makes the H absorption line weaker, and therefore an uncertain correction is necessary. To partially get around this one can use H and H indices, such as H, H, H and H (defined in Jones & Worthey 1995 and Worthey & Ottaviani 1997), which are less affected by emission than H. These aforementioned indices are some of the Lick/IDS indices (Burstein et al. 1984, Worthey et al. 1994), which are measuring line strengths of several absorption lines at low resolution. Although maybe less than colors, these indices are still affected by the age-metallicity degeneracy.
Partially to overcome the problem of low resolution Rose (1984) investigated spectra of elliptical galaxies using higher resolution indices (2 Å). His indices, such as H/Fe I and H/4325, are defined as ratios of neighboring absorption lines. Jones & Worthey (1995) defined a new Hγ index, H that would be more sensitive to age. That index, however, is strongly affected by velocity dispersion () broadening of galaxy spectra, since the bandpasses of feature and pseudocontinua are very narrow, and therefore age determination using this index are difficult and has uncertainty. Later, Vazdekis & Arimoto (1999) introduced a new age indicator, H, which is very successful at breaking the age-metallicity degeneracy and usable for a wide range of . While the presence of non-solar abundance ratio in most early-type galaxies (e.g., González 1993; Kuntschner 2000; Poggianti et al. 2001, etc.) introduces systematic errors in the derived ages if Lick indices are used, errors from H are less affected by non-solar abundance; i.e. errors mainly come from Poissonian noise.
Vazdekis et al. (2001a) applied H to 6 elliptical galaxies in the Virgo cluster and demonstrated that it is a useful age-determinator for elliptical galaxies. The derived ages are uniformly old (10Gyr), except for one galaxy (NGC 4478) which has bluer color, and the total metallicities and [Mg/Fe] ratios are increasing with luminosity, color and velocity dispersion. They concluded that the CMR is driven mainly by the mean stellar metallicity. Although this is an important result, it needs to be strengthened, since the number of galaxies in Vazdekis et al. (2001a) is small, and the luminosity spans only 3.3 magnitudes.
In this paper we present new data of 8 elliptical galaxies in the Virgo cluster observed with the Subaru Telescope together with the 6 galaxies of Vazdekis et al. (2001a). For the combined sample of 14 galaxies we present the analysis of the line strengths and determine their ages in various ways. We describe the details of our sample selection and observations in Section 2. In Section 3, we describe the line index measurements and stellar population analysis based on the simple stellar population (SSP) models of Vazdekis (1999). In Section 4, we present the measurement of ages and metallicities of our sample, and discuss the advantage of using H index and compare our results with previous studies. In Section 5 the conclusions are given. In a future paper (Yamada et al. 2006) we discuss age and metallicity trends along the CMR and other scaling relations.
2 Observations and Sample Selection
In this paper we present data taken with the Subaru and the William Herschel Telescope. Vazdekis et al. (2001a) presented the first results of the WHT long slit observations. We re-reduced the WHT data to check the dependence of data reduction technique on the index measurements and added 8 new galaxies observed with the Subaru Telescope.
2.1 Subaru Observation
The Subaru observations were done on April 17-18, 2002 and June 26, 2003. The spectroscopic observations were performed with the long slit mode of the FOCAS spectrograph with the MIT CCD and the R300 grism in the 2nd order (Kashikawa et al. 2002). This instrumental setup provides a dispersion of 0.67 Åpixel-1 and a spectral range of 3800Å–5800Å. We used a slit width of 0.4, giving a resolution of 2.0 Å ( km s-1) on April 17, 2002 and a slit width of 0.6, corresponding to a resolution of 3.1 Å ( km s-1) on April 18, 2002 and June 26, 2003. The spatial scale was 0.21 pix-1 after binning 2 pixels and the seeing was 0.6–1.0 for all nights. Multiple exposures of 20 minutes length were acquired for each galaxy, as well as ThAr arc lamp exposures for wavelength calibration at every galaxy pointing. We obtained a number of dome and twilight flat fields for flatfielding. We also observed one spectrophotomeric standard star per run, Feige 34 in 2002 April and BD+33 2642 in 2003 June.
2.2 WHT Observation
The WHT observations were done in April 21-22, 1999. We used the ISIS double-beam spectrograph with the EEV12 CCD and R600B grating in the blue channel. The dispersion and spectral resolution is 0.44 Åpixel-1 and 2.4 Å ( km s-1) provided by a slit width of 1.6 and a spectral range of 4000–5500Å. The seeing was 2–3 during the first night and 1.5 during the second. Multiple exporsures of 35 minutes length were obtained for each galaxy. We made use of tungsten flat fields obtained at each galaxy pointing and twilight flat fields as well as CuArNe arc lamp frames for calibration for each exposure. For correction to a relative flux scale the spectrophotometric standard star G191B29 was used.
2.3 Data Reduction
Data reduction was done with the standard IRAF packages in the standard way; i.e. overscan correction, bias subtraction, flat fielding, calibration, sky subtraction and flux calibration. We used dome flat fields (for the Subaru data) and tungsten lamp flat fields (for the WHT data) for correction for pixel-to-pixel variations of the sensitivity. The spectra of WHT have wiggles coming from problems with the dichroic. We successfully removed these patterns by using tungsten lamp flat fields obtained for each galaxy pointing. We achieved (error in ) smaller than 0.07Å for the calibration, which is very important for the determination of H, since even a small shift in can affect the H measurement significantly (Vazdekis & Arimoto 1999). Cosmic rays were removed using the ”cleanest” task of the REDUCEME package (Cardiel et al. 1998). Exposures whose spectra around H feature were hit by cosmic ray were excluded. Flux calibration was done with the observed flux standard stars G191B29 (for the WHT data), Feige 34 and BD+33 2642 (for the Subaru data).
In this study, since we are interested in the central part of galaxies, we have summed up the spectra within /10. Most of elliptical galaxies are known to have color and line strength gradients (e.g., Peletier et al. 1990, González 1993; Kobayashi & Arimoto 1999). Here we used effective radii from the RC3 catalogue (de Vaucouleurs et al. 1991). Before summing the central galaxy spectra, we carefully aligned them with the rows of the array, and each row in spatial direction was corrected for the velocity shift due to the rotation by cross-correlating with the Vazdekis (1999) models. Variations of within were small ( 25 km s-1) for all galaxies, and therefore no correction for this effect was applied.
To check for systematic effects due to telescope characteristics and data reduction, we compared the line indices for NGC 5831, a galaxy observed during both Subaru and WHT runs. We found excellent agreement between these indices measurements (see the open triangle (WHT) and open diamond (Subaru) in the middle panel of Fig. 2). Moreover, WHT data reduced independently by two authors (Y.Yamada. and A.Vazdekis) show also good agreement.
2.4 Sample Selection
Table 1 lists the basic parameters of the observed galaxies, such as radial velocity (Vr), effective radius (), velocity dispersion (), visual magnitude (), and colors, telescope, exposure time, slit width, and signal-to-noise ratio per Angstrom around 4340Å.
Our sample was primarily based on the Virgo galaxies observed by Michard (1982) and Bower et al. (1992a,b), which show the CMRs with surprisingly small scatter. We included 3 elliptical galaxies from Jones (1998) in order to enlarge our luminosity coverage toward the fainter end. In Fig. 1 we reproduce the CMR of our sample galaxies. We selected the galaxies according to the following criteria: 1) Since we were only interested in elliptical galaxies, we excluded galaxies classified as S0 in the references mentioned above and the RC3 catalogue (de Vaucouleurs et al. 1991). 2) We excluded galaxies having strong emission lines, such as NGC 4374 and NGC 4486. 3) We selected galaxies evenly for each luminosity bin , , , and , to cover a wide range of the luminosity. The luminosity spans 5.8 magnitudes, which is larger than the data of Vazdekis et al. (2001a), which spans only 3.3 magnitudes.
| NGC | Vr | Obs. | Exp.Time | Slit | S/N | |||||
|---|---|---|---|---|---|---|---|---|---|---|
| km s-1 | arcsec | km s-1 | mag | mag | mag | min. | Å-1 | |||
| (1) | (2) | (3) | (4) | (5) | (6) | (7) | (8) | (9) | (10) | |
| NGC4239 | 921 | 15 | 63 | 12.81 | - | 0.89 | S1 | 100 | 0.4 | 115 |
| NGC4339 | 1281 | 32 | 114 | 11.73 | 1.35 | 0.92 | S2 | 50 | 0.6 | 150 |
| NGC4365 | 1227 | 80 | 261 | 9.67 | 1.52 | 0.99 | W | 70 | 1.6 | 250 |
| NGC4387 | 561 | 16 | 112 | 12.29 | 1.37 | 0.91 | W | 105 | 1.6 | 130 |
| NGC4458 | 668 | 28 | 106 | 12.33 | 1.30 | 0.88 | S1 | 70 | 0.4 | 145 |
| NGC4464 | 1255 | 3 | 121 | 12.93 | 1.29 | 0.86 | W | 105 | 1.6 | 160 |
| NGC4467 | 1426 | 6 | 83 | 14.33 | 1.46a | 0.86 | S3 | 150 | 0.6 | 115 |
| NGC4472 | 983 | 107 | 303 | 8.55 | 1.60 | 0.98 | S1 | 20 | 0.4 | 170 |
| NGC4473 | 2237 | 42 | 193 | 10.33 | 1.48 | 1.02 | W | 70 | 1.6 | 280 |
| NGC4478 | 1382 | 13 | 143 | 11.46 | 1.32b | 0.93 | W | 105 | 1.6 | 135 |
| NGC4489 | 957 | 28 | 62 | 12.38 | 1.21a | 0.89 | S2 | 40 | 0.6 | 120 |
| NGC4551 | 1189 | 18 | 113 | 12.14 | 1.45 | 0.92 | S2 | 80 | 0.6 | 160 |
| NGC4621 | 430 | 44 | 230 | 9.81 | 1.52 | 0.96 | W | 140 | 1.6 | 490 |
| NGC4697 | 1236 | 72 | 181 | 10.56 | 1.40 | 0.89 | S1 | 30 | 0.4 | 255 |
(1): RC3, de Vaucouleurs et al. (1991); (2)(4)(6): RC3 ; (3): McElroy (1995); (5): Bower et al. (1992a), aRC3 catalogue, bMichard (1982), (7): S1, S2, S3 and W means observation with Subaru (1st, 2nd, 3rd night) and WHT, respectively; (8)(9): Exposure time and slit width used; (10): S/N Å-1 at 4340Å, the wavelength of H
2.5 Line Indices
We used the H index (Vazdekis & Arimoto 1999; Vazdekis et al. 2001b) and the indices of the Lick system (Worthey 1994; Jones & Worthey 1995; Worthey & Ottaviani 1997). For measuring the indices we used the FORTRAN program called “LECTOR” 111See http:///www.iac.es/galeria/vazdekis/models.html, which is based on the equations (41)–(44) and simulations in Cardiel et al. (1998).
| Name | Blue Continuum | Index Bandpass | Red Continuum | Units | b | Required |
|---|---|---|---|---|---|---|
| – | – | – | km s-1 | S/N Å-1 a | ||
| H | 4329.000–4340.468 | 4333.250–4363.000 | 4352.500–4368.250 | Å | 60–130 | 200 |
| H | 4330.000–4340.468 | 4333.000–4352.737 | 4359.250–4368.750 | Å | 100–175 | 200 |
| H | 4331.000–4340.750 | 4332.000–4352.250 | 4359.250–4368.750 | Å | 150–225 | 300 |
| H | 4331.500–4341.000 | 4331.500–4351.875 | 4359.250–4368.750 | Å | 225–300 | 400 |
a Required S/N Å-1 to distinguish between 12 Gyrs and 17.5 Gyrs
stellar population (Vazdekis & Arimoto 1999).
b Each H index can be applied in this
() range.
We list the wavelength definition of 4 H indices in Table 2. Since the required S/N Å-1 to distinguish between models of 12 Gyrs and 17.5 Gyrs is very high (S/N Å-1 = 200 for H and S/N Å-1 = 400 for H), we integrated for a considerable time and consequently reached sound-to-noise ratios Å-1 ranging from 115 to 490 for the selected apertures, i.e., . Although the S/N Å-1 of our data is slightly lower than listed in Table 2 in most galaxies, we could achieve a high precision in the age determination for the following reasons: 1) According to Cardiel et al. (2003), the real random errors of H are smaller than those computed by the LECTOR program since the wavelength definitions of H are not usual, i.e., the pseudo-continua and the feature bandpasswd overlap. We used the real error by using their new estimate of the random errors for H. 2) The H index decreases rapidly for young ages, just as other Balmer lines do. Although the S/N Å-1 for NGC4489 is low ( 115), the error in age is only 0.6 Gyrs.
The spectral range of our data goes from 3800Å to 5800Å to cover many of the Lick indices: H and H (Jones & Worthey 1995), H and H (Worthey & Ottaviani 1997), H, CN1, CN2, Ca4227, G4300, Fe4383, Ca4455, Fe4531, C4668, Fe5015, Mg1, Mg2, Mg, Fe5270, Fe5335, Fe5406, Fe5709 and NaD (Worthey et al. 1994). Worthey (1994), Jones & Worthey (1995) and Worthey & Ottaviani (1997) have investigated the age and metallicity sensitivity of these indices. They concluded that Balmer line indices are sensitive to age more than metallicity. Besides H we used H and H as age indicators for reference. Concerning the metallicity, we used [MgFe] (defined in González 1993) to estimate the mean metallicity [M/H],
The feasibility of using [MgFe] for the total metallicity is shown in Vazdekis et al. (2001a), Thomas, Maraston & Bender (2003), and Bruzual & Charlot (2003). Apart from this, we used several indices to determine abundances of several elements and molecules. For Fe we use the Fe3 index defined in Kuntschner (2000),
to give an Fe abundance estimate [ZFe/H]. Mg, Ca4227, CN2 and G4300 are used to determine [ZMg/H], [ZCa/H], [ZCN/H] and [ZCH/H], respectively. Tripicco & Bell (1995) and Trager et al. (1998) confirmed the dominant element or molecule in each line index. But each index is not pure, because the indices are still somewhat contaminated by other elements or molecules. For the G-band, Worthey (1994) and Tripicco & Bell (1995) show us that the contributers to the G-band are CH, Fe and Ti. Yet, since the main contributer is still CH (C), we write [ZCH/H] for convenience.
Note that, although the bandpasses are mostly those of the Lick system, we did not use the Lick/IDS system itself, instead we used flux-calibrated spectra and no offsets were applied to reproduce the stars of the Lick/IDS system. Measured line strength of the indices are listed in Table 3 & 4.
| Galaxy | a | b | Hc | Hd | Hd | Hd | H | H | H | H | CN1 | CN2 | Ca4227 | G4300 | Fe4383 |
|---|---|---|---|---|---|---|---|---|---|---|---|---|---|---|---|
| Error | km s-1 | (Å) | (Å) | (Å) | (Å) | (Å) | (Å) | (Å) | (Å) | (mag) | (mag) | (Å) | (Å) | (Å) | |
| NGC4239 | 82 | 150 | 1.213 | 0.996 | - | - | -0.959 | -4.044 | 0.909 | -0.517 | 0.008 | 0.046 | 1.632 | 5.130 | 4.829 |
| 0.067 | 0.040 | - | - | 0.103 | 0.082 | 0.069 | 0.051 | 0.003 | 0.003 | 0.044 | 0.074 | 0.100 | |||
| NGC4339 | 142 | 150 | - | 0.836 | - | - | -2.602 | -6.154 | 0.323 | -1.851 | 0.091 | 0.138 | 1.717 | 5.476 | 5.848 |
| - | 0.030 | - | - | 0.087 | 0.064 | 0.057 | 0.041 | 0.002 | 0.002 | 0.034 | 0.056 | 0.072 | |||
| NGC4365 | 245 | 300 | - | - | - | 0.252 | -2.820 | -7.875 | -0.292 | -2.681 | 0.121 | 0.163 | 1.740 | 5.815 | 5.516 |
| - | - | - | 0.017 | 0.039 | 0.042 | 0.026 | 0.026 | 0.001 | 0.001 | 0.019 | 0.033 | 0.049 | |||
| NGC4387 | 105 | 150 | 0.961 | 0.827 | - | - | -2.666 | -6.360 | 0.253 | -1.909 | 0.048 | 0.093 | 1.763 | 6.067 | 5.949 |
| 0.061 | 0.036 | - | - | 0.074 | 0.078 | 0.048 | 0.049 | 0.002 | 0.002 | 0.035 | 0.062 | 0.092 | |||
| NGC4458 | 104 | 150 | 0.919 | 0.823 | - | - | -2.109 | -5.352 | 0.472 | -1.441 | 0.074 | 0.121 | 1.519 | 5.573 | 4.830 |
| 0.051 | 0.030 | - | - | 0.083 | 0.063 | 0.055 | 0.040 | 0.002 | 0.002 | 0.034 | 0.056 | 0.075 | |||
| NGC4464 | 135 | 150 | - | 0.778 | - | - | -2.781 | -6.240 | 0.107 | -1.828 | 0.106 | 0.156 | 1.285 | 5.886 | 5.422 |
| - | 0.028 | - | - | 0.059 | 0.061 | 0.038 | 0.038 | 0.002 | 0.002 | 0.028 | 0.049 | 0.074 | |||
| NGC4467 | 75 | 150 | 0.999 | 0.830 | - | - | -1.792 | -5.257 | 0.425 | -1.429 | 0.110 | 0.151 | 1.586 | 5.389 | 5.273 |
| 0.055 | 0.033 | - | - | 0.082 | 0.069 | 0.054 | 0.043 | 0.002 | 0.002 | 0.036 | 0.059 | 0.082 | |||
| NGC4472 | 306 | 300 | - | - | - | 0.303 | -2.937 | -6.762 | -0.167 | -1.959 | 0.131 | 0.177 | 1.578 | 5.341 | 5.330 |
| - | - | - | 0.026 | 0.092 | 0.065 | 0.061 | 0.041 | 0.002 | 0.002 | 0.035 | 0.057 | 0.073 | |||
| NGC4473 | 180 | 190 | - | - | 0.498 | - | -3.529 | -6.993 | -0.086 | -2.303 | 0.138 | 0.190 | 1.586 | 5.908 | 5.945 |
| - | - | 0.015 | - | 0.035 | 0.036 | 0.022 | 0.022 | 0.001 | 0.001 | 0.016 | 0.028 | 0.042 | |||
| NGC4478 | 132 | 150 | - | 0.889 | - | - | -2.078 | -5.786 | 0.512 | -1.559 | 0.077 | 0.123 | 1.668 | 5.564 | 5.874 |
| - | 0.034 | - | - | 0.071 | 0.072 | 0.047 | 0.045 | 0.002 | 0.002 | 0.033 | 0.060 | 0.086 | |||
| NGC4489 | 73 | 150 | 1.275 | 1.093 | - | - | -1.384 | -4.264 | 0.800 | -0.631 | 0.024 | 0.069 | 1.695 | 5.294 | 5.523 |
| 0.072 | 0.043 | - | - | 0.124 | 0.089 | 0.083 | 0.056 | 0.003 | 0.003 | 0.050 | 0.082 | 0.105 | |||
| NGC4551 | 105 | 150 | - | 0.928 | - | - | -2.871 | -6.162 | 0.271 | -1.729 | 0.084 | 0.129 | 1.901 | 5.645 | 6.176 |
| - | 0.027 | - | - | 0.075 | 0.058 | 0.049 | 0.036 | 0.002 | 0.002 | 0.030 | 0.050 | 0.065 | |||
| NGC4621 | 230 | 300 | - | - | - | 0.299 | -3.100 | -7.021 | -0.064 | -2.202 | 0.154 | 0.202 | 1.438 | 5.649 | 5.499 |
| - | - | - | 0.008 | 0.020 | 0.020 | 0.013 | 0.013 | 0.001 | 0.001 | 0.009 | 0.016 | 0.024 | |||
| NGC4697 | 168 | 190 | - | - | 0.493 | - | -3.028 | -6.311 | 0.029 | -1.943 | 0.116 | 0.159 | 1.701 | 5.598 | 5.672 |
| - | - | 0.016 | - | 0.048 | 0.036 | 0.031 | 0.023 | 0.001 | 0.001 | 0.019 | 0.031 | 0.041 | |||
| Galaxy | Ca4455 | Fe4531 | C4668 | H | Fe5015 | Mg1 | Mg2 | Mg | Fe5270 | Fe5335 | Fe5406 | Fe5709 | Fe5782 | NaD |
|---|---|---|---|---|---|---|---|---|---|---|---|---|---|---|
| Error | (Å) | (Å) | (Å) | (Å) | (Å) | (mag) | (mag) | (Å) | (Å) | (Å) | (Å) | (Å) | (Å) | (Å) |
| NGC4239 | 1.612 | 3.456 | 4.839 | 2.204 | 5.497 | 0.031 | 0.150 | 3.135 | 2.856 | 2.641 | 1.746 | 1.029 | 0.819 | 1.793 |
| 0.050 | 0.073 | 0.109 | 0.043 | 0.096 | 0.001 | 0.001 | 0.048 | 0.054 | 0.063 | 0.047 | 0.042 | 0.042 | 0.061 | |
| NGC4339 | 1.818 | 6.097 | 0.098 | 0.251 | 4.495 | 3.200 | 3.065 | 2.090 | 1.064 | 1.015 | 4.229 | 1.785 | 3.584 | 7.859 |
| 0.036 | 0.052 | 0.075 | 0.031 | 0.067 | 0.001 | 0.001 | 0.033 | 0.037 | 0.042 | 0.032 | 0.028 | 0.028 | 0.040 | |
| NGC4365 | 1.544 | 4.090 | 8.207 | 1.467 | 5.670 | 0.137 | 0.301 | 4.810 | 2.886 | 2.552 | 1.754 | - | - | - |
| 0.026 | 0.039 | 0.060 | 0.025 | 0.057 | 0.001 | 0.001 | 0.027 | 0.031 | 0.035 | 0.026 | - | - | - | |
| NGC4387 | 1.703 | 3.632 | 5.927 | 1.662 | 5.897 | 0.096 | 0.234 | 4.200 | 3.141 | 2.964 | 2.004 | - | - | - |
| 0.049 | 0.074 | 0.116 | 0.048 | 0.105 | 0.001 | 0.001 | 0.051 | 0.057 | 0.065 | 0.049 | - | - | - | |
| NGC4458 | 1.678 | 5.080 | 0.068 | 0.206 | 4.241 | 2.799 | 2.607 | 1.671 | 0.966 | 0.897 | 2.686 | 1.513 | 3.392 | 5.040 |
| 0.037 | 0.054 | 0.080 | 0.032 | 0.070 | 0.001 | 0.001 | 0.034 | 0.039 | 0.045 | 0.034 | 0.030 | 0.029 | 0.042 | |
| NGC4464 | 1.609 | 3.458 | 5.103 | 1.599 | 5.332 | 0.104 | 0.248 | 4.425 | 2.829 | 2.506 | 1.745 | - | - | - |
| 0.039 | 0.059 | 0.093 | 0.038 | 0.084 | 0.001 | 0.001 | 0.040 | 0.046 | 0.053 | 0.039 | - | - | - | |
| NGC4467 | 1.733 | 5.620 | 0.099 | 0.243 | 4.234 | 3.121 | 2.897 | 2.022 | 1.026 | 0.918 | 3.233 | 1.712 | 3.482 | 5.909 |
| 0.042 | 0.062 | 0.092 | 0.037 | 0.082 | 0.001 | 0.001 | 0.040 | 0.045 | 0.052 | 0.039 | 0.034 | 0.034 | 0.048 | |
| NGC4472 | 1.580 | 5.246 | 0.124 | 0.289 | 4.545 | 2.749 | 2.375 | 1.607 | 0.827 | 0.812 | 4.854 | 1.317 | 3.474 | 8.169 |
| 0.036 | 0.052 | 0.074 | 0.030 | 0.067 | 0.001 | 0.001 | 0.034 | 0.037 | 0.042 | 0.032 | 0.029 | 0.028 | 0.040 | |
| NGC4473 | 1.727 | 3.650 | 8.711 | 1.632 | 5.906 | 0.136 | 0.294 | 4.884 | 3.182 | 2.886 | 1.986 | - | - | - |
| 0.022 | 0.034 | 0.052 | 0.022 | 0.049 | 0.001 | 0.001 | 0.024 | 0.026 | 0.030 | 0.023 | - | - | - | |
| NGC4478 | 1.856 | 3.733 | 6.568 | 1.919 | 6.220 | 0.104 | 0.253 | 4.435 | 3.244 | 3.117 | 2.075 | - | - | - |
| 0.045 | 0.068 | 0.106 | 0.043 | 0.095 | 0.001 | 0.001 | 0.046 | 0.051 | 0.058 | 0.043 | - | - | - | |
| NGC4489 | 2.413 | 6.171 | 0.046 | 0.173 | 3.456 | 3.305 | 3.068 | 1.973 | 1.141 | 1.006 | 2.656 | 1.678 | 3.626 | 6.345 |
| 0.051 | 0.074 | 0.108 | 0.042 | 0.093 | 0.001 | 0.001 | 0.047 | 0.052 | 0.060 | 0.046 | 0.041 | 0.040 | 0.059 | |
| NGC4551 | 1.896 | 6.203 | 0.091 | 0.245 | 4.527 | 3.371 | 3.260 | 2.177 | 1.156 | 1.055 | 3.468 | 1.809 | 3.719 | 7.538 |
| 0.033 | 0.048 | 0.071 | 0.029 | 0.063 | 0.001 | 0.001 | 0.031 | 0.035 | 0.040 | 0.030 | 0.026 | 0.026 | 0.038 | |
| NGC4621 | 1.447 | 3.593 | 8.958 | 1.480 | 5.560 | 0.165 | 0.325 | 4.909 | 2.943 | 2.645 | 1.783 | - | - | - |
| 0.013 | 0.019 | 0.029 | 0.012 | 0.028 | 0.000 | 0.000 | 0.013 | 0.015 | 0.017 | 0.013 | - | - | - | |
| NGC4697 | 1.603 | 5.869 | 0.108 | 0.261 | 4.591 | 3.224 | 3.003 | 2.037 | 1.019 | 0.999 | 4.220 | 1.643 | 3.709 | 8.194 |
| 0.020 | 0.030 | 0.043 | 0.018 | 0.039 | 0.000 | 0.000 | 0.019 | 0.021 | 0.025 | 0.019 | 0.016 | 0.016 | 0.023 |
2.6 Stellar Population Models
To derive the ages and metallicities of the galaxies, we used the revised evolutionary stellar population synthesis model of Vazdekis (1999), which has been made using the empirical stellar spectral library of Jones (1998) and updated with the new Padova isochrones (Girardi et al. 2000). The model predicts spectral energy distributions (SEDs) in the optical wavelength range, 3976Å–4456Å and 4764Å–5460Å, for simple stellar populations (SSPs) at a resolution of 1.8Å (FWHM). Previous models (e.g., Worthey 1994; Vazdekis et al. 1996) mostly used the Lick polynomial fitting functions for absorption line indices (Worthey et al. 1994; Worthey & Ottaviani 1997) which are based on low resolution spectra (FWHM 9Å), thus limiting the application of the models to strong features. The new model provides flux-calibrated, high-resolution spectra, therefore allowing an analysis of galaxy spectra at the natural resolution given by their internal velocity broadening and instrumental resolution. Thus no uncertain correction for velocity broadening has to be applied as is the case when using the Lick/IDS system.
3 Age and Metallicity of Elliptical Galaxies
Traditionally, a combination of metallic indices and Balmer line indices has been used to measure the ages of the central regions of observed galaxies (e.g. González 1993; Worthey & Ottaviani 1997). Here we use a number of different age indicators: H, H, H as defined by Vazdekis & Arimoto (1999), Worthey et al. (1994), and Worthey & Ottaviani (1997), respectively. For simplicity, we have divided our sample into three groups containing galaxy spectra with similar velocity dispersions and smoothed the model SEDs of Vazdekis (1999) to match the obtained total velocity dispersion. We chose (1) km s-1, (2) km s-1, and (3) km s-1. To allow direct comparisons between the galaxies having similar velocity dispersions, some small corrections were applied : the galaxies with () were convolved with the appropriate Gaussian to reach a fixed . On those spectra we determined our line strength indices. For example, the spectrum of NGC 4387 with a of 120 km s-1 was convolved with a Gaussian of km s-1 to reach a simulated () of 150 km s-1.
3.1 H and Other Age Indicators
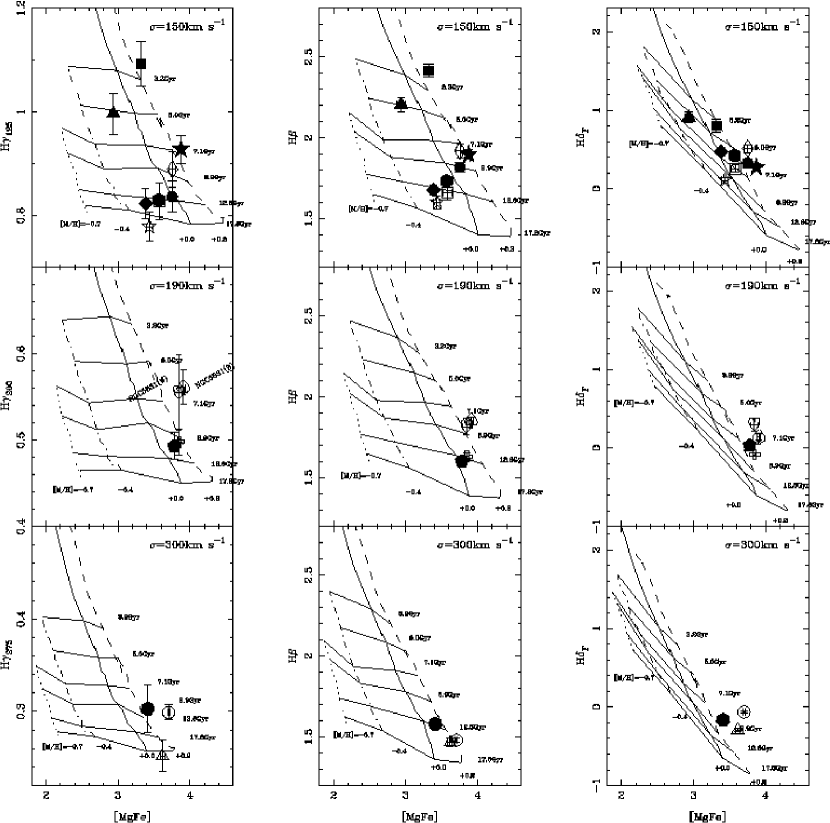
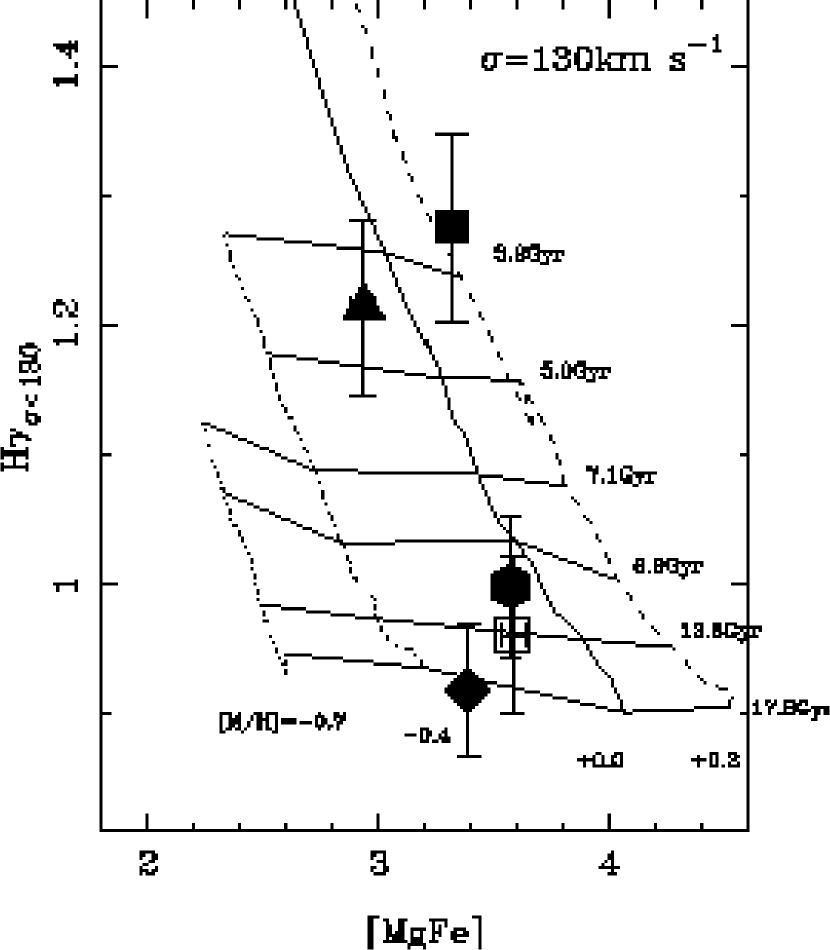
In Fig. 2, H (left), H (center) and H (right) are used as the age indicators, while the often-used metallicity indicator [MgFe] (González 1993) is used as the metallicity index. The velocity dispersion of the galaxies increases in each column from top to bottom. Note how the model grids change as a function of velocity dispersion.
The left panel (H–[MgFe]) of Fig. 2 confirms again that H is well-suited to break the age-metallicity degeneracy (Vazdekis & Arimoto 1999). The lines of constant age are almost horizontal, and the grid of revised Vazdekis (1999) models is more orthogonal than the other two index-index diagrams (center and right panels). Moreover, since H has much narrower index difinition than the other H indices such as H, metallicity and -enhanced effects should be significantly smaller (Thomas, Maraston & Korn 2004). Therefore, we are able to derive ages using H under small influence of metallicity, or abundance ratios such as [Mg/Fe], though it can be still affected by underlying isochrone structure with non-solar abundance ratios. Since H is less affected by emission lines (see Worthey & Ottaviani 1997, for example), the results from H are more reliable in general than those from H.
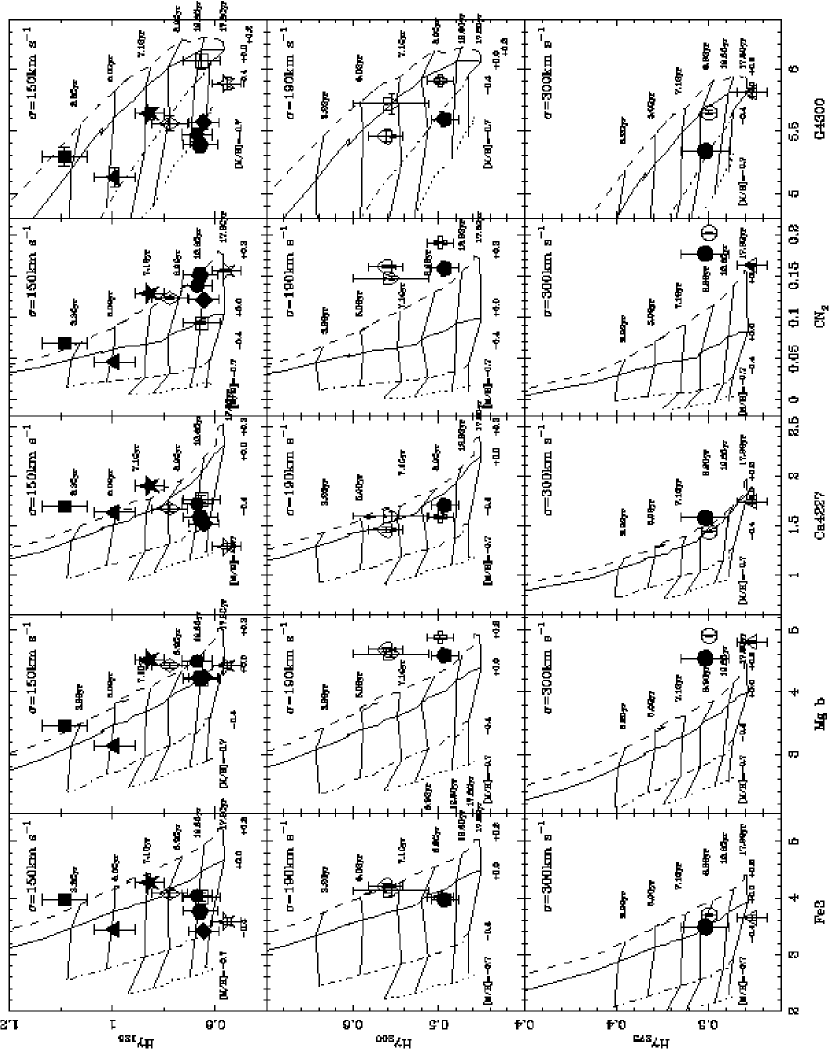
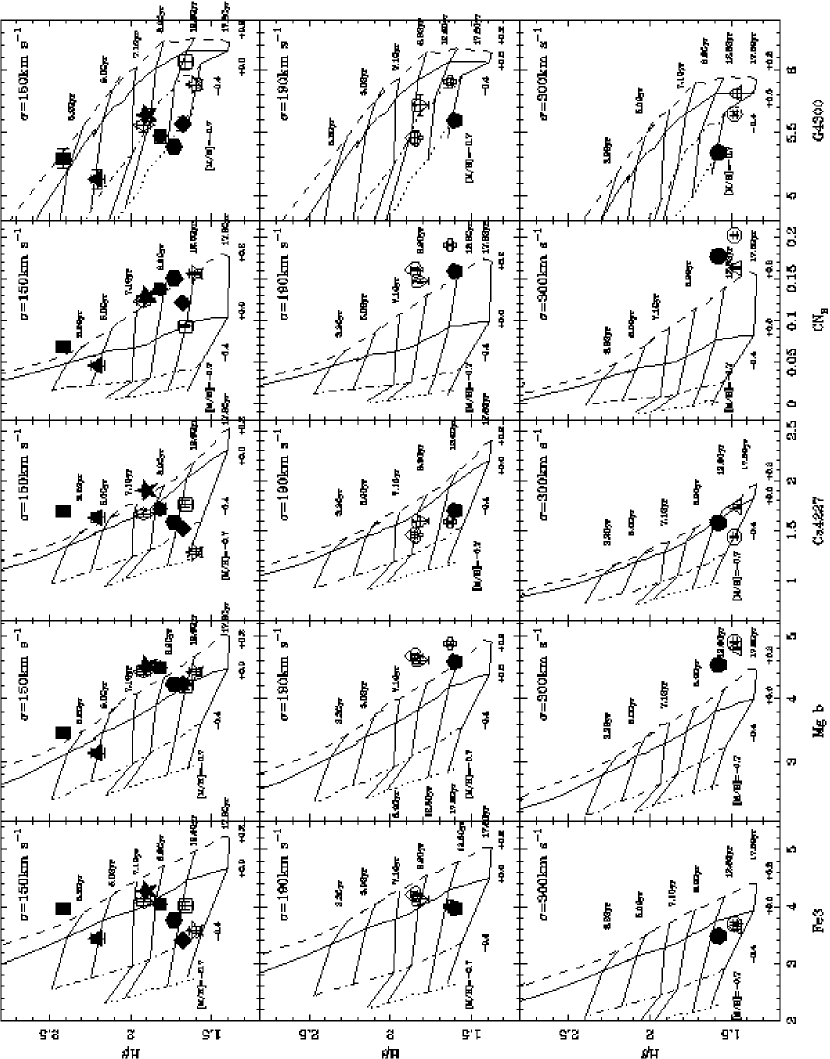
Not shown here are diagrams using the other age indicators of Worthey & Ottaviani (1997), i.e., H, H, and H, as their abilities to disentangle ages and metallicities are similar or even smaller than H. In Fig. 3, we show H as a function of several other metal indices: Fe3, Mg, Ca4227, CN2 and G4300. We also present the H vs. metallicity indicator diagrams in Fig. 4 to demonstrate the disadvantage of using non-orthogonal diagrams for measuring ages of galaxies with non-solar abundance ratios. One can clearly see that the age obtained using H–Fe3 is older than that from H–Mg, providing H provide less accurate abundances of various elements.
For galaxies with km/s (NGC 4239, NGC 4387, NGC 4467 and NGC 4489), the H index can also be applied (Fig. 5). The H index has a slightly different wavelength definition; i.e., a wider bandpass for the H feature than is the case for the other H indices. It turns out that the ages derived from H for these four galaxies are completely consistent with those from H.
Balmer lines may be filled in with gas emission, becoming weaker and making it difficult to measure accurate mean ages. Although González (1993) and Trager et al. (2000a) made corrections to the H measurements using the [OIII]5007Å emission line, we did not make any corrections here in this paper. We have investigated whether this correction is necessary by fitting the whole galaxy spectra with the SSP models to the data. If there is a residual at H or at H, it could be attributed to the presence of nebular emission. From these residual we found spectra that a only few galaxies show emission lines [OIII]4959 and/or [OIII]5007 (NGC 4239, NGC 4489 and NGC 4697, see Fig. 9). However they are small enough to be ignored for the H and H age determinations.
3.2 Ages from H and H
For each galaxy we determined the ages from H and H by comparing the data with the SSP models. The resulting ages are given in Table 5. The errors in the H ages are dominated mainly by photon noise, while those for H determined in this way are mostly due to systematic errors coming from the resulting non-orthogonal index-index model grids. Therefore, while the errors in ages from H can be improved by longer exposures, this is not straightforward for H ages. Note that in principle one can obtain better ages from H using more sophisticated modeling. In Table 5 we show the errors which one gets when using these simple index-index diagrams. We found that in most cases the youngest ages come from the H–Mg diagram, while the oldest ages come from H–Fe3 diagram. The errors in the H ages listed in Table 5 come from these two diagrams. One can clearly see that the observed galaxies cover a wide range of ages, from 3 Gyrs to over 15 Gyrs, particularly for the galaxies with lower velocity dispersion.
Fig. 6 shows the age differences between H and H. They are consistent with each other within the errors, since H is not strongly affected by emission for our sample. Since [MgFe], used for deriving the H age, is almost insensitive to the [/Fe] ratio, we infer that there is no systematic difference between the two ages, therefore, the H ages are also used in the following discussion. We note also that for several velocity dispersions many index – H diagrams are still somewhat perpendicular, so that also the systematic errors are not much larger than the errors from photon noise.
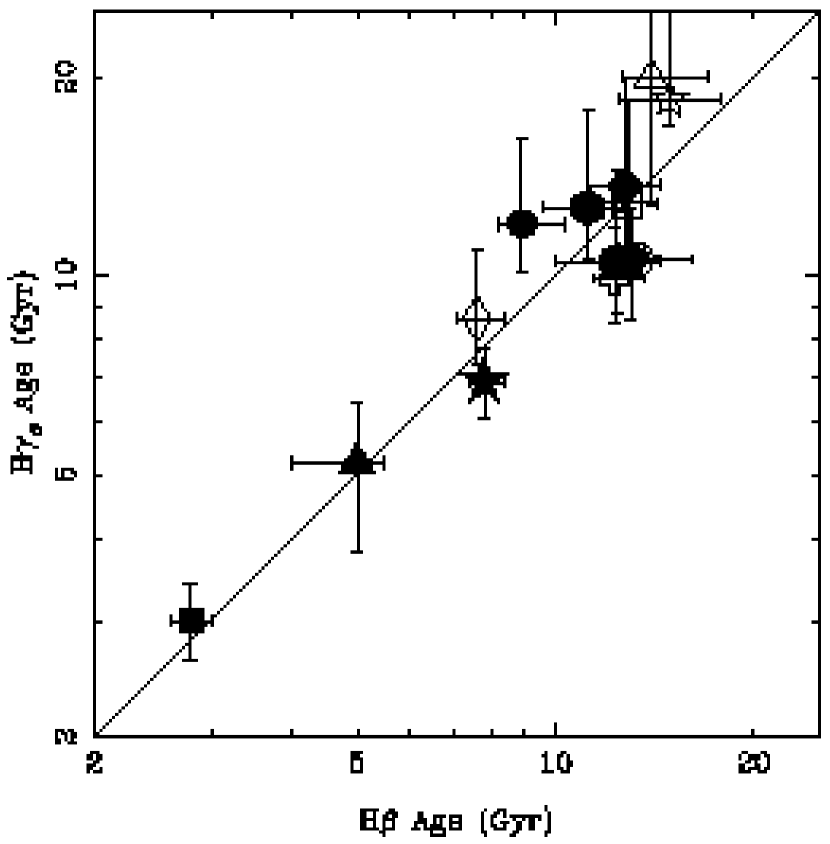
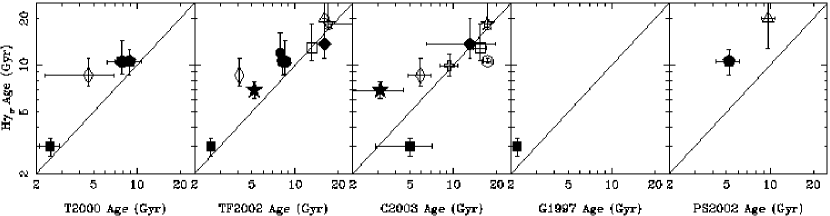
Fig. 7 gives the comparison between our results and the literature, i.e., Gorgas et al. (1997), Trager et al. (2000a), Terlevich & Forbes (2002), Proctor & Sansom (2002) and Caldwell, Rose & Concannon (2003). Gorgas et al. (1997), Trager et al. (2000a) and Proctor & Sansom (2002) measured ages from H using Worthey (1994)’s models. In Trager et al. (2000a), H measurements were corrected for emission using the [OIII] 5007Å line. Caldwell et al. (2003) used a combination of Balmer lines (Hn/Fe) and their new SSP models. The ages of Terlevich & Forbes (2002) are a compilation of several line index papers (Davies et al. 1993; Carollo et al. 1993; Fisher et al. 1996; González 1993; Goudfrooij et al. 1999; Halliday 1998; Kuntschner 1998; Longhetti et al. 1998; Mehlert et al. 1997; Vazdekis & Arimoto 1999). All age measurements except for those of Vazdekis & Arimoto (1999) come from H. Our relative ages are consistent with those of the previous papers, although our results are systematically older. The systematic difference can be explained in several ways: 1) over correction in the literature for emission line contamination on H. To correct the emission effect in H measurements, all the past studies used the H[OIII] equation of González (1993), which had been derived from the residuals between galaxy spectra and stellar spectra (not SSP models). We made no correction for emission lines, since our measurements are based on the H feature, which is almost free of emission lines due to residual star formation or planetary nebulae. 2) Worthey (1994)’s model, which the previous works used, is based on polynomial fitting functions of the Lick/IDS system. To compare our results with the previous literature, it is necessary to convert our measurements of the indices to the Lick/IDS system. Having done that, we find no systematic difference between our measurements and the literature measurements which use the Lick/IDS system, although the error is large due to our relatively small number of reference stars used for the conversion. Accordingly, we conclude that the systematic difference in ages does not come from differences in the observational configurations used nor from data reduction errors. The models of Vazdekis (1999) employs the Padova Isochrones (Girardi et al. 2000), while the Worthey (1994) model used the Revised Yale Isochrones (Green et al. 1987). Since the Padova Isochrones are systematically hotter, this may explain the difference in the estimated ages. 3) The age estimates corresponding to the H vs. [MgFe] diagram in the Lick/IDS system differ from those estimated using flux-calibrated response curves at the specific velocity dispersion of the galaxy (see Kuntschner et al. 2002).
We note that NGC 4365 has a very old age, of more than 20 Gyr (but consistent with 14 Gyr within 1). We need S/N/Å 350 for galaxies with km s-1, while we have achieved in this case S/N/Å= 250. As a result the uncertainty in the age is rather large. Note that the H age of NGC 4365 is 14.0 Gyrs, which is consistent with that of Davies et al. (2001). Finally note that relative age differences are much more accurate than absolute ages, due to possible calibration problems in the stellar evolutionary tracks (Vazdekis et al. 2001b).
| NGC | Age(Gyr)a | [M/H]a | Age(Gyr)b | [M/H]b | [ZFe/H]c | [ZMg/H]c | [ZCa/H]c | [ZCN/H]c | [ZCH/H]c |
|---|---|---|---|---|---|---|---|---|---|
| [ZMg/ZFe]c | [ZCa/ZFe]c | [ZCN/ZFe]c | [ZCH/ZFe]c | ||||||
| 4239 | 5.2 | –0.16 | 5.0 | –0.15 | –0.14 | –0.18 | +0.20 | –0.16 | –0.32 |
| –0.04 | +0.34 | –0.02 | –0.18 | ||||||
| 4339 | 12.0 | –0.01 | 8.9 | +0.09 | –0.12 | +0.17 | –0.21 | +0.16 | –0.68 |
| +0.29 | –0.09 | +0.28 | –0.56 | ||||||
| 4365 | 20.0 | +0.10 | 14.0 | +0.16 | –0.13 | +0.35 | –0.06 | +0.20 | –0.01 |
| +0.48 | +0.07 | +0.33 | +0.12 | ||||||
| 4387 | 12.9 | –0.12 | 12.9 | –0.12 | –0.14 | –0.02 | –0.20 | –0.03 | –0.14 |
| +0.12 | –0.06 | +0.11 | +0.00 | ||||||
| 4458 | 13.7 | –0.24 | 12.8 | –0.20 | –0.37 | –0.03 | –0.36 | +0.08 | –0.69 |
| +0.34 | +0.01 | +0.45 | –0.32 | ||||||
| 4464 | 18.5 | –0.30 | 14.9 | –0.21 | –0.38 | –0.04 | –0.66 | +0.13 | –0.66 |
| +0.36 | –0.26 | +0.53 | –0.26 | ||||||
| 4467 | 12.7 | –0.12 | 11.2 | –0.08 | –0.23 | –0.01 | –0.33 | +0.19 | –0.74 |
| +0.22 | –0.10 | +0.42 | –0.51 | ||||||
| 4472 | 10.5 | +0.24 | 12.4 | +0.11 | –0.02 | +0.52 | +0.35 | +0.48 | –0.37 |
| +0.54 | +0.37 | +0.50 | –0.35 | ||||||
| 4473 | 9.9 | +0.17 | 12.3 | +0.09 | –0.05 | +0.53 | –0.19 | +0.41 | –0.07 |
| +0.58 | –0.14 | +0.46 | –0.02 | ||||||
| 4478 | 8.6 | +0.10 | 7.6 | +0.16 | –0.02 | +0.27 | –0.10 | +0.18 | –0.41 |
| +0.29 | –0.08 | +0.20 | –0.39 | ||||||
| 4489 | 3.0 | +0.26 | 2.8 | +0.31 | +0.30 | +0.28 | +0.65 | +0.29 | +0.11 |
| –0.02 | +0.35 | –0.01 | –0.19 | ||||||
| 4551 | 6.9 | +0.26 | 7.8 | +0.21 | +0.11 | +0.39 | +0.38 | +0.26 | –0.20 |
| +0.28 | +0.27 | +0.15 | –0.31 | ||||||
| 4621 | 10.6 | +0.35 | 13.3 | +0.23 | +0.07 | +0.68 | –0.01 | +0.53 | –0.09 |
| +0.61 | –0.08 | +0.46 | –0.16 | ||||||
| 4697 | 10.6 | +0.11 | 13.0 | +0.03 | –0.08 | +0.34 | –0.11 | +0.27 | –0.45 |
| +0.42 | –0.03 | +0.35 | –0.37 |
a H–[MgFe] diagram.
b H–[MgFe] diagram.
c Metallicities and pseudo-abundance ratios come from the H
vs. Fe3, Mg, Ca4227, CN2 and G4300 diagram, respectively.
3.3 Metallicity and Abundance Ratios
By breaking the age-metallicity degeneracy, we can estimate the mean metallicity [M/H] and a heuristic abundance ratio [ZX/Fe] for the elements or molecules X that happen to dominate the absorption of the indices plotted in Fig. 3.
[M/H] is determined from the H–[MgFe] and the H–[MgFe] diagram. Thomas et al. (2003) have shown that the [MgFe] index is a good indicator of the total metallicity [M/H] and almost independent of [/Fe] (see also Vazdekis et al. 2001b; Bruzual & Charlot 2003).
Abundance ratios contain important information about the formation of galaxies, and are understood to indicate different time-scales for various types of Supernovae (SNe). The enhancement of elements by SNe II explosions occurs without delay from the onset of star formation because their progenitors are massive stars. On the other hand, SNe Ia, whose progenitors are white dwarfs of binaries, mainly supply iron peak elements 1–1.5 Gyrs after the onset of star formation. As a result, lower [Mg/Fe] indicates that the contribution of SNe Ia is larger; i.e. star formation is relatively longer (Worthey 1998) or the number fraction of SNe Ia progenitors is enhanced. Concering CN, both carbon and nitrogen are ejected from AGB stars whose life time are placed between those of SNe II and SNe Ia. Therefore CN could be another potential indicator for the duration of star formation (Sánchez-Blázquez et al. 2003), although the photospheric abundance of carbon and nitrogen are rather fragile to the convective dredge-up in the stellar interior and thus may not directly reflect the nucleosynthesis history. However, it has been recently found a correlation between the abundance ratio of CN with respect to Mg and Fe and X-ray luminosity of galaxy cluster (Carretero et al. 2004).
Since the Worthey (1994) models only have solar abundance ratios, past studies (Trager et al. 2000b; Proctor & Sansom 2002) used the response functions on the Lick/IDS system of Tripicco & Bell (1995) to derive abundance ratio of each element. Since the method using their response functions is complex and introduces unknown systematic errors, we did not use it. We therefore adopted a more straightforward method using the H–metal index diagrams, i.e., we directly estimated [ZFe/H], [ZMg/H], [ZCa/H], [ZCN/H] and [ZCH/H] from the H vs. Fe3, Mg, Ca4227, CN2 and G4300 diagram with the SSP model grids, respectively. For galaxies outside the model grid, we slightly extrapolated the grid to measure their metallicities.
Although our method is more straightforward, the estimated abundances still include uncertainties. For example, it is well known that a line index has contamination from other elements. Thomas et al. (2003) have pointed out the [/Fe] bias of stellar libraries using stars in our Galaxies, i.e., metal poor stars have positive [/Fe]. Another problem is that the SSP models used here have been made using stellar interior models and isochrones with solar abundance ratios. One therefore has to keep this in mind, although it is safe to use them for deriving relative ages as we have shown in this work. To differentiate between our heuristically estimated abundances and true [X/H] abundances, estimated abundances in this paper are written as [ZX/H] and so on.
In Fig. 3 we confirm the well-known result that elliptical galaxies have non-solar abundance ratios (e.g. Worthey et al. 1992; Trager et al. 2000a). For example, NGC 4365, NGC 4472, NGC 4473, NGC 4551, NGC 4621 and NGC 4697 show a large enhancement in [ZMg/H] and many of our sample galaxies, except for NGC4239, NGC4387 and NGC4489 show significant enhancement in [ZCN/H]. [ZCa/H] is subsolar for most galaxies, which was first pointed out by Vazdekis et al. (1997), for reasons that are not fully clear yet. One would expect Ca to behave like other -elements such as Mg, on the basis of a nucleosynthetic and chemical evolution sense. Vazdekis et al. (2003) showed that CaII triplet indices in the infrared are sensitive the global metallicity for [Fe/H] and depend very much on the IMF for [Fe/H] .
![[Uncaptioned image]](/html/astro-ph/0511122/assets/x10.png)
![[Uncaptioned image]](/html/astro-ph/0511122/assets/x11.png)
![[Uncaptioned image]](/html/astro-ph/0511122/assets/x12.png)
![[Uncaptioned image]](/html/astro-ph/0511122/assets/x13.png)
![[Uncaptioned image]](/html/astro-ph/0511122/assets/x14.png)
3.4 Fitting with SSP Models
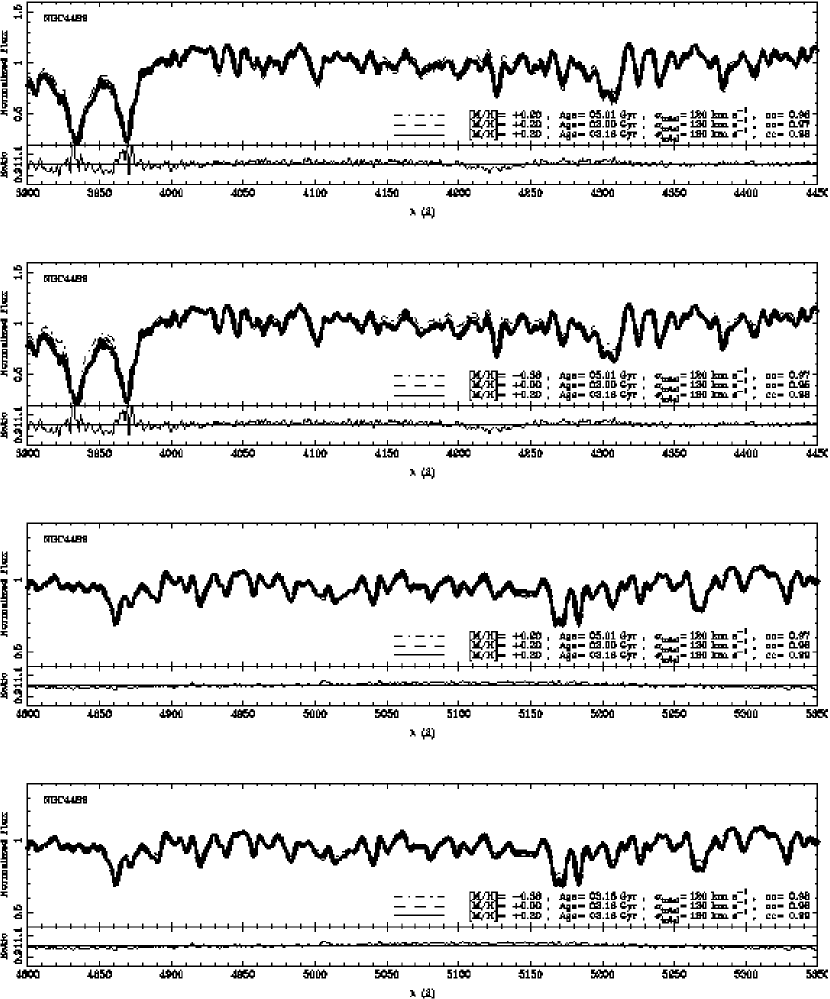
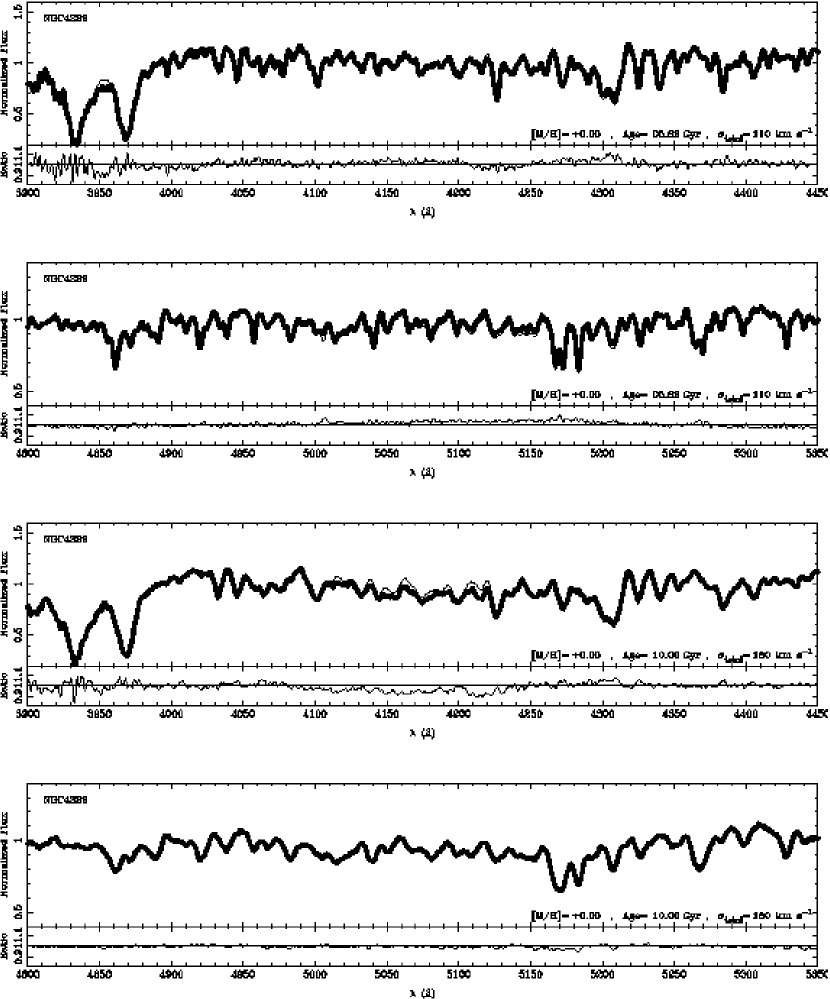
We show the observed and the best matching SSP spectra in Figs. 8 & 9 222Fig. 9 are available in the electronic version.. Both the observed spectra and the SSPs are divided by a fitted polynomial of order 2 and normalized at 4350Å and 4950Å for the blue and red spectra, respectively. We do not fit wavelength shorter than 4000Å since no data are available there (WHT) or they have low sensitivity (Subaru). The observed galaxies are indicated by thick lines, and models by thin lines. Ages, metallicities and of the models are quoted in each figure. We also present the ratio of observed spectrum to the SSP model in the lower panel of each diagram.
For NGC 4489, we examined the models with several ages and metallicities to confirm the accuracy of our age and metallicity estimate from the line indices (Fig. 8). Since the estimated age and metallicity of this galaxy are 3.1 Gyrs and [M/H] = +0.20, respectively, we show the fits with age of 2.00, 3.16, 5.01 Gyrs, and with [M/H] of +0.20, 0.0, –0.38. For reference, we also show the cross correlation peak heights derived using the IRAF task “fxcor”, whose value of 1.00 means that the perfect fit has been reached. Fig. 8 shows that the model of the same age and metallicity derived by H, i.e., 3.1 Gyrs and [M/H]=+0.20, clearly gives the best fit.
We have confirmed that most of galaxies show excellent fits to models of ages and metallicities derived from the H–[MgFe] diagram. For NGC 4365, whose H age is over 20 Gyrs, we estimated that the age is 14–18 Gyrs by fitting of models with various ages. One can see the small emission lines of [OIII]4959Å and/or [OIII]5007Å for NGC 4239, NGC 4489 and NGC 4697, but we cannot see residuals in either H or H for any of the galaxies. Hence, we conclude that emission lines do not affect our age measurements. The overabundance of CN can also be seen in the fits. The observed spectra of NGC 4365, NGC 4458, NGC 4464, NGC 4467, NGC 4472, NGC 4621 and NGC 4697 are below the models around the CN molecular band at 4150Å. NGC 4464, NGC 4472 and NGC 4621 show stronger absorption of the Mg triplet line at 5180Å. In conclusion, our age and metallicity measurements agree with the whole spectral fitting and they can be trusted in our discussion.
4 Conclusions
We have obtained very high S/N (100, per Å) spectra of 8 elliptical galaxies selected along the CMR in the Virgo cluster with the Subaru Telescope and 6 elliptical galaxies observed with the WHT previously reported in Vazdekis et al. (2001a), spanning a total luminosity range of 5.8 magnitude. By using the H method, we have determined ages, metallicities, and abundance ratios of 14 elliptical galaxies in the Virgo cluster.
The H index is almost independent of the galaxy metallicity; i.e., it can break the age-metallicity degeneracy, therefore the age from the H index does not depend much on metallicity ([M/H]) or abundance ratios. Although, like all indices, H is not completely immune from abundance ratios (Vazdekis et al. 2001b), the relative ages remain secure. The resulting ages show a large spread, from 3 Gyrs to over 15 Gyrs. We have compared these ages with previous studies that used the H index and find that the relative ages are consistent.
We find that ZCa (from the Ca4227 index) is following ZFe, and that Mg (from the Mg index) is overabundant with respect to Fe. These results are partially known in past studies, however, previous approaches were affected by the age-metallicity degeneracy. If one takes those abundances at face value, it is not easy to reconcile underabundant Ca with overabundant Mg at the same time, since both Ca and Mg are thought to come from SNeII. Our results seem to suggest that Ca and Mg are not produced in SNeII of exactly the same mass range.
We also fitted the spectra with SSP models finding good agreement with our age and metallicity determination. Contamination of emission in H and H is small enough not to affect our age measurements, while three galaxies (NGC 4239, NGC 4489 and NGC 4697) have emission line in [OIII]4959 and/or [OIII]5007. Our fits show the overabundance of some elements in several galaxies: NGC 4365, NGC 4458, NGC 4464, NGC 4467, NGC 4472, NGC 4621 and NGC 4697 have a strong CN band at 4150Å and NGC 4464, NGC 4472 and NGC 4621 show stronger absorption in the Mg triplet than the fitted SSP model.
In a subsequent paper, based on the ages and metallicities determined here and together with the velocity dispersions and luminosities, we will discuss the star formation history of elliptical galaxies along the CMR of the Virgo cluster.
References
- Arimoto (1996) Arimoto,N. 1986, From Stars to Galaxies, ASP Conference Series, Vol. 98, 1996
- Arimoto & Yoshii (1987) Arimoto,N. & Yoshii,Y. 1987, A&A, 173, 23
- Bender, Burstein & Faber (1993) Bender,R., Burstein,D. & Faber,S.M. 1993, ApJ, 411, 153
- Blakeslee et al. (2003) Blakeslee,J.P. et al. 2003, ApJL, 596, 143
- Bower, Lucey & Ellis (1992) Bower,R.G., Lucey,J.R. & Ellis,R.S. 1992, MNRAS, 254, 589
- Bower, Lucey & Ellis (1992) Bower,R.G., Lucey,J.R. & Ellis,R.S. 1992, MNRAS, 254, 601
- Bruzual & Charlot (2003) Bruzual,A.G. & Charlot,S. 2003, MNRAS, 344, 1000
- Burstein, Faber, Gaskell & Krumm (1984) Burstein,D., Faber,S.M., Gaskell,C.M. & Krumm,N. 1984, ApJ, 287, 586
- Caldwell, Rose & Concannon (2003) Caldwell,N., Rose,J.A. & Concannon,K.D. 2003, AJ, 125, 2891
- Cardiel, Gorgas, Cenarro & González (1998) Cardiel,N., Gorgas,J., Cenarro,J. & González,J.J. 1998, A&AS, 127, 597
- Cardiel, Gorgas, Sánchez-Blázquez, Cenarro, Pedraz, Bruzual & Klement (2003) Cardiel,N., Gorgas,J., Sánchez-Blázquez,P., Cenarro,A.J., Pedraz,S., Bruzual,G. & Klement,J. 2003, A&A, 409, 511
- Carollo, Danziger & Buson (1993) Carollo,C.M., Danziger,I.J. & Buson,L. 1993, MNRAS, 265, 553
- Carretero, Vazdekis, Beckman, Sánchez-Blázquez & Gorgas (2004) Carretero,C., Vazdekis,A., Beckman,J.E., Sánchez-Blázquez,P. & Gorgas,J. 2004, ApJL, 609, 45
- Colless, Burstein, Davies, McMahan, Saglia & Wegner (1999) Colless,M., Burstein,D., Davies,R.L., McMahan,R.K., Saglia,R.P. & Wegner,G. 1999, MNRAS, 303, 813
- Davies, Sadler & Peletier (1993) Davies,R.L., Sadler,E.M. & Peletier,R.F. 1993, MNRAS, 262, 650
- Davies et al. (2001) Davies,R.L. et al. 2001, ApJL, 548, 33
- de Vaucouleurs, de Vaucouleurs, Corwin, Buta, Paturel & Fouqu’e (1991) de Vaucouleurs,G., de Vaucouleurs,A., Corwin,H.G., Buta,R.J., Paturel,G. & Fouqu’e. 1991, Springer-Verlag: New York
- Djorgovski & Davis (1987) Djorgovski,S. & Davis,M. 1987, ApJ, 313, 59
- Dressler, Lynden-Bell, Burstein, Davies, Faber, Terlevich & Wegner (1987) Dressler,A., Lynden-Bell,D., Burstein,D., Davies,R.L., Faber,S.M., Terlevich,R. & Wegner,G. 1987, ApJ, 313, 42
- Eggen, Lynden-Bell & Sandage (1962) Eggen,O.J., Lynden-Bell,D. & Sandage,A.R. 1962, ApJ, 136, 748
- Ferreras & Silk (2000) Ferreras,I. & Silk,J. 2000, ApJ, 532, 193
- Ferreras, Charlot & Silk (1999) Ferreras,I., Charlot,S. & Silk,J. 1999, ApJ, 521, 81
- Fisher, Franx & Illingworth (1996) Fisher,D., Franx,M. & Illingworth,G. 1996, ApJ, 459, 110
- Girardi, Bressan, Bertelli & Chiosi (2000) Girardi,L., Bressan,A., Bertelli,G. & Chiosi,C. 2000, A&AS, 141, 371
- González (1993) González,J.J. 1993, PhD.Thesis, University of California, Santa Cruz
- Gorgas, Efstathiou & Aragón-Salamanca (1990) Gorgas,J., Efstathiou,G. & Aragón-Salamanca,A. 1990, MNRAS, 245, 217
- Gorgas et al. (1997) Gorgas,J., Pedraz,S., Guzman,R., Cardiel,N. & González,J.J. 1997, ApJL, 481, 19
- Goudfrooij, Gorgas & Jablonka (1999) Goudfrooij,P., Gorgas,J & Jablonka,P. 1999, ApSS, 269, 109
- Green, Demarque & King (1987) Green,E.M, Demarque,P. & King,C.R. 1987, The Revised Yale Isochrones and Luminosity Functions (New Haven: Yale University Observatory)
- Halliday (1998) Halliday,C. 1998, PhDT, 26
- Jones (1998) Jones,L.A. 1998, PhD.Thesis, University of Carolina, Chapel Hill
- Jones & Worthey (1995) Jones,L.A. & Worthey,G. 1995, ApJL, 446, 31
- Kashikawa et al. (2002) Kashikawa,N. et al. 2002, PASJ, 54, 819
- Kauffmann & Charlot (1998) Kauffmann,G. & Charlot,S. 1998, MNRAS, 294, 705
- Kauffmann et al. (2003) Kauffmann,G., Heckman,T., White,S.D.M., Charlot,S., Tremonti,C., Peng,E.W., Seibert,M., Brinkmann,J., Nichol,R.C., SubbaRao,M. & York,D. 2003, MNRAS, 341, 54
- Kobayashi & Arimoto (1999) Kobayashi,C. & Arimoto,N. 1999, ApJ, 527, 573
- Kodama & Arimoto (1997) Kodama,T. & Arimoto,N. 1997, A&A, 320, 41
- Kuntschner (1998) Kuntschner,H. 1998, PhD.Thesis, University of Durham
- Kuntschner (2000) Kuntschner,H. 2000, MNRAS, 315, 184
- Kuntschner, Smith, Colless, Davies, Kaldare & Vazdekis (2002) Kuntschner,H., Smith,R.J., Colless,M., Davies,R.L., Kaldare,R. & Vazdekis,A. 2002, MNRAS, 337, 172
- Longhetti, Rampazzo, Bressan & Chiosi (1998) Longhetti,M., Rampazzo,R., Bressan,A. & Chiosi,C. 1998, A&AS, 130, 251
- McElroy 1995, ApJS, 100, (105) McElroy,D.B. 1995, ApJS, 100, 105
- Michard (1982) Michard,R. 1982, A&AS, 49, 591
- Mehlert, Bender, Saglia, Wegner, (1997) Mehlert,D., Bender,R., Saglia,R.P.,Wegner,G. 1997, in Mazure,A., Casoli,F., Durret,F., Gerbal,D., eds, Coma Berenices: A New Vision of an Old Cluster. Word Scientific, Singapore, p.107
- Peletier et al. (1990) Peletier, R.F., Davies, R.L., Illingworth, G.D., Davis, L.E., & Cawson, M. 1990, AJ, 100, 1091
- Poggianti et al. (2001) Poggianti,B.M. et al. 2001, ApJ, 562, 689
- Proctor & Sansom (2002) Proctor,R.N. & Sansom,A.E. 2002, MNRAS, 333, 517
- Rose (1984) Rose,J.A. 1984, AJ, 89, 1238
- Sánchez-Blázquez, Gorgas, Cardiel, Cenarro & González (2003) Sánchez-Blázquez,P., Gorgas,J., Cardiel,N., Cenarro,J. & González,J.J. 2003, ApJL, 590, 91
- Stanford, Eisenhardt & Dickinson (1998) Stanford,S.A., Eisenhardt,P.R. & Dickinson,M. 1998, ApJ, 492, 461
- Terlevich, Kuntschner, Bower, Caldwell & Sharples (1999) Terlevich,A.I., Kuntschner,H., Bower,R.G., Caldwell,N. & Sharples,R.M. 1999, MNRAS, 310, 445
- Terlevich, Caldwell & Bower (2001) Terlevich,A.I., Caldwell,N. & Bower,R.G. 2001, MNRAS, 326, 1547
- Terlevich & Forbes (2002) Terlevich,A.I. & Forbes,D.A. 2002, MNRAS, 330, 547
- Thomas, Maraston & Bender (2003) Thomas,D., Maraston,C. & Bender,R. 2003, MNRAS, 339, 897
- Thomas, Maraston & Korn (2004) Thomas,D., Maraston,C. & Korn,A. 2004, MNRASL, 351, 19
- Toomre & Toomre (1972) Toomre,A. & Toomre,J. 1972, ApJ, 178, 623
- Trager, Faber, Worthey & González (2000) Trager,S.C., Faber,S.M., Worthey,G. & González,J.J. 2000, AJ, 119, 1645
- Trager, Faber, Worthey & González (2000) Trager,S.C., Faber,S.M., Worthey,G. & González,J.J. 2000, AJ, 120, 165
- Trager, Worthey, Faber, Burstein & González (1998) Trager,S.C., Worthey,G., Faber,S.M., Burstein,D. & González,J.J. 1998, ApJS, 116, 1
- Tripicco & Bell (1995) Tripicco,M.J. & Bell,R.A. 1995, AJ, 110, 3035
- Vazdekis, Casuso, Peletier & Beckman (1996) Vazdekis,A., Casuso,E., Peletier,R.F. & Beckman,J.E. 1996, ApJS, 106, 307
- Vazdekis, Peletier, Beckman & Casuso (1997) Vazdekis,A., Peletier,R.F., Beckman,J.E. & Casuso,E. 1997, ApJS, 111, 203
- Vazdekis (1999) Vazdekis,A. 1999, ApJ, 513, 224
- Vazdekis & Arimoto (1999) Vazdekis,A. & Arimoto,N. 1999, ApJ, 525, 144
- Vazdekis, Kuntschner, Davies, Arimoto, Nakamura & Peletier (2001) Vazdekis,A., Kuntschner,H., Davies,R.L., Arimoto,N., Nakamura,O. & Peletier,R. 2001a, ApJL, 551, 127
- Vazdekis, Salaris, Arimoto & Rose (2001) Vazdekis,A., Salaris,M., Arimoto,N. & Rose,J.A. 2001b, ApJ, 549, 274
-
Vazdekis et al. (2003)
Vazdekis,A., Cenarro,A.J., Gorgas,J., Cardiel,N. & Peletier,R.F. 2003, MNRAS, 340, 1317
- Worthey (1994) Worthey,G. 1994, ApJS, 95, 107
- Worthey, Faber & González (1992) Worthey,G., Faber,S.M. & González,J.J. 1992, ApJ, 398, 69
- Worthey, Faber, González & Burstein (1994) Worthey,G., Faber,S.M., González,J.J. & Burstein,D. 1994, ApJS, 94, 687
- Worthey & Ottaviani (1997) Worthey,G. & Ottaviani,D.L. 1997, ApJS, 111, 377
- Worthey (1998) Worthey,G. 1998, PASP, 110, 888
- Ziegler & Bender (1997) Ziegler,B.L. & Bender,R. 1997, MNRAS, 291, 527