Is the core of M87 the source of its TeV emission? Implications for unified schemes.
Abstract
M87 has been recently shown to be a TeV source which is likely to be variable. Based on this, and on contemporaneous optical and X-ray monitoring, we argue that the source of the TeV emission is the core of M87 and not one of two jet knots (HST-1 and A) with X-ray brightness comparable to that of the core. We model the TeV emission in the core as inverse Compton (IC) emission from the base of the jet. Homogeneous models fail to reproduce the spectral energy distribution (SED) and, in particular, the TeV flux. They also fail to comply with the unified scheme of BL Lacertae (BL) objects and FR I radio galaxies. A jet that decelerates from a Lorentz factor down to over a length of pc reproduces the observed SED of the M87 core, and, when aligned to the line of sight, produces a SED similar to those of TeV BLs. The TeV flux in the decelerating jet model is successfully reproduced as upstream Compton (UC) scattering, a recently identified emission mechanism, in which energetic electrons of the upstream faster flow upscatter the low energy photons produced in the slower downstream part of the flow.
1 Introduction
Gamma-ray emission in GeV energies has been detected in several bright BLs (Hartman et al., 1999). A handful of nearby, bright BLs have been also detected in the TeV regime (e.g. Aharonian et al. 2005). Gamma-ray emission at some level is expected from radio galaxies, since, according to the unified scheme (e.g. Urry & Padovani 1995), BLs are FR I radio galaxies (Fanaroff & Riley, 1974) with their relativistic jets oriented toward the observer. So far, the only radio galaxies detected in Gamma-rays are the FR I’s Cen A (Sreekumar et al., 1999) and M87 (HEGRA, Aharonian et al. 2003; HESS, Beilicke et al. 2005) at TeV energies. Also, a tentative GeV detection of NGC 6251 (Mukherjee et al., 2002) has been strengthened by its hard X-ray detection. (Foschini et al 2005).
M87 is among the nearest galaxies with a bright radio/optical/X-ray jet. Due to its proximity (distance 16 Mpc) the jet has been studied with unparalleled spatial resolution (e.g., Perlman et al. 1999, 2001 and references therein). The synchrotron emission extends to X-ray energies in all jet knots, as well as the core (e.g., Perlman et al. 2001, Marshall et al. 2002, Wilson & Yang 2002, Perlman & Wilson 2005). HST observations of the core (Tsvetanov et al., 1998) showed variability on timescales of month. HST and Chandra semi-monthly monitoring of the jet during the last three years (Harris et al. 2003, 2005; Perlman et al. 2003) established the broadband nature of this variability. Surprisingly, these observations detected an enormous (factor ) ongoing flare in the jet component HST-1, (60 pc projected) from the core, with similar variability timescales.
The discovery of flaring optical and X-ray emission established an important link between M87 and the BLs, as did the detection of apparent superluminal motion in the jet at radio (Biretta, Zhou, & Owen, 1995) and optical (Biretta, Sparks, & Macchetto, 1999) frequencies. The apparent superluminal velocities in the optical of c require a jet orientation angle and . The detection of TeV emission constitutes another link between FR I’s and BLs. The TeV data appear to indicate significant variability, as the 1998/99 (HEGRA) and 2003/04 (HESS) fluxes differ by over a factor 3 at significance (Beilicke et al. 2005). In BLs, correlated X-ray and TeV variations (e.g. Takahashi et al. 1996) suggest that the TeV emission is produced at the core. In the case of M87, it is necessary to consider as possible TeV emitters three components with comparable optical and X-ray synchrotron luminosity: the core, HST-1, and knot A, an extended jet feture located from the core.
Based on the likely TeV variability, we argue in §2 that the most plausible source of the TeV emission is the core and not HST-1 or knot A. In §3 we consider the modeling constraints imposed by the core SED and the unified scheme and show that homogeneous models cannot satisfy these constraints. We then show (§3.1) that a decelerating relativistic jet can solve these problems. Finally, in §4 we sum up our conclusions.
2 The source of the TeV emission: Variability constraints.
The production of TeV photons requires TeV energy electrons, which also emit optical – X-ray synchrotron radiation, resulting in correlated TeV and optical – X-ray variability. The possible TeV emission sites are, therefore, the brightest optical – X-ray features of the M87 jet. These are the core and knots A and HST-1, all of comparable optical and X-ray fluxes (within a factor ). We now use the fact that the TeV emission has likely dropped by a factor of between 1998/99 and 2003/04, to constrain the actual TeV source.
We first consider knot A, one of the largest bright regions in the M87 jet, with its flux maximum region in HST (Sparks, Biretta, & Macchetto, 1996) and Chandra (Perlman & Wilson, 2005) images, translating to 80 55 pc (projected). Such a large region cannot vary on timescales of a few years, and, indeed, monitoring by both ROSAT (Harris, Biretta, & Junor, 1999) and Chandra (Harris et al., 2005) does not detect variability of more than in the X-rays.
We turn now to knot HST-1, which is currently exceeding the core flux in the optical, UV, and X-rays by factors , depending on the band (Harris et al. 2003, 2005; Perlman et al. 2003). In Spring 2004, the X-ray flux of HST-1 was times brighter than it was in Spring 2003, and since 1998/99 the increase is far larger – nearly a factor 50. By comparison, there is no evidence of an increase in TeV flux from 2003 to 2004, or from 1998 to 2004 (Aharonian et al., 2003; Beilicke et al., 2005). Since the X-ray and TeV variations are not correlated, the contribution of HST-1 to the TeV output of M87 seems not to be significant. This may indicate a low synchrotron photon compactness for HST-1, which can be used to set, in a manner similar to that of Stawartz et al. (2004) for knot A, a lower limit on its magnetic field.
Having excluded knots A and HST-1, we turn to the core. HST, ROSAT and Chandra monitoring (Harris et al. 1999, 2003, priv. comm.; Perlman et al. 2003) suggest that its variations may be similar to those observed by HEGRA and HESS in 1998/99, and 2003/04. We therefore believe that the most likely source for the TeV emission is the core of M87.
3 Modeling the core SED
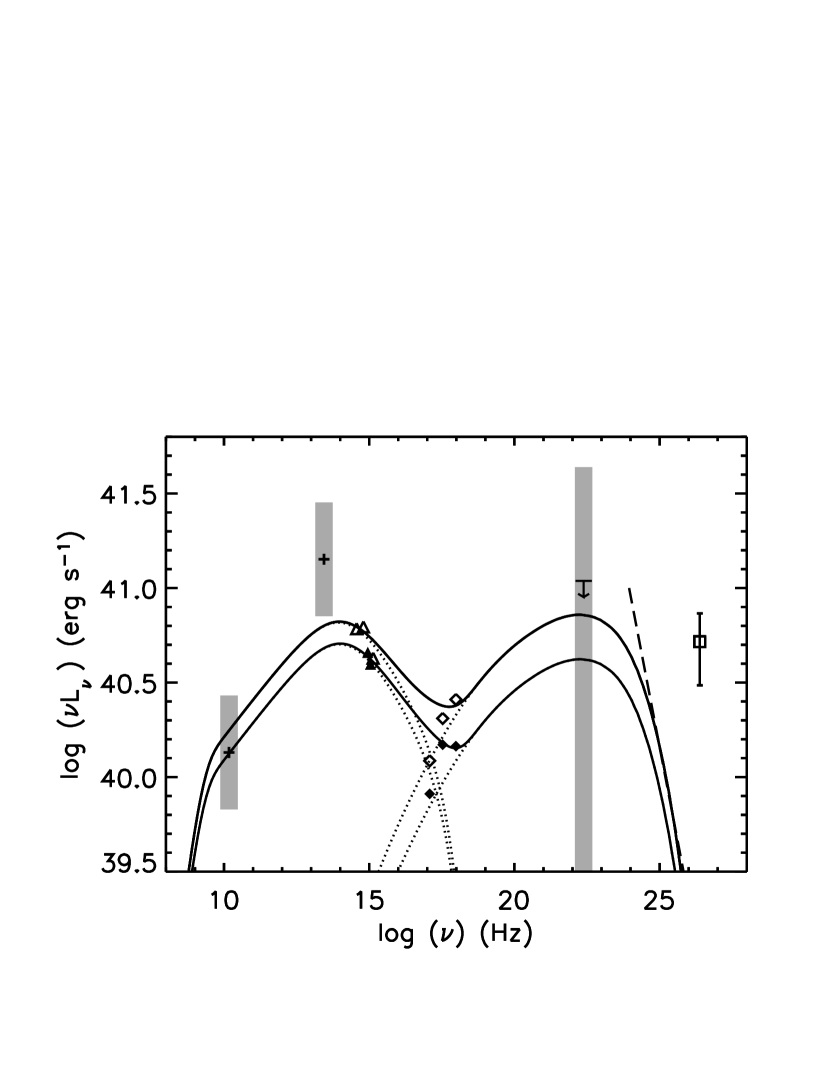
Given the month variability timescale of the core emission, its modeling requires contemporaneous broadband observations. The most complete coverage of the core SED is that of April and May 2003 (Figure 1). We include non-contemporaneous radio and IR data (crosses), given that the amplitude of the core variability does not exceed a factor of amplitude. We also plot the EGRET upper limit (Sreekumar et al., 1996), with the gray band reaching up to a flux 4 times larger than the detection limit, as expected when the IC seed photons are the source’s synchrotron photons: a change in the electron injection results respectively in linear and quadratic changes of the synchrotron and IC fluxes.
The synchrotron peak between Hz corresponds to a cooling break rather that to a cutoff of the electron energy distribution (EED), because this component exhibits a power-law shape that extends to X-ray energies (e.g. Marshall et al. 2002). This can be seen in the 2003 spectral data (Perlman et al., 2003; Harris et al., 2003). The decrease in the synchrotron SED from April to May 2003 must be accompanied by a quadratic decrease in the IC SED. If there was no synchrotron contribution in the X-rays, the X-ray spectral slope should have remained constant, with only a reduction of the X-ray flux. However, the X-ray slope steepens, suggesting a significant synchrotron contribution in the low state. Note that an extrapolation of the two higher energy fluxes (1.4 and 4.0 KeV) down to 0.5 KeV overproduces the 0.5 KeV flux in both April and May 2003. This may be due to an intrinsic absorption component (Perlman & Wilson, 2005).
The SED of the core of M87, together with the FR I - BL unification (Urry & Padovani 1995) argue against a homogeneous model for the core. The synchrotron SED of TeV BLs is characterized by a spectral break at Hz, with the SED still increasing above this break, to reach its peak at Hz, beyond which it exhibits a cutoff (e.g. the 1997 flare of MKN 501, Krawczynski et al. 2000). This is in strong contrast with the declining IR – optical – X-ray SED of the core of M87. Because relativistic motion preserves the SED shape, simply shifting it along the frequency and luminosity axes, a simple boosting cannot shift the SED of the core of M87 into the mold of the SED of the TeV BLs.
Even if M87 is a special case that, if aligned, does not resemble the TeV BL Lacs, we still need to reproduce its SED. This turns out to be practically impossible for the homogeneous model. To sketch why this is the case, we will make use of four quantities derived or constrained by observations: the synchrotron peak frequency Hz, the synchrotron peak luminosity erg s-1 , the Compton dominance (ratio of IC to synchrotron luminosity) , and the variability timescale month. The bolometric synchrotron luminosity is , where and is the index of the injected power law electron distribution. If is the Lorentz factor where the cooling time equals the escape time, , where is the magnetic field and is the radius of the source, and , where is the usual Doppler factor. Noting that , where is the synchrotron photon energy density and is the magnetic field energy density, we have . Using these expressions for and , together with , we obtain and . The last expression permits only a very narrow range , even after allowing for a generous range in the SED-derived parameters. Using the above and noting that the peak of the synchrotron self Compton (SSC) component is at a frequency , we obtain
| (1) |
where , , and is the variability timescale in months. For a SED – derived set of parameters (, , for required by spectral fitting), the SSC component cannot peak at Hz, even for Hz.
While at the emission is in the Thomson regime, due to the reduced Klein-Nishina cross-section the SSC luminosity at higher frequencies drops much faster, (Georganopoulos et al., in prep), than anticipated in the Thomson case, . Because of this steeper SED at the upper end of the SSC component and the upper limit on (see Eq. (1) above), homogeneous models fail to match the observed TeV flux. A typical example of this is shown in Figure 1, where we plot the SED for two different jet powers. Note how in the low state the stronger reduction of the SSC SED results in a steeper X-ray spectrum, in agreement with the observations.
3.1 Decelerating flow and Upstream Compton scattering
It has been noted (Georganopoulos & Kazanas 2003b, GK03b) that homogeneous models can fit the SED of TeV BLs only by invoking very high Doppler factors (; e.g. Krawczynski, Coppi, & Aharonian 2002). Similarly fast flows (Perlman et al. 2003) are required by homogeneous models if one wants to relate the M87 variability timescale ( month) with those of TeV blazars ( few hours). These values are in strong disagreement with the BL – FR I unification, because they severely underpredict the observed FR I luminosities and overpredict their number counts (Chiaberge et al., 2000; Trussoni et al., 2003). They also conflict with the slow apparent motions () in the pc-scale jets of TeV BLs (Marscher, 1999; Piner & Edwards, 2004, 2005). This motivated GK03b to propose that TeV BL jets decelerate at sub-pc scales from an initial Lorentz factor down to few. In such flows, electrons are more energetic in the faster base of the flow and are radiatively cooled to lower energies as they advect downstream where the jet decelerates. Beaming, hence, is frequency dependent. In addition to this, upstream Compton (UC) scattering, a newly identified mechanism (Georganopoulos & Kazanas, 2003a) in which the energetic electrons of the upstream fast flow ’see’ the seed photon field produced by the lower energy electrons of the slower downstream flow boosted, increases the level and beaming of high energy Compton emission.
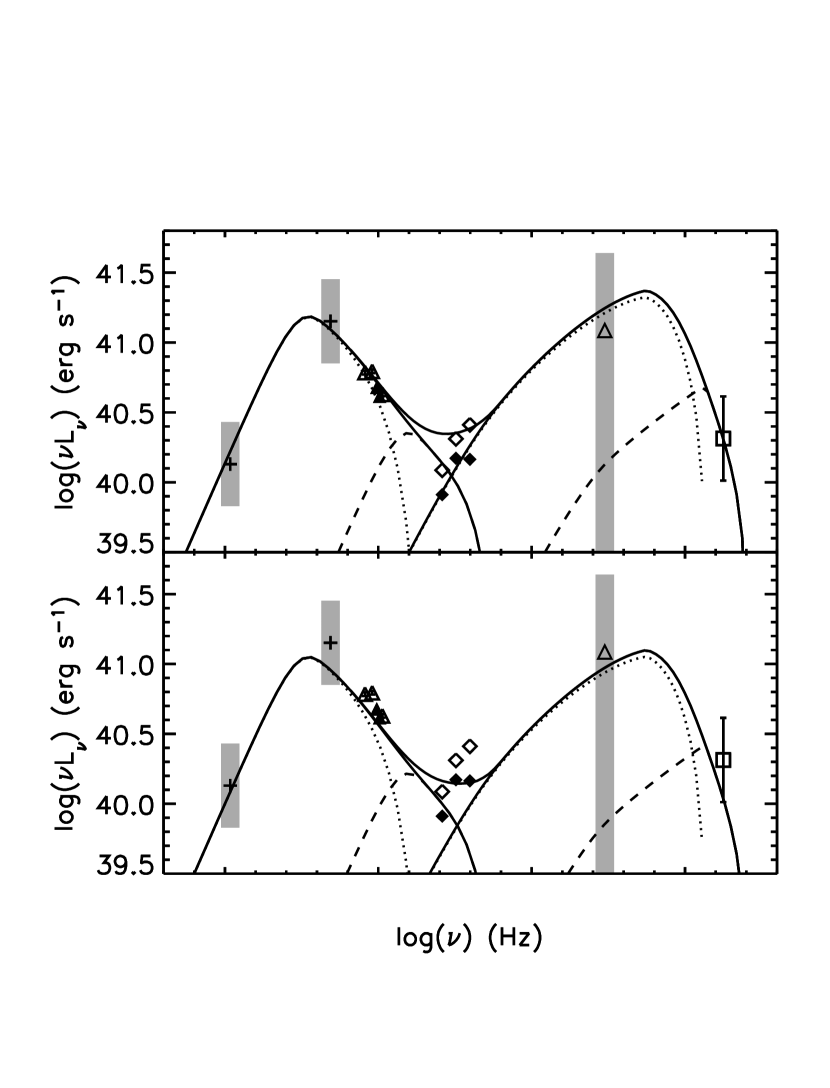
We apply this model to the core of M87, assuming a deceleration from to over a distance of cm. We plot the SED as seen at an angle for two different jet luminosities in Figure 2. In both cases most of the observed power comes from the slower part of the flow (dotted lines), although the TeV flux is UC emission from the fast base of the flow (broken lines). Note that, as in homogeneous models, a decrease of the jet luminosity (lower panel) results in a steeper - when lower X-ray SED, in agreement with observations.
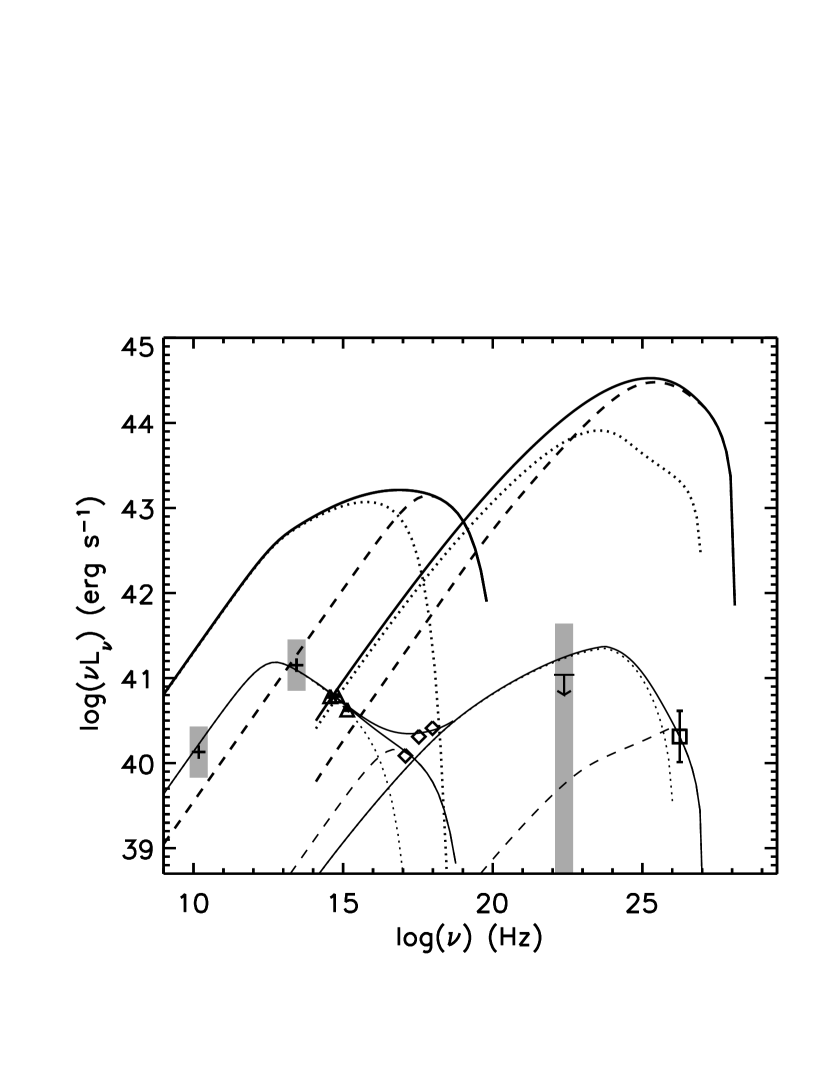
To check if, in addition to reproducing the SED, this model can reproduce the qualitative characteristics of TeV BLs, we plot in Figure 3 in thick lines the same SED viewed at (for comparison we re-plot in thin lines the SED viewed at ). While at , Hz corresponds to the EED cooling break, at the increased beaming in the fast base of the flow dominates the high energy emission, resulting in Hz. The IC flux increases more than the synchrotron, due mostly to UC emission from the fast base of the flow, resulting in a Compton dominance , comparable to that of 1ES 1426+428, the most Compton dominated TeV BL (Costamante et al. 2003).
4 Discussion
The 1998/99 TeV flux of M87 is higher than the 2003/04 flux by over a factor 3 at significance (Beilicke et al. 2005). Based on this and on optical and X-ray variability constraints, we argued that the source of the TeV emission of M87 is its core, as has been previously predicted both in the context of leptonic (Bai & Lee, 2001) and hadronic models (Protheroe, Donea, & Reimer, 2003). We excluded knot A because of its large size and weak or absent variability, and HST 1 because its optical and X-ray flux increased, while the TeV (HESS) flux remained constant or slightly decreased between 2003 and 2004. TeV emission from either the extended jet of M87 (Stawarz et al., 2004) or from hadronic processes in the giant elliptical galaxy itself (Pfrommer & Enßlin, 2003) also do not agree with the observed TeV variability. Stawarz et al. (2005) used the fact that the TeV emission varies to set an upper limit on the actual TeV emission of knot A (lower that the lowest TeV flux observed), and, through this, a lower limit on its magnetic field.
A homogeneous core model is not favored, because it cannot reproduce the core SED and is inconsistent with the unified scheme. A decelerating relativistic flow (GK03b) satisfies both the SED modeling and unification requirements. This is in contrast to both Cen A and NGC 6251, that have be modeled as homogeneous sources (Chiaberge, Capetti, & Celotti, 2001; Chiaberge et al., 2003). Neither of these sources is superluminal, suggesting a jet inclination larger than that of M87 and, in the context of a decelerating flow, a SED dominated by the slower part of the jet. Since this is characterized by small velocity gradients, their SEDs can be accommodated by homogeneous models. An orientation difference also explains the lack of TeV emission from these sources: their TeV emission is more tightly beamed along the jet axis and points away from our line of sight.
The postulated deceleration could be due to entrainment of external matter (e.g. Bowman, Leahy, & Komissarov 1996) or Compton drag (e.g. Melia & Königl 1989) on a photon field external to the high energy emitting jet, such as in the fast spine – slow sheath model of Ghisellini, Tavecchio, & Chiaberge (2005). Both longitudinal (GK03b) and lateral (Ghisellini et al. 2005) velocity gradients can be present and quantifying their importance will require detailed variability modeling. We note that arguments for further deceleration have been presented for FR I jets at Kpc scales (Laing & Bridle, 2002), and for powerful FR II and quasars jets at ’s of Kpc (Georganopoulos & Kazanas, 2004).
We end with a cautionary note: if M87 were at a distance similar to that of TeV BLs, the core and knot HST-1 would be seen as a single unresolved source in both optical and X-ray energies. Modeling the broadband SED as being produced at a single site could then result to unrealistic jet descriptions.
References
- Aharonian et al. (2003) Aharonian, F. A., et al. 2003, A&A, 401, L1
- Aharonian et al. (2005) Aharonian, F. A., et al. 2005, A&A, 430, 865
- Bai & Lee (2001) Bai, J. M. & Lee, M. G. 2001, ApJ, 549, L173
- Beilicke et al. (2005) Beilicke, M., et al. for the H. E. S. S. Collaboration, 2005, presented in the XXII Texas Symposium on Relativistic Astrophysics, Stanford Univ., also in astro-ph/0504395
- Biretta, Stern, & Harris (1991) Biretta, J. A., Stern, C. P., & Harris, D. E. 1991, AJ, 101, 1632
- Biretta, Zhou, & Owen (1995) Biretta, J. A., Zhou, F., & Owen, F. N. 1995, ApJ, 447, 582
- Biretta, Sparks, & Macchetto (1999) Biretta, J. A., Sparks, W. B., & Macchetto, F. 1999, ApJ, 520, 621
- Bowman, Leahy, & Komissarov (1996) Bowman, M., Leahy, J. P., & Komissarov, S. S. 1996, MNRAS, 279, 899
- Chiaberge et al. (2000) Chiaberge, M., Celotti, A., Capetti, A., & Ghisellini, G. 2000, A&A, 358, 104
- Chiaberge, Capetti, & Celotti (2001) Chiaberge, M., Capetti, A., & Celotti, A. 2001, MNRAS, 324, L33
- Chiaberge et al. (2003) Chiaberge, M., Gilli, R., Capetti, A., & Macchetto, F. D. 2001, MNRAS, 324, L33
- Costamante et al. (2003) Costamante, L. Aharonian, F. A., Ghisellini, G., & Horns, D. 2003, NewAR, 47, 677
- Fanaroff & Riley (1974) Fanaroff, B. L. & Riley, J. M. 1974, MNRAS, 176, 31
- Foschini et al. (2005) Foschini, L. et al. 2005, A&A, 433, 515
- Georganopoulos & Kazanas (2003a) Georganopoulos, M. & Kazanas, D. 2003a, ApJ, 589, L5 [GK03b]
- Georganopoulos & Kazanas (2003b) Georganopoulos, M. & Kazanas, D. 2003b, ApJ, 594, L27
- Georganopoulos & Kazanas (2004) Georganopoulos, M. & Kazanas, D. 2004, ApJ, 604, L81
- Ghisellini, Tavecchio,& Chiaberge (2005) Ghisellini, G., Tavecchio, F., & Chiaberge, M. 2005, A&A, 432, 401
- Harris, Biretta, & Junor (1999) Harris, D. E., Biretta, J. A., & Junor, W. 1999, Lecture notes in physics, 530, 319
- Harris et al. (2003) Harris, D. E., Biretta, J. A., Junor, W., Perlman, E. S., Sparks, W. B., & Wilson, A. S. 2003, ApJ, 586, L41
- Harris et al. (2005) Harris, D. E., et al., ApJ, submitted
- Hartman et al. (1999) Hartman, R. C. et al. 1999, ApJS, 123, 79
- Krawczynski et al. (2000) Krawczynski, H., Coppi, P. S., Maccarone, T.,& Aharonian, F. A. 2000, A&A, 353, 97
- Krawczynski et al. (2002) Krawczynski, H., Coppi, P. S.,& Aharonian, F. A. 2002, MNRAS, 336, 721
- Laing & Bridle (2002) Laing, R. A. & Bridle, A. H. 2002, MNRAS, 336, 1161
- Marscher (1999) Marscher, A. P. 1999, Astrop. Phys., 11, 19
- Marshall et al. (2002) Marshall, H. L., Miller, B. P., Davis, D. S., Perlman, E. S., Wise, M., Canizares, C. R., & Harris, D. E. 2002 AJ, 564, 683
- Melia & Königl (1989) Melia, F. & Königl, A. 1989, ApJ, 340, 16
- Mukherjee et al. (2002) Mukherjee, R., Halpern, J., Mirabal, N., & Gotthelf, E. V. 2002, ApJ, 574, 693
- Piner & Edwards (2004) Piner, B. G.& Edwards, P. G. 2004, ApJ, 600, 115
- Piner & Edwards (2005) Piner, B. G.& Edwards, P. G. 2005, ApJ, 622, 168
- Perlman et al. (1999) Perlman, E. S., Biretta, J. A., Zhou, F., Sparks, W. B., & Macchetto, F., D. 1999, AJ, 117, 2185
- Perlman et al. (2001) Perlman, E. S., Sparks, W. B., Radomski, J., Packham, C., Fisher, R. S., Piña, R., & Biretta, J. A. 2001, ApJ, 561, L51
- Perlman et al. (2003) Perlman, E. S., Harris, D. E., Biretta, J. A., Sparks, W. B., & Macchetto, F. D. 2003, ApJ, 599, L68
- Perlman & Wilson (2005) Perlman, E. S. & Wilson, A. S. 2005, ApJ, 627, 140
- Pfrommer & Enßlin (2003) Pfrommer, C. & Enßlin, T. A. 2003, A&A, 407, L73
- Protheroe, Donea, & Reimer (2003) Protheroe, R. J. , Donea, A.-C., & Reimer, A. 2003, Astroparticle Physics, 19, 559
- Sparks, Biretta, & Macchetto (1996) Sparks, W. B., Biretta, J. A., & Macchetto, F. 1996, ApJ, 473,254
- Sreekumar et al. (1996) Sreekumar, P., et al. 1996, ApJ, 464, 628
- Sreekumar et al. (1999) Sreekumar, P., et al. 1999, Astroparticle Physics, 11, 221
- Stawarz et al. (2004) Stawarz, Ł., Sikora, M., Ostrowski, M., & Begelman, M. C. 2004, ApJ, 608, 95
- Stawarz et al. (2005) Stawarz, Ł., Siemiginowska, A., Ostrowski, M., & Sikora, M. 2005, ApJ, 626, 120
- Takahashi et al (1996) Takahashi, T. et al. 1996, ApJ, 470, L89
- Tsvetanov et al. (1998) Tsvetanov, Z. I. et al. 1998, ApJ, 493, L83
- Trussoni et al. (2003) Trussoni, E., Capetti, A., Celotti, A., Chiaberge, M. & Feretti, L. 2003, A&A, 403, 889
- Urry & Padovani (1995) Urry, C. M. & Padovani, P. 1995, PASP, 107, 803
- Wilson & Yang (2002) Wilson, A. S. & Yang, Y. 2002, ApJ, 568, 133