GEMS Survey Data and Catalog
Abstract
We describe the data reduction and object cataloging for the GEMS survey, a large-area (800 arcmin2) two-band (F606W and F850LP) imaging survey with the Advanced Camera for Surveys on HST, centered on the Chandra Deep Field South.
1 Introduction
GEMS (Galaxy Evolution from Morphologies and SEDs) is a large cycle-11 Hubble Space Telescope (HST) program aimed at mapping the evolution of the galaxy population through the combination of a large Advanced Camera for Surveys (ACS) imaging mosaic with ground-based information from COMBO-17 (Wolf et al. , 2003). Rix et al. (2004) gave an overview, and many new results have already been obtained on red-sequence galaxies (Bell et al. , 2004; McIntosh et al. , 2005; Bell et al. , 2005b), active galaxies (Jahnke et al. , 2004; Sánchez et al. , 2004), bar and disk size evolution (Jogee et al. , 2004; Barden et al. , 2005), cosmological weak lensing (Heymans et al. , 2005), and the cosmic evolution of ultraviolet luminosity density and star formation rate (Wolf et al. , 2005; Bell et al. , 2005a). In this paper, we describe in more detail the GEMS data reduction and master catalog. The observations and data reduction steps, including the limiting magnitude achieved, are discussed in §2,3. The detection and cataloging of objects, and the correlation of the GEMS source catalog with the COMBO-17 survey catalog are described in §4. In §5, we summarize how and where the GEMS data products can be accessed.
2 Observations
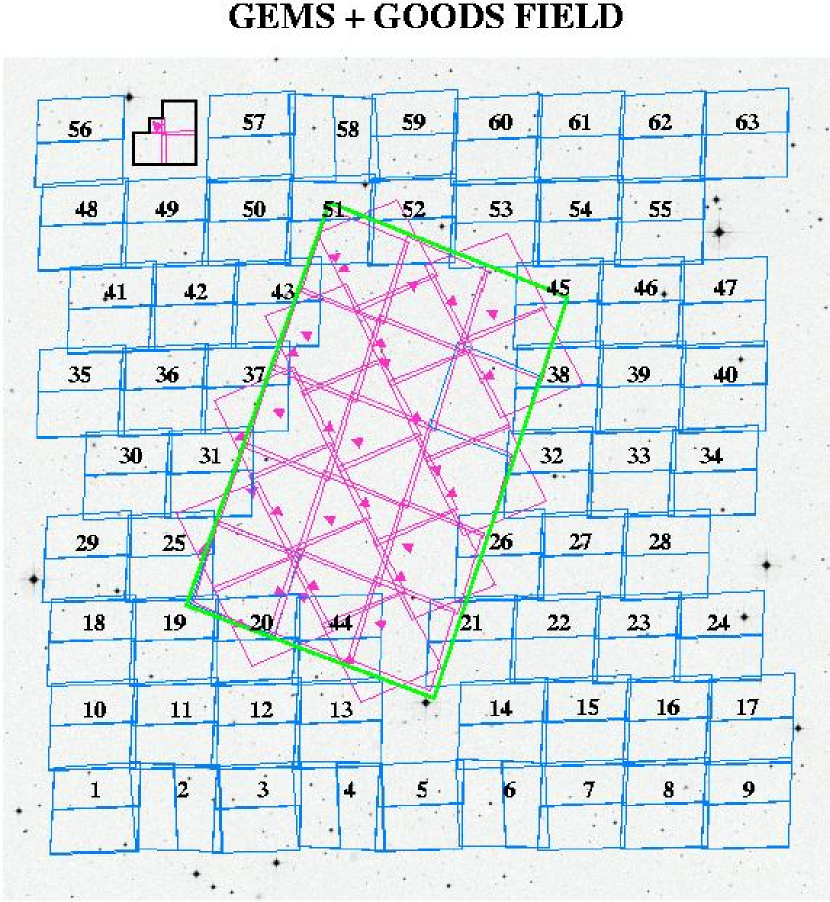
The GEMS collaboration was granted 125 orbits HST time during cycle 11 (GO-9500, PI: Rix) to image a large area centered on the Extended Chandra Deep Field South (E-CDFS; =03h32m25s,) using the ACS Wide-field Camera (WFC). We constructed a tiling scheme (cf. Figure 1) to obtain coverage of the E-CDFS region, which had already been surveyed for rest-frame optical magnitudes and photometric redshifts by COMBO-17 [“Classifying Objects by Medium-Band Observations in 17 Filters” – (Wolf et al. , 2003)].
The WFC (Ford et al. , 2003) consists of a pair of pixel ccd detectors separated by a 50 pixel gap. The pixels are , and the plate scale is pxl-1 for an overall extent of . The gain was set at 1 count per electron, and the a/d saturation level was 65536 counts. By virtue of the off-axis, few-element optical design, affording large area and high throughput, the detector pixel grid projects to a rhomboidally-distorted grid pattern on the sky, in which the pixel size varies by a maximum of in a fixed pattern. During data reduction, this geometric distortion is removed from the detector image to recover the true sky image.
The GEMS observations consisted of imaging in the F606W and F850LP passbands, hereafter referred to as and . Each HST visit consisted of three separate 12-13 min exposures each for and for , dithered by or pxl in a three-fold linear spacing which bridges the inter-chip gap of 50 pxl, and affords some sub-pixel sampling of the sky. In most visits the first orbit observed and the second one . The total exposure times were usually for and for , respectively, with the increase reflecting the rapid re-acquisition possible in the second of two related orbits. A few observations obtained at a different spacecraft orientation (tiles 4, 6, 58) yielded integration times of for and for instead.
Contemporarily with the GEMS observing, the GOODS Project (Giavalisco et al. , 2004) was observing their earliest of five data epochs, which also used the and passbands. Figure 1 illustrates the GOODS and COMBO-17 survey areas in relation to GEMS. The tiling pattern of the GEMS mosaic was designed to (a) encompass the 15-tile first epoch GOODS data, (b) create a large contiguous imaging field, and (c) avoid four extremely bright stars that would risk charge bleeding and widely scattered light on the detector. While GEMS-plus-GOODS corresponds to effectively tiles, the central and bright star gaps result in a net of 63 GEMS tile locations, numbered as shown in Figure 1.
The calendar of GEMS data acquisition was as follows. First observed were tiles number 6 and 58 in September 2002, with “orientat” (viz. the y-axis direction on the resultant images) pointing nearly west (). The bulk of the observations, all but four, were obtained in November 2002 with “orientat” nearly north (). Lastly, tiles number 2 and 4 were observed in February 2003 with “orientat” nearly east (). The divergent orientations were dictated by guide star availability.
The tiles were chosen with an average overlap of or pxl, which resulted in a total data area (including GOODS) amounting to (796 sqr-arcmin, or of the COMBO-17 coverage – see §4.2). The guiding stability is quantified by the r.m.s. guide star pointing corrections along the two orthogonal symmetry axes of the spacecraft, referred to as the V2 and V3 directions. These “guiding jitter” parameters were in the mean 3.6 and 4.7 mas, for V2rms and V3rms respectively, with a std.dev. over all the exposures of 1.1 and 1.0 mas. This is excellent in relation to the pixel size of 50 mas. Note that one tile (chosen to be 44) could have only single-band data, due to the odd number of orbits. The execution of the observations encountered no difficulties and achieved uniformly excellent images.
3 Data Reduction
The data were processed in two reduction versions: markI, to provide scientific-quality data as quickly as possible, and markII, to capitalize on any potential improvements enabled later on.
3.1 MarkI Reduction
The calibration of instrumental effects was done by the CALACS “on the fly” pipeline (Pavlovsky et al. , 2003) as part of the data delivery from the MAST (“Multimission Archive at Space Telescope”) online service. The CALACS processing subtracts the overscan bias levels, the superbias image (produced from seven days’ intake of bias frames), and the time-scaled superdark image (produced from one day’s intake of dark frames), and then divides by the flatfield (calibrated by cluster aperture photometry done in orbit). The “super” frames achieve higher statistical accuracy by combining many measurements, yet secular changes in the detectors, mostly from radiation damage, and practicality dictate a maximum useful time base. Finally, the gain is corrected to precisely unity, and the FITS header photometry keyword values are inserted. In the markI reduction, the data were requested during August 2002 - February 2003, which invoked the version 4.1 of CALACS; the August - October 2003 markII reduction invoked version 4.3.
To remove the geometric distortion, all the exposures for a given tile and filter were drizzled (Fruchter & Hook, 2002) onto a celestial pixel grid centered on the middle step of the three-dither pattern for each pointing, using a version of the multidrizzle software (Koekemoer et al. , 2003). In its basic function, the multidrizzle task flags bad detector pixels, subtracts the sky level, drizzles the flux from the detector grid onto the celestial grid, and then intercompares the result from the separate frames so as to flag cosmic rays and other transients and find the relative astrometric corrections to the nominal pointings. Unweighting all pixels flagged as invalid, and adding the small astrometric corrections to the nominal pointings, multidrizzle finally combines the input frames onto an output image of the weighted average (over only valid input pixels) counts per second at each output pixel, which we call the science frame (or tile). A corresponding weight image is also produced, namely the effective exposure time contributing at each output pixel. The adopted weighting scheme disregards the weighting effect from the amplitude structure of the flatfields and from the inter-frame variations in sky level, which were judged to be a second order refinement. Both the registration and the flagging of invalid pixels can be iterated, working backward from (i.e. re-distorting, also referred to as blotting back) the existing best picture version. The output image scale was chosen to be pxl-1.
Cosmetic blemishes such as reflection ghosts, diffraction or scattering streaks, or cross-talk dips were left in the images. These defects had a sufficiently limited extent as to have negligible impact on the scientific usefulness of the images. The successful removal of cosmic rays by multidrizzle, without falsely flagging the centers of real objects, was checked visually. Its success was facilitated by the property that the data to be combined were always obtained within a single visit, resulting in very consistent exposure guiding. Thus, the estimated pointing coordinates as stored in the image headers were at least internally quite consistent between different dithers, although a modest external correction was needed (cf. §3.3). A few faint asteroid trails are evident in the science output and weight images for the tiles 29 and 15 and 48. They stand out clearly in the weight image if the multidrizzle software recognized them as transient flux (in effect a long cosmic ray), but they stand out instead in the science image when they were so weak as to remain unrecognzied by multidrizzle. Pixels that were saturated in the input frames were masked and thus contribute no weight to the final combined result.
The first epoch GOODS data on the Chandra Deep Field South (CDFS), consisting of a rectangle of 15 tile positions (cf. Fig. 1) at the center of the GEMS array, was analyzed identically with the markI reduction of GEMS. The main differences were that the GOODS data comprised two dither positions at each tile for a total exposure time of , and the GOODS data comprised four dither positions at each tile, for a total exposure time of . Other than distinctions due to scaling from the somewhat different GOODS exposure times, the first epoch GOODS data were treated completely interchangeably with the GEMS data, and will be included as an integral part of them for the rest of the paper.
3.2 MarkII Reduction
During the time interval between the markI and markII reductions, because of upgrades to site-installed software packages, the working version of multidrizzle had evolved. In addition, we made several changes in our working version of the software and in the configuration parameters which control the reduction, based on features in markI that we thought could be improved upon, although the changes turned out to be mostly of a minor or cosmetic nature, and do not imply any lesser scientific usefulness of the markI quantitative results. For example, satellite trails, being transients, had been flagged by multidrizzle in markI but their trail-edge wisps survived this cleaning procedure. In markII the program satmask (Richard Hook, priv. comm.) was used to pre-excise the entire trail-affected locus before processing.
The effect of large bright objects upon the sky subtraction and occasionally also upon the calculated overscan level, was occasionally noted in markI by some small artificial steps in the calculated sky-subtracted zero level across the ccd amplifier quadrant boundaries. By experiment we adopted a better tuning of the sky level, 0.6(mode) + 0.4(median) over an entire chip (combining the quadrants having proved more robust). That still left three of the tiles with a serious zero level step which was rectified by re-requesting them under CALACS 4.4. This last CALACS version had been changed to remove the earlier vulnerability to extremely bright objects fortuitously near the ccd chip boundary, which were corrupting the nearby overscan region counts. The few markII frames needing that one feature from version 4.4 are otherwise homogeneous with the bulk requested under version 4.3, since the innovations in 4.4 do not change in any way the resulting calibrated WFC science array data.
One further innovation in the markII calibration was that CALACS now removed the differential scale effect due to the changing velocity aberration between exposures. Stacking exposures with the differential scale effect could cause an effective radial blurring (in markI relative to markII), but the 0.04 pxl maximum size of the effect for our data is negligible.
Finally, the drizzling kernel in markII was the lanczos (damped sync function) (Sparks et al. , 2002), which suppresses one feature of the correlated noise which results from drizzling, namely the moiré pattern in the noise amplitude, that can be seen for example in the markI background level; markI used the square drizzling kernel (pixfrac 0.8) which was available at the time. Therefore the noise pattern in markII is smoother, but the noise remains correlated due effectively to an irreducible amount of angular averaging that is inherent in drizzling. Because of the sensitivity of lanczos algorithm to strong flux gradients, some purely cosmetic artifacts appeared only in markII at the centers of extremely saturated stars. The lanczos kernel furthermore does not behave well when operating on adjacent pixels with missing data. We are planning to re-evaluate the choice of kernel and release the markII reduction publicly only with the best choice.
3.3 Astrometric Registration
The astrometry of each image tile was tied to the overall catalog from the ground-based COMBO-17 R-band image (Wolf et al. , 2001) using the wcsfix program (Richard Hook, priv. comm.). This relies on least-squares optimization of the position, orientation, scale, and axis skew of each tile based on the catalog of objects found by Sextractor (Bertin & Arnouts, 1996); it is basically identical to the registration checking of the different dithers within the multidrizzle program described above. The frames had a median of 164 objects bearing on the astrometric registration, with an and registration std.err. of the mean of 0.21 and 0.20 pxl (at pxl-1). The frames had a median of 89 useful objects with an and registration std.err. of the mean of 0.24 and 0.25 pxl, respectively. The median absolute value size of the shifts needed to correct the instrument pointing reported in the observation header, was 55 pxl or in x, 18 pxl or in y, and of rotation.
Both filters of each GEMS tile are thus tied to the COMBO-17 frame independently, with an relative uncertainty of typically 0.2 pxl. The absolute astrometric uncertainty is that of COMBO-17. To improve the source color distribution accuracy for proposed applications, a second version of the V-band frames was generated by micro-registering with the IRAF imshift command and the SExtractored object position lists, to eliminate the very small remaining picture shift with respect to the -band picture. This entailed an -shift with a uncertainty on the order of 0.02-0.03 pxl at the 0.03 pxl-1 scale. The effective precision of the registration was 0.0245 pixels or 0.735 mas in the median.
3.4 Limiting Magnitude
Because the noise-correlation in the markII-reduced data was more spatially uniform, these were used to gauge the limiting magnitude of GEMS. The edge zone (not covered by all three dithers) was pared off and only the lower 90 of the data values were used (thus eliminating all objects including outer haloes). Then the scatter per point was determined and adjusted upwards appropriately for the lower 90 of a normal distribution. This results in a conservatively high estimate of the scatter, but one unaffected by objects. The 3 3 input pixels (5 5 output pixels) limiting magnitude was then calculated for each tile. A correction of -0.80 magnitude was added to account for noise correlation based on Casertano et al. (2000) equation (A13). The results in Fig. 2 are consistent with a uniform AB limiting magnitude (5, point sources) of = 28.53 and = 27.27, except for a few tiles with slightly more scatter. Tile 56 is affected by a very prominent scattered light swath from its northwestern bright star. The other “hotter” tiles, 2, 4, and 40 may be showing the effect of a small bias subtraction jump between quadrants. The range in the limiting magnitude estimates is quite small. Further analyses for galaxy fitting, QSO host extraction, bar visibilty, etc. will need to make more detailed limiting magnitude simulations appropriate for their statistical distribution of object shapes and sizes.
4 Source Catalog
The science goals of GEMS have relied on an empirical database of structural and morphological properties for a large and complete sample of distant galaxies for which redshifts and rest-frame quantities exist from COMBO-17. Therefore, the initial fundamental steps were the cataloging of GEMS source detections from the HST imaging, and matching these to their counterparts in the COMBO-17 catalog.
4.1 Object Detection
Object detection and cataloging were carried out automatically on the GEMS astrometrically calibrated tiles with the SExtractor V2.2.2 software (Bertin & Arnouts, 1996). SExtractor identifies sources and provides their image position, celestial coordinates, projected geometry, and flux parameters, down to a completeness cutoff that is as uniform as possible over the area. Moreover, SExtractor produces a segmentation map that parses the image pixels into those belonging to the extracted sources and the background sky, which is necessary for fitting galaxy surface brightness profiles with codes such as GALFIT (Peng et al. , 2002) and GIM2D (Simard et al. , 2002). We have chosen the scale z-band images to be the cataloging basis from consideration of the science goals. Before running SExtractor, the science images were converted from counts-per-second to counts, which are related to AB magnitudes via our adopted zero points ZP[] = 26.50482 and ZP[] = 24.84068. The conversion to counts is required for the correct SExtractor calculation of magnitude errors.
The use of SExtractor in effect defines the extracted sources; thus, the configuration file must be carefully tuned for the data set at hand to mininize both crediting noise as spurious objects, and rejecting believable objects. As it is common for objects to appear conjoined on the sky due to projection, further tuning of the configuration file is vital to avoid both the splitting (or “over-deblending”) of essentially whole objects into pieces, and the lumping together (blending) of different objects into spurious pseudo-objects. These considerations are controlled by four configuration parameters: (1) DETECT_THRESH, the detecting threshold above background; (2) DETECT_MINAREA, the minimum number of connected pixels above threshold; (3) DEBLEND_MINCONT, the minimum flux/peak contrast ratio to deblend separate sources; and (4) DEBLEND_NTHRESH, the number of deblending threshold steps.
The primary requirement of our SExtracting was to recover all mag galaxies from COMBO-17 with the same spatial coverage. Fainter than this -band aperture magnitude limit, COMBO-17 photometric redshifts become increasingly unreliable. Even with our well-defined source detection requirement, we have found that the large dynamic range of real objects occurring in the data makes it difficult to find any single configuration parameter set that gives a really satisfactory deblending outcome. This is especially so in the present case where the long-exposure ground-based images have reached low-surface brightness objects, and we are trying to find a match with space-based images that go especially deep for objects of relatively much smaller angular extent. To pick up the of mag galaxies in COMBO-17 with the lowest surface brightness, the GEMS SExtractor detection threshold would need to be made so sensitive as to trigger many spurious object detections on substructural features within, and noise bumps in the outskirts of, bright objects (viz. “over-deblending”). Fortunately, as illustrated in Rix et al. (2004), we found that a two-pass strategy for object detection and deblending, using separate “cold” and “hot” SExtractor configurations, met our catalog requirements.
Given the size of the data set, it was essential that any deblending method be fully automatic. With this in mind, extensive tests to determine a combination of two detection configurations, which would maximize the number of mag galaxies while minimizing the amount of overdeblending, were carried out independently by DHM and MB. Using five representative frames containing 837 galaxies, a conservative cold configuration (DETECT_THRESH, DETECT_MINAREA, DEBLEND_MINCONT, and DEBLEND_NTHRESH) identified the high-surface brightness objects with negligible overdeblending, and a hot version (DETECT_THRESH, DETECT_MINAREA, DEBLEND_MINCONT, and DEBLEND_NTHRESH) then extracted the remaining faint low-surface brightness sources. All objects found in the hot run that overlapped the isophotal area of pre-existing cold run objects, were automatically discounted. For both configurations a weight map () and a three-pixel (FWHM) top-hat filtering kernel were used. The former suppresses spurious detections on low-weight pixels, and the latter discriminates against noise peaks, which statistically have smaller extent than real sources as convolved by the instrumental PSF. The final optimal configurations successfully detected 98.9% (828/837) of the COMBO-17 galaxies with reliable deblending for 98.1%.
In addition to the detection parameters, the SExtractor configuration file includes two parameters used for a global estimate of the background sky level over a full image. A detailed explanation is provided in Bertin & Arnouts (1996). Briefly, SExtractor constructs a background map by splitting the image into a grid of background meshes of a given width (BACK_SIZE in pixels), applies a median filter of a given size (BACK_FILTERSIZE in pixels) to suppress possible local overestimates, iteratively clips the background histogram until it converges to within of its median value, and calculates the following mode:
| (1) |
Tests showed that using BACK_SIZE and BACK_FILTERSIZE on GEMS images provided a reasonable sky level estimation. The global background level and the r.m.s. pixel-to-pixel noise are given for each frame in Table 1.
Our final catalog contains 41,681 uniformly and automatically identified GEMS -band sources, from 18,528 objects detected in the cold run, augmented by 23,153 “good” objects found in the hot run (after rejection of the unwanted hot extensions to the pre-identified cold objects, described above). The breakdown of cold, hot, and good sources per ACS frame is given in Table 1. The choice to analyze on a tile-by-tile basis, rather than mosaic-wise, resulted in 4991 sources detected in multiple overlapping tiles as a result of their location near image boundaries. The most interior-located was selected for entry into the catalog.
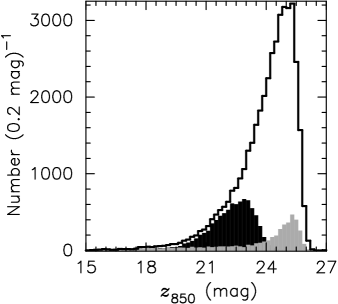
The choice of as the primary detection bandpass for cataloging followed from the importance of the morphology in the reddest bandpass for the science objectives. For some applications, e.g. weak lensing (Heymans et al. , 2005), we have prepared a -band catalog similarly as described above but with the hot configuration parameters adjusted as follows: (DETECT_THRESH, DETECT_MINAREA). The detectable source density is considerably higher in the images, and the deblending more problematical due to the greater amplitude of substructure towards the blue. Figures 3 and 4 show the number counts of objects detected by GEMS in and , respectively.
4.2 Cross Correlation with COMBO-17
The GEMS source catalog was cross-correlated in object coordinate space with the COMBO-17 source redshift catalog. For each GEMS source, a match was accepted for the nearest galaxy position within . For each tile, we tabulate in Table 1 the total number of mag galaxies, and the mean and r.m.s. angular separation between the coordinate matches. There were 1138 cases of ambiguous matching; i.e. , unique COMBO-17 sources with multiple GEMS detections from overlapping images as described in §4.1. These were visually inspected and the best image detection selected; for 94% of these, the best case was the detection farthest from the image edge. Therefore, our final GEMS and COMBO-17 cross-correlated catalog contains 8565 mag galaxies, which yielded an r.m.s. positional agreement of between the counterparts. Figure 5 shows the good astrometric correspondence between independently assigned COMBO-17 and GEMS object centroids, which is encouraging for the key goal of linking space and ground-based information. This comprises of the 10,056 COMBO-17 sources in the E-CDFS catalog with mag and classified as galaxies. The fraction agrees with the GEMS-to-COMBO area proportion (see §2), a further indication that GEMS has reached the goal of detecting the COMBO-17 sample lying within the GEMS-plus-GOODS 796 arcmin2 footprint.
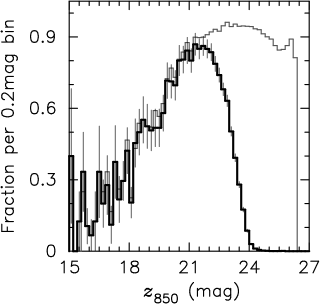
Lastly, Figure 6 compares the relative number of GEMS detections per magnitude bin that were matched to mag COMBO-17 galaxies with all detections that fall into the SExtractor automatic galaxy-like classification (i.e., CLASS_STAR). We stress that we do not use SExtractor for star/galaxy separation. This comparison simply illustrates that statistically all bright extended sources from the GEMS images are matched to COMBO-17 redshifts. The distribution for the 8565 COMBO-17 matches, and for CLASS_STAR sources, are given in Figure 3.
5 Master Catalog and Data Access
We produced a master catalog in FITS table format, which incorporates the GEMS and COMBO-17 information for the 8565 cross-identified objects. This master catalog was used for the GEMS science completed to date (see §1). A small number of objects were found to be excludable from the GEMS science sample due to being e.g. stars (72), too near the survey edge (33), or spoiled by the inter-chip gap (62). These sources are noted in the master catalog.
The GEMS master catalog and GEMS total source catalog will be published electronically. We cite their contents here by (column) for reference. For the total GEMS sources: (1) GEMS sexagesimal coordinate-based name, (2-3) R.A. and Dec. (2000), (4-5) total flux (SExtr. FLUX_BEST) and error, (6-7) total magnitude (SExtr. MAG_BEST) and error, (8) “local” background level, (9) isophotal area (SExtr. ISOAREA_IMAGE), (10-11) image center and coordinates (12) position angle (SExtr. THETA_IMAGE), (13) Ellipticity, (14) image FWHM, (15) SExtractor FLAGS, (16) stellarity parameter (SExtr. CLASS_STAR), (17-18) ACS source and mask image names, (19) exposure time, (20) AB-mag zeropoint, (21) SExtractor Kron aperture radius, (22-24) Cxx Cyy and Cxy SExtractor object ellipse parameters, (25-27) blanks, (28) number of overlapping sources. For the master catalog of sources cross correlated with COMBO-17: (1-20) as above, (21) COMBO-17 redshift (MC_z), (22) angular separation between ACS and COMBO-17 coordinates, (23) COMBO-17 R-band total magnitude (Rmag), (24) number of overlapping sources, (25-26) visual-band image and coordinates, (27) SExtractor Kron aperture radius, (28-30) Cxx Cyy and Cxy SExtractor object ellipse parameters, (31) COMBO-17 object number (Seq), (32) COMBO-17 redshift uncertainty (e_MC_z), (33) COMBO-17 peak of redshift-estimate distribution (MC_z_ml), (34) COMBO-17 (0.3,0.7) luminosity distance (dl), (35-37) COMBO-17 (0.3,0.7) Johnson M_U M_V and M_B VEGA-mags (UjMag VjMag and BjMag), (38) COMBO-17 (0.3,0.7) SDSS M_r (rsMag), (39) COMBO-17 R-band mag uncertainty (e_Rmag), (40-42) COMBO-17 M_U M_V and M_B mag uncertainties (e_UjMag e_VjMag and e_BjMag), (43) COMBO-17 M_r mag uncertainty (e_rsMag), (44) COMBO-17 photometry flag (phot_flag), (45) COMBO-17 aperture Rmag (Ap_Rmag), (46) COMBO-17 R-band central surface brightness (mu_max), and (47) notes.
The MAST archive at the Space Telescope Science Institute makes the GEMS data products easily available via anonymous ftp; see the instructions at archive.stsci.edu/prepds/gems. The GEMS calibrated data so far stored at the MAST comprise the GEMS markI-reduced science and weight images for both and bands, and also the microregistered version (cf. §3.3) of the science and weight images. The markI-reduced first epoch GOODS science and weight images for both and bands, and the correspondingly microregistered science and weight images are also stored there. A “readme” file provides details on the data files and a data summary table provides an overview of the details specific to each tile, too voluminous to cite here, such as the exposure date and time, celestial pointing coordinates and sky orientation, and the total sky level subtracted from combination of images at each tile location. The even more detailed accounting for the processing steps of each ccd chip is contained in the relevant FITS headers. The GEMS source catalog and the combined GEMS plus COMBO-17 master catalog, and any revised complete reduction (e.g. markII) will also be placed in MAST.
References
- Barden et al. (2005) Barden, M., Rix, H.-W., Somerville, R.S., Bell, E.F., Häußler, B., Peng, C.Y., Borch, A., Beckwith, S.V.W., Caldwell, J.A.R., Heymans, C., Jahnke, K., Jogee, S., McIntosh, D.H., Meisenheimer, K., Sánchez, S.F., Wisotzki, L. & Wolf, C., ApJ, in press.
- Bell et al. (2004) Bell, E.F., McIntosh, D.H., Barden, M., Wolf, C., Caldwell, J.A.R., Rix, H.-W., Beckwith, S.V.W., Borch, A., Häußler, B., Jahnke, K., Jogee, S., Meisenheimer, K., Peng, C.Y., Sánchez, S.F., Somerville R.S. & Wisotzki, L., 2004, ApJ, 600, L11.
- Bell et al. (2005a) Bell, E.F., Papovich, C., Wolf, C., Le Floc’h, E., Caldwell, J.A.R., Barden, M., Egami, E., McIntosh, D.H., Meisenheimer, K., Pérez-González, P.G., Rieke, G.H., Rieke, M.J., Rigby, J.R. & Rix, H.-W., 2005, ApJ, 625, 23.
- Bell et al. (2005b) Bell, E.F., Naab, T., McIntosh, D.H., et al. 2005, ApJ, submitted (astro-ph/0506425).
- Bertin & Arnouts (1996) Bertin, E. & Arnouts, S., 1996, A&AS, 117, 39.
- Casertano et al. (2000) Casertano, S., de Mello, D., Dickinson, M., Ferguson, H.C., Fruchter, A.S., Gonzalez-Lopezlira, R.A., Heyer, I., Hook, R.N., Levay, Z., Lucas, R.A., Mack,J., Makidon, R.B., Mutchler, M., Smith, T.E., Stiavelli, M., Wiggs, M.S. & Williams, R.E., 2000, AJ, 120, 2747.
- Ford et al. (2003) Ford, H.C. & 35 authors, 2003, Proceedings of the SPIE, 4854, 81.
- Fruchter & Hook (2002) Fruchter, A.S. & Hook, R.N., 2002, PASP, 114, 144.
- Giavalisco et al. (2004) Giavalisco, M. & 56 authors, 2004, ApJ, 600, L93.
- Heymans et al. (2005) Heymans, C., Brown, M.L., Barden, M., Caldwell, J.A.R., Jahnke, K., Peng, C.Y., Rix, H.-W., Taylor, A., Beckwith, S.V.W., Bell, E.F., Borch, A., Häußler, B., Jogee, S., McIntosh, D.H., Meisenheimer, K., Sánchez, S.F., Somerville, R.S., Wisotzki, L. & Wolf, C., 2005, MNRAS, 361, 160.
- Jahnke et al. (2004) Jahnke, K., Sánchez, S.F., Wisotzki, L., Barden, M., Beckwith, S.V.W., Bell, E.F., Borch, A., Caldwell, J.A.R., Häußler, B., Heymans, C., Jogee, S., McIntosh, D.H., Meisenheimer, K., Peng, C.Y., Rix, H.-W., Somerville, R.S. & Wolf, 2004, ApJ, 614, 568.
- Jogee et al. (2004) Jogee, S., Barazza, F.D., Rix, H.-W., Shlosman, I., Barden, M., Wolf, C., Davies, J., Heyer, I., Beckwith, S.V.W., Bell, E.F., Borch, A., Caldwell, J.A.R., Conselice, C.J., Dahlen, T., Häußler, B., Heymans, C., Jahnke, K., Knapen, J.H., Laine, S., Lubell, G.M., Mobasher, B., McIntosh, D.H., Meisenheimer, K., Peng, C.Y., Ravindranath, S., Sánchez, S.F., Somerville R.S. & Wisotzki, L., 2004, ApJ, 615, L105.
- Koekemoer et al. (2003) Koekemoer, A.M., Fruchter, A.S., Hook, R.N. & Hack, W.J., 2003, HST Calibration Workshop, 337 (STScI: Baltimore).
- McIntosh et al. (2005) McIntosh, D.H., Bell, E.F., Rix, H.-W., Wolf, C., Heymans, C., Peng, C.Y., Somerville, R.S., Barden, M., Beckwith, S.V.W., Borch, A., Caldwell, J.A.R., Häußler, B., Jahnke, K., Jogee, S., Meisenheimer, K., Sánchez, S.F., & Wisotzki, L., 2005, ApJ, 632, 191.
- Pavlovsky et al. (2003) Pavlovsky, C. et al. , 2003 ACS Instrument Handbook, Version 4.0, (Baltimore: STScI).
- Peng et al. (2002) Peng, C.Y., et al. 2002, AJ, 124, 266.
- Rix et al. (2004) Rix, H.-W., Barden, M., Beckwith, S.V.W., Bell, E.F., Borch, A., Caldwell, J.A.R., Häußler, B., Jahnke, K,. Jogee, S., McIntosh, D.H., Meisenheimer, K., Peng, C.Y., Sánchez, S.F., Somerville, R.S., Wisotzki, L. & Wolf, C., 2004, ApJS, 152, 163.
- Sánchez et al. (2004) Sánchez, S.F., Jahnke, K., Wisotzki, L., McIntosh, D.H., Bell, E.F., Barden, M., Beckwith, S.V.W., Borch, A., Caldwell, J.A.R., Häußler, B., Jogee, S., Meisenheimer, K., Peng, C.Y., Rix, H.-W., Somerville, R.S. & Wolf, C., 2004, ApJ, 614, 586.
- Simard et al. (2002) Simard, L., et al. 2002, ApJS, 142, 1.
- Sparks et al. (2002) Sparks, W.B., Hack, W.J., Hook, R.N. & Koekemoer, A.M., 2002, STScI Instrument Science Report ACS 2002-10.
- Wolf et al. (2001) Wolf, C., Dye, S., Kleinheinrich, M., Meisenheimer, K., Rix, H.-W. & Wisotzki, L., 2001, A&A, 377, 442.
- Wolf et al. (2003) Wolf, C., Meisenheimer, K., Rix, H.-W., Borch, A., Dye, S. & Kleinheinrich, M., 2003, A&A, 401, 73.
- Wolf et al. (2005) Wolf, C., Bell, E.F., McIntosh, D.H., Rix, H.-W., Barden, M., Beckwith, S.V.W., Borch, A., Caldwell, J.A.R., Häußler, B., Heymans, C., Jahnke, K., Jogee, S., Meisenheimer, K., Peng, C.Y., Sánchez, S.F., Somerville, R.S. & Wisotzki, L., 2005, ApJ, 630, 771.


| Tile | bkg | |||||||
|---|---|---|---|---|---|---|---|---|
| (1) | (2) | (3) | (4) | (5) | (6) | (7) | (8) | (9) |
| GOODS 1 | -0.164 | 4.46 | 173 | 419 | 409 | 84 | 0.10 | 0.10 |
| GOODS 2 | -0.155 | 4.48 | 186 | 454 | 446 | 103 | 0.13 | 0.09 |
| GOODS 3 | -0.135 | 4.50 | 199 | 430 | 420 | 117 | 0.13 | 0.12 |
| GOODS 4 | -0.139 | 4.47 | 226 | 516 | 504 | 117 | 0.13 | 0.11 |
| GOODS 5 | -0.161 | 4.50 | 274 | 582 | 563 | 127 | 0.14 | 0.11 |
| GOODS 6 | -0.168 | 4.49 | 194 | 451 | 444 | 115 | 0.12 | 0.11 |
| GOODS 7 | -0.119 | 4.48 | 233 | 507 | 504 | 140 | 0.12 | 0.11 |
| GOODS 8 | -0.101 | 4.46 | 183 | 431 | 421 | 95 | 0.16 | 0.12 |
| GOODS 9 | -0.208 | 4.45 | 246 | 552 | 540 | 134 | 0.15 | 0.11 |
| GOODS 10 | -0.166 | 4.44 | 242 | 593 | 585 | 151 | 0.15 | 0.12 |
| GOODS 11 | -0.113 | 4.48 | 198 | 474 | 461 | 112 | 0.14 | 0.11 |
| GOODS 12 | -0.176 | 4.46 | 231 | 534 | 521 | 127 | 0.13 | 0.12 |
| GOODS 13 | -0.156 | 4.47 | 263 | 562 | 558 | 138 | 0.15 | 0.10 |
| GOODS 14 | -0.206 | 4.45 | 271 | 566 | 560 | 145 | 0.12 | 0.10 |
| GOODS 15 | -0.112 | 4.43 | 249 | 537 | 528 | 136 | 0.11 | 0.12 |
| GEMS 1 | -0.114 | 3.88 | 235 | 590 | 577 | 102 | 0.14 | 0.12 |
| GEMS 2 | -0.169 | 4.28 | 246 | 545 | 536 | 129 | 0.14 | 0.12 |
| GEMS 3 | -0.102 | 3.88 | 312 | 679 | 664 | 141 | 0.13 | 0.12 |
| GEMS 4 | -0.138 | 4.25 | 250 | 595 | 585 | 139 | 0.13 | 0.12 |
| GEMS 5 | -0.075 | 3.90 | 306 | 666 | 639 | 140 | 0.12 | 0.10 |
| GEMS 6 | -0.143 | 4.08 | 290 | 601 | 584 | 151 | 0.12 | 0.10 |
| GEMS 7 | -0.077 | 3.90 | 285 | 628 | 611 | 115 | 0.12 | 0.12 |
| GEMS 8 | -0.172 | 3.92 | 239 | 581 | 558 | 94 | 0.14 | 0.14 |
| GEMS 9 | -0.120 | 3.89 | 271 | 614 | 603 | 122 | 0.13 | 0.11 |
| GEMS 10 | -0.100 | 3.87 | 239 | 543 | 535 | 106 | 0.12 | 0.11 |
| GEMS 11 | -0.113 | 3.83 | 217 | 576 | 570 | 112 | 0.17 | 0.13 |
| GEMS 12 | -0.085 | 3.84 | 255 | 674 | 610 | 106 | 0.12 | 0.08 |
| GEMS 13 | -0.094 | 3.88 | 236 | 586 | 575 | 130 | 0.14 | 0.13 |
| GEMS 14 | -0.079 | 3.92 | 293 | 649 | 631 | 126 | 0.11 | 0.11 |
| GEMS 15 | -0.103 | 3.90 | 282 | 613 | 599 | 123 | 0.11 | 0.10 |
| GEMS 16 | -0.087 | 3.88 | 297 | 647 | 642 | 124 | 0.13 | 0.12 |
| GEMS 17 | -0.152 | 3.87 | 334 | 793 | 768 | 157 | 0.10 | 0.10 |
| GEMS 18 | -0.132 | 3.86 | 252 | 639 | 628 | 110 | 0.13 | 0.10 |
| GEMS 19 | -0.091 | 3.90 | 248 | 592 | 569 | 104 | 0.16 | 0.12 |
| GEMS 20 | -0.108 | 3.86 | 215 | 526 | 515 | 95 | 0.12 | 0.12 |
| GEMS 21 | -0.112 | 3.87 | 303 | 700 | 684 | 151 | 0.12 | 0.10 |
| GEMS 22 | -0.100 | 3.87 | 307 | 647 | 635 | 140 | 0.12 | 0.11 |
| GEMS 23 | -0.113 | 3.82 | 238 | 651 | 636 | 95 | 0.20 | 0.11 |
| GEMS 24 | -0.097 | 3.90 | 265 | 648 | 630 | 103 | 0.12 | 0.11 |
| GEMS 25 | -0.110 | 3.89 | 299 | 669 | 661 | 131 | 0.14 | 0.11 |
| GEMS 26 | -0.102 | 3.89 | 271 | 638 | 623 | 118 | 0.11 | 0.11 |
| GEMS 27 | -0.088 | 3.83 | 251 | 638 | 633 | 102 | 0.13 | 0.12 |
| GEMS 28 | -0.116 | 3.84 | 268 | 622 | 612 | 113 | 0.12 | 0.12 |
| GEMS 29 | -0.213 | 3.92 | 263 | 638 | 612 | 104 | 0.12 | 0.10 |
| GEMS 30 | -0.142 | 3.88 | 323 | 736 | 698 | 138 | 0.14 | 0.10 |
| GEMS 31 | -0.129 | 3.87 | 282 | 620 | 600 | 126 | 0.14 | 0.10 |
| GEMS 32 | -0.145 | 3.88 | 258 | 612 | 606 | 104 | 0.15 | 0.13 |
| GEMS 33 | -0.092 | 3.88 | 299 | 703 | 684 | 149 | 0.14 | 0.11 |
| GEMS 34 | -0.047 | 3.87 | 277 | 589 | 580 | 111 | 0.12 | 0.11 |
| GEMS 35 | -0.108 | 3.91 | 335 | 731 | 714 | 155 | 0.11 | 0.09 |
| GEMS 36 | -0.095 | 3.89 | 298 | 666 | 648 | 144 | 0.13 | 0.10 |
| GEMS 37 | -0.143 | 3.86 | 237 | 616 | 606 | 116 | 0.13 | 0.12 |
| GEMS 38 | -0.120 | 3.84 | 316 | 707 | 693 | 128 | 0.11 | 0.08 |
| GEMS 39 | -0.112 | 3.89 | 292 | 734 | 714 | 152 | 0.13 | 0.11 |
| GEMS 40 | -0.108 | 3.93 | 292 | 614 | 601 | 140 | 0.17 | 0.12 |
| GEMS 41 | -0.178 | 3.99 | 349 | 711 | 698 | 162 | 0.11 | 0.11 |
| GEMS 42 | -0.145 | 3.94 | 298 | 644 | 629 | 128 | 0.13 | 0.10 |
| GEMS 43 | -0.150 | 3.94 | 316 | 683 | 668 | 145 | 0.13 | 0.13 |
| GEMS 44 | -0.050 | 3.89 | 238 | 547 | 535 | 125 | 0.11 | 0.10 |
| GEMS 45 | -0.040 | 3.95 | 315 | 712 | 702 | 152 | 0.13 | 0.12 |
| GEMS 46 | -0.153 | 3.94 | 295 | 706 | 693 | 126 | 0.15 | 0.11 |
| GEMS 47 | -0.168 | 3.92 | 284 | 673 | 657 | 120 | 0.13 | 0.11 |
| GEMS 48 | -0.132 | 3.90 | 268 | 653 | 637 | 106 | 0.13 | 0.10 |
| GEMS 49 | -0.087 | 3.90 | 243 | 554 | 549 | 101 | 0.14 | 0.11 |
| GEMS 50 | -0.116 | 3.96 | 266 | 603 | 580 | 130 | 0.12 | 0.09 |
| GEMS 51 | -0.096 | 3.97 | 320 | 705 | 680 | 122 | 0.12 | 0.09 |
| GEMS 52 | -0.170 | 3.93 | 298 | 686 | 671 | 112 | 0.15 | 0.11 |
| GEMS 53 | -0.139 | 3.92 | 266 | 616 | 601 | 123 | 0.14 | 0.10 |
| GEMS 54 | -0.087 | 3.94 | 321 | 723 | 705 | 150 | 0.14 | 0.10 |
| GEMS 55 | -0.101 | 3.92 | 280 | 682 | 665 | 123 | 0.13 | 0.11 |
| GEMS 56 | -0.332 | 4.06 | 265 | 688 | 612 | 117 | 0.16 | 0.10 |
| GEMS 57 | -0.090 | 3.93 | 233 | 582 | 564 | 99 | 0.15 | 0.13 |
| GEMS 58 | -0.185 | 4.10 | 287 | 657 | 629 | 134 | 0.15 | 0.13 |
| GEMS 59 | -0.080 | 3.90 | 271 | 668 | 649 | 122 | 0.15 | 0.09 |
| GEMS 60 | -0.099 | 3.88 | 290 | 657 | 633 | 147 | 0.12 | 0.11 |
| GEMS 61 | -0.104 | 3.85 | 295 | 694 | 681 | 119 | 0.14 | 0.11 |
| GEMS 62 | -0.098 | 3.85 | 269 | 643 | 632 | 119 | 0.15 | 0.13 |
| GEMS 63 | -0.092 | 3.85 | 307 | 693 | 675 | 134 | 0.15 | 0.13 |
| Totals | 20918 | 48302 | 47078 | 9703 |
Note. — For each GEMS tile listed in (1), we give the global SExtractor estimate of the background sky level (2) and the r.m.s. pixel-to-pixel noise (3). The source extraction per tile is summarized by the raw number of “cold” (4), “hot” (5), and the combined cold and “good” hot (6) detections. The raw total of includes 4585 duplicate and 406 triplicate source detections (see text for details). In addition, for each tile we give the number (7) of sources matched to mag galaxies from COMBO-17, and the mean (8) and r.m.s. (9) angular separation (in arcsec) between ACS and COMBO-17 coordinates.