In Search of Circumstellar Disks Around Young Massive Stars
Abstract
We present 7 mm, 1.3 cm and 3.6 cm continuum observations made with the Very Large Array toward a sample of ten luminous IRAS sources that are believed to be regions of massive star formation. We detect compact 7 mm emission in four of these objects: IRAS 18089-1732(1), IRAS 18182-1433, IRAS 18264-1152 and IRAS 18308-0841 and for the first time find that these IRAS sources are associated with double or triple radio sources separated by a few arcseconds. We discuss the characteristics of these sources based mostly on their spectral indices and find that their nature is diverse. Some features indicate that the 7 mm emission is dominated by dust from disks or envelopes. Toward other components the 7 mm emission appears to be dominated by free-free radiation, both from ionized outflows or from optically thick H II regions. Furthermore, there is evidence of synchrotron contamination in some of these sources. Finally, we found that the sources associated with ionized outflows, or thermal jets are correlated with CH3OH masers. The precise determination of the nature of these objects requires additional multifrequency observations at high angular resolution. The 3.6 cm continuum observations also revealed seven UCHII regions in the vicinity of the sources IRAS 18089-1732(1) and two more in the source IRAS 18182-1433. We show that the small photoionized nebulae of these UCHII regions are produced by early B-type stars.
1 Introduction
Massive stars (M10 M⊙) are fundamental in determining the physical and chemical evolution of the galaxies. They produce a dominant fraction of the heavy elements, generate large amounts of UV radiation during their lives, and inject turbulent energy into the galactic ISM. However, the formation of massive stars is a poorly understood phenomenon. Schematically, there are two scenarios that have been proposed to explain the formation of massive stars. The first is the accretion scenario, (Garay & Lizano 1998, Norberg & Maeder 2000, and McKee & Tan 2002) similar to that operating for low mass, where a dynamical collapse of molecular clumps, results in the formation of disks and molecular outflows, which leads to the formation of a stellar core. In contrast to this, the coalescence scenario (Bonnell, Bate & Zinnecker 1998; Stahler, Palla & Ho 2000; and Bally & Zinnecker 2005) proposes that massive stars form by the merging of stars of low and intermediate masses. The possible existence of this coalescence scenario receives support from two facts: i) for a spherically symmetric geometry, the radiation pressure can reverse the infall process once the central star reaches about 10 M⊙ (Wolfire & Cassinelli 1987; see, however, Yorke & Sonnhalter 2002 for models that can produce stars with larger masses) and ii) most massive stars are born in the center of dense clusters of low and intermediate mass stars (Bonnell et al. 1998, and references therein). While the accretion scenario implies the existence of well formed disks and jets, this is not the case for in the coalescence scenario, where disks and jets are expected to be disrupted during the merging.
In recent years there has been a large effort to find observational evidence to discriminate between the two scenarios. Searches have been carried out to find evidence for rotating disks using VLA ammonia observations. In two out of twelve objects studied, both B-type protostars, Zhang, Hunter & Sridharan (1998) and Zhang et al. (2002) found evidence for signatures of rotating disks. Pestalozzi et al. (2004) have interpreted VLBI observations of methanol masers in NGC7538 IRS1 in terms of an edge-on Keplerian disk extending to a radius of 1000 AU and orbiting a 30 M⊙ protostar. However, the methanol masers seem to be often associated with shocked molecular gas (De Buizer 2003; Kurtz 2004). Gibb et al. (2004) have tried imaging dusty disks using subarcsecond BIMA millimeter observations (at 2.7 mm and 1.4 mm wavelengths) toward eight massive objects. In most of the objects they found that even at 2.7 mm the dominant emission mechanism is free-free continuum from a thermal jet. Moreover, if other OB-type stars have been formed previously in the region, the object studied may be in the vicinity of bright free-free emission that will make it very difficult to search for the relatively weak mm emission from the disk. Finally, the shorter photoevaporation timescale of disks, the large distances ( Kpc), and the heavy extinctions (AV 100) have also been inherently difficult problems in the search for disks around high-mass protostars.
At present, there is a list of early B-type protostars that have been associated with possibles circumstellar disks, some of them are: the BN object (Jiang et al. 2005), Cepheus A HW2 (Patel et al. 2005), IRAS 20126+4140 (Cesaroni et al. 1997; 1999; Zhang, Hunter & Sridharan 1998; Zhang et al. 2000), IRAS 18089-1732 (Beuther et al. 2004b, 2005b), IRAS 18182-1433 (Beuther et al. 2006; Zhang et al. 2006, both in preparation.), G192.16-3.82 (Shepherd, Claussen, & Kurtz 2001); W33A, AFGL 2591 & NGC 7538 IRS9 (Van der Tak & Menten 2005), AFGL 5142 (Zhang et al. 2002), AFGL 490 (Schreyer et al. 2002 and 2005 in preparation).
We note that sources IRAS 18089-1732 and IRAS 18182-1433 are remarkable examples of massive protostars that are associated with possible circumstellar disks that will be further discussed here.
In this paper, we present a centimeter and millimeter wavelength continuum study of ten IRAS sources that are thought to be regions of massive star formation. The purpose of this research is to identify the nature of these massive sources and to select a subset of good candidates for having associated a circumstellar disk.
2 The Sample
The ten IRAS regions observed were selected from the sample of 69 high mass protostellar objects (HMPOs) of Sridharan et al. (2002) using the following criteria: high luminosity (210) suggesting the presence of OB-type protostars; compact size in their mm emission ( 20′′20′′); proximity to the Sun (a few Kpc or less); bright flux density at 1.2 mm (200 mJy), and weak centimeter emission (1 mJy). The criterion of weak centimeter emission was included to search for sources where the continuum emission at 7 mm and shorter wavelengths from possible disks is less likely to be contaminated by free-free emission. In Table 1 we show the main properties of the ten objects selected.
3 Observations
The observations were made with the Very Large Array of NRAO111The National Radio Astronomy Observatory is a facility of the National Science Foundation operated under cooperative agreement by Associated Universities, Inc. in the continuum mode at 7 mm during 2004 April 1, and at 1.3 cm and 3.6 cm on 2004 May 17. At these epochs, the VLA was in its C configuration. The absolute flux calibrator was 1331+305. In Tables 2, 3 and 4 we present a summary of the observations that will be discussed here, including the measured flux density of the phase calibrators.
As mentioned above, during the first epoch, we made 7 mm continuum observations toward the ten selected massive young regions. We detected continuum emission at or above a 3- level of 0.5 mJy in four of the regions: IRAS 18089-1732(1), IRAS 18182-1433, IRAS 18264-1152, and IRAS 18308-0841. During the second epoch, we observed at 1.3 and 3.6 cm wavelengths toward these four regions.
The data were edited and calibrated in the standard manner using the software package Astronomical Image Processing System (AIPS) of NRAO. Clean maps were obtained using the task IMAGR of AIPS. For the 7 mm continuum maps we used the ROBUST parameter set to 5, that corresponds to natural weighting, to achieve maximum sensitivity in each continuum image. In the 1.3 and 3.6 cm continuum maps we used the ROBUST parameter set to 0, for optimal compromise between sensitivity and angular resolution. The contour and grey scale maps at 0.7, 1.3 and 3.6 cm of the four regions are shown in Figures 1, 2, 4, 5, 7, 8, 10, and 11. The resulting rms noises and synthesized beam parameters for the 0.7, 1.3 and 3.6 cm continuum images are also given in Tables 2, 3 and 4.
Additionally, in all 7 mm maps we have also applied a uv-tapering between 100 to 200 k in order to increase the signal-to-noise ratio of the extended emission ( 1′′) in these regions.
4 Results and Discussion.
In what follows, we discuss each of the four sources detected at 7 mm separately. Our discussion of the spectral indices is based on the assumption that the flux densities did not change between the 2004 April 1 and 2004 May 17 observations.
4.1 IRAS 18089-1732(1)
This source is previously known as IRAS 18089-1732, however we have added a numbering (1) at the end of the name to distinguish between this component and component IRAS 18089-1732(4)
This region contains a strong and extended ( 11′′) 1.2 mm continuum source, H2O and Class II CH3OH maser spots, and a compact ( 1′′) 3.6 cm continuum source that is centered at the middle of the extended 1.2 mm continuum source (Beuther et al. 2002a, 2002c). In recent millimeter and submillimeter observations made with the Submillimter Array (SMA), Beuther et al. (2004b, 2005b) found a 1.2 mm continuum compact core elongated in the southeast-northwest direction, while in the 860 m continuum observations they detected emission more compact, that is coincident with the 3.6 cm source and the H2O maser (see Beuther 2004b, Figure 1). Furthermore, Beuther et al. (2004b, 2005b) found a molecular line forest associated with this source, and particularly the HCOOCH3(20-19) line appears to show evidence for the signatures of rotation. Finally, IRAM 30 m single-dish SiO J=21 (Beuther, priv. comm.), and SMA SiO J=54 (Beuther et al. 2004b) observations show evidence of outflowing molecular gas emanating from this region.
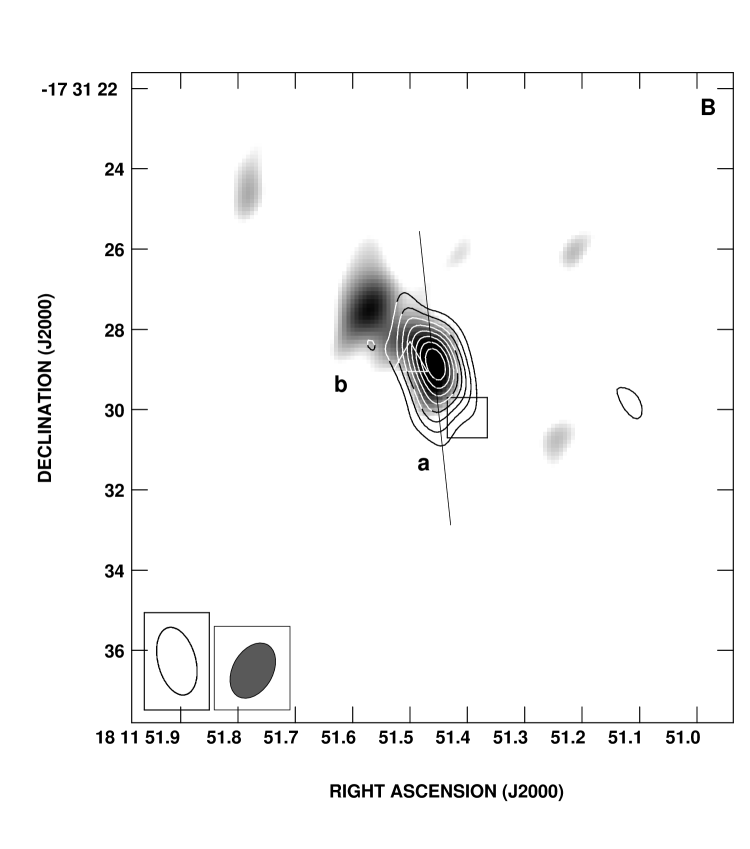
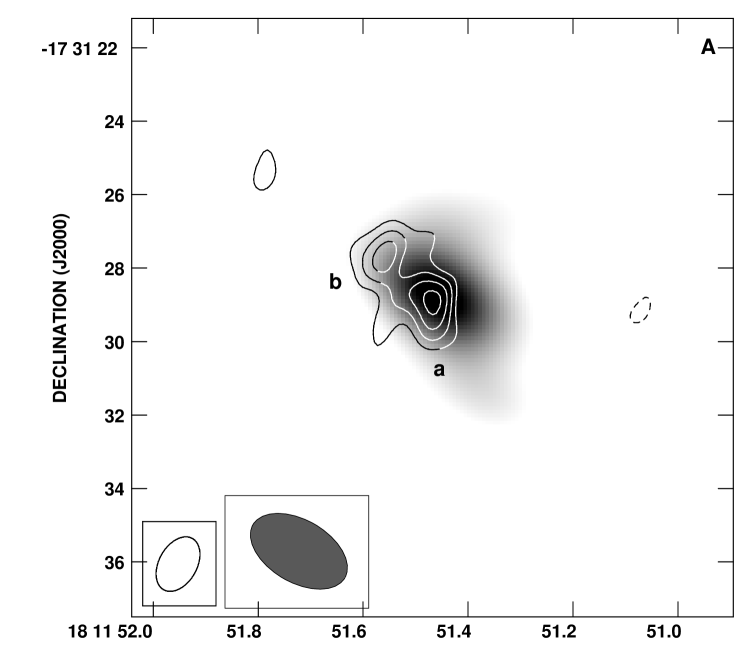
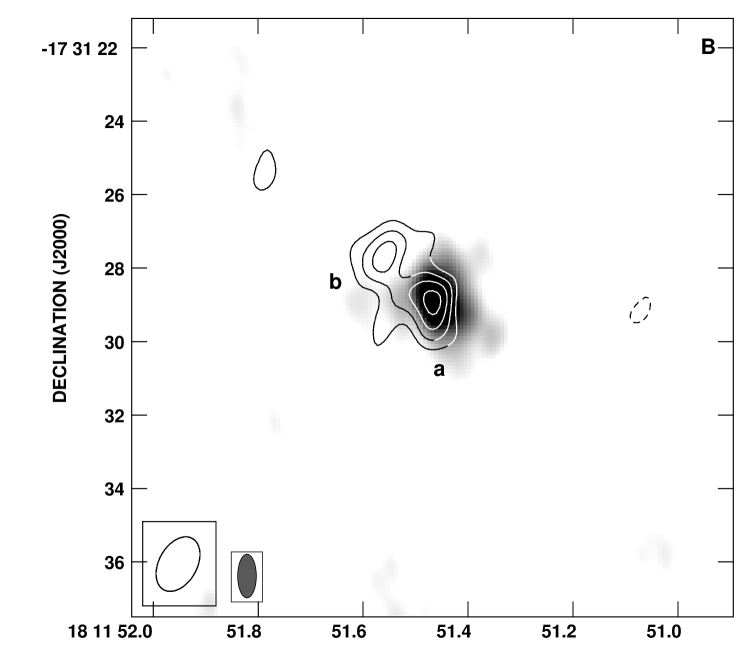
The 7 mm maps (see Figures 1 and 2) show that this source is actually a double source with components separated approximately by 2′′ (7200 AU, at a distance of 3.6 Kpc) in the northeast and southwest direction. We refer to these components as IRAS 18089-1732(1)a and IRAS 18089-1732(1)b.
In Figure 2 we have overlayed the 1.2 and 0.86 mm continuum maps from Beuther et al. (2004b) with our 7 mm continuum maps. Figures 2a and 2b show that the 1.2 and 0.87 mm continuum cores found by Beuther et al. are associated with the compact 7 mm continuum source IRAS 18089-1732(1)a. We now discuss each subcomponent separately.
4.1.1 IRAS 18089-1732(1)a
The radio source IRAS 18089-1732(1)a is resolved in the 7 mm maps. It has deconvolved dimensions of and a P.A. . In the 1.3 cm continuum maps we detect the counterpart of IRAS 18089-1732(1)a (see Figure 1b). This source is also resolved and has deconvolved dimensions of and a P.A. . The position angle of the source is similar at 7 mm and 1.3 cm, as well as to the position angle of the monopolar SiO outflow reported by Beuther et al. (2004a).
Also the 3.6 cm continuum map shows a source that is coincident with IRAS 18089-1732(1)a (see Figure 1a), however, with our resolution ( 4′′) we cannot resolve it. From figure 1 of Beuther et al. (2004a) and our Figures 1 and 2, we associate this 3.6 cm continuum source with the source found previously by Beuther et al. (2002b) at the same wavelength. Moreover, the flux densities for both epochs are quite similar, 1 mJy.
Figure 3a shows the spectral energy distribution for IRAS 18089-1732(1)a from the centimeter to submillimeter wavelengths. It shows a “combined”, two-regime spectrum in which the centimeter emission is dominated by a flat or slowly rising spectrum (=0.580.05) which can be interpreted as moderately optically thick free-free emission, while the millimeter and sub-millimeter emission is dominated by a component that rises rapidly with frequency. This component is likely to be associated with dust emission from a core or disk.
Since the orientation of the position angle of IRAS 18089-1732(1)a is in the south-north direction (in the 1.3 cm and 7 mm observations), and its spectral energy distribution at centimeter wavelengths suggests that this source may be associated with a thermal jet or stellar wind, we interpret this source as a thermal jet that is possibly driving the north-south SiO molecular outflow found by Beuther et al. (2004b). Moreover, as we will see in our sample, these free-free emission sources of relatively flat spectrum appear to be systematically associated with CH3OH maser spots (see Figure 1b and discussion below).
4.1.2 IRAS 18089-1732(1)b
This source is reported here for the first time. IRAS 18089-1732(1)b is resolved in the 7 mm maps. It has deconvolved dimensions of and a P.A. .
IRAS 18089-1732(1)b is only detected at 7 mm. Figure 3b shows its spectral energy distribution from the centimeter to submillimeter wavelengths, mostly upper limits. From our figures and the SED this source could be interpreted as associated with dust emission. However, the spectrum of this source seems to flatten between 1.2 mm and 850 m (see Figure 3 and Beuther et al. 2004b). Therefore, we speculate that IRAS 18089-1732(1)b could be also an optically thick H II region that has its turnover frequency at about 100 GHz.
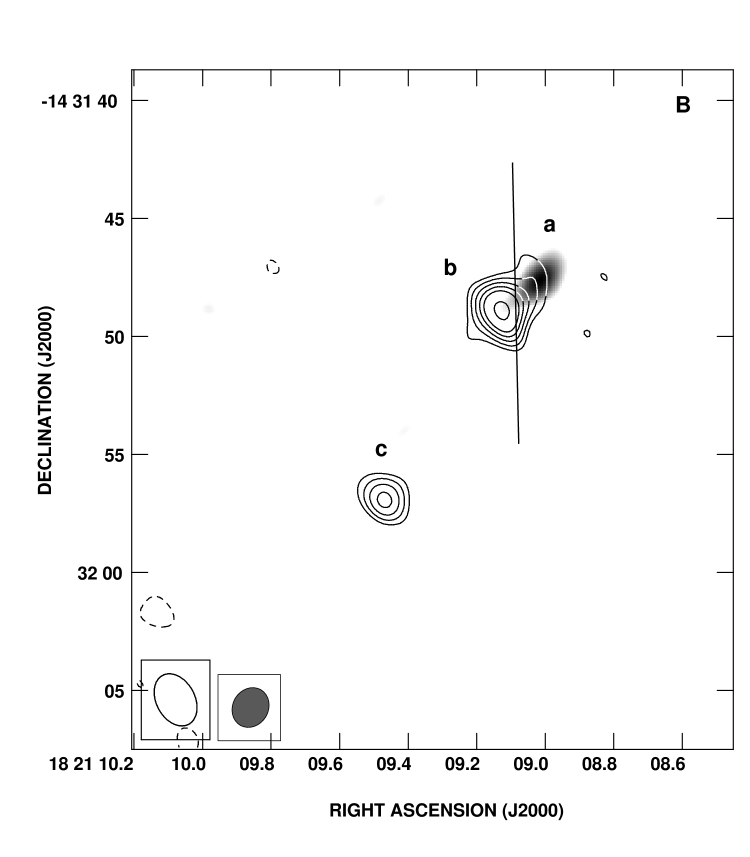
4.2 IRAS 18182-1433
This region contains a strong and extended ( 13′′) 1.2 mm continuum source and H2O and Class II CH3OH masers spots (Beuther et al. 2002a, 2002c). In recent SMA millimeter continuum and line observations (Beuther et al. 2005, in preparation), a compact core ( 4′′) has been detected that is also associated with a molecular line forest. This millimeter continuum core is associated with the H2O masers. Beuther et al. (2002b) also find an extended ( 1′) CO(2-1) molecular outflow emanating from this region.
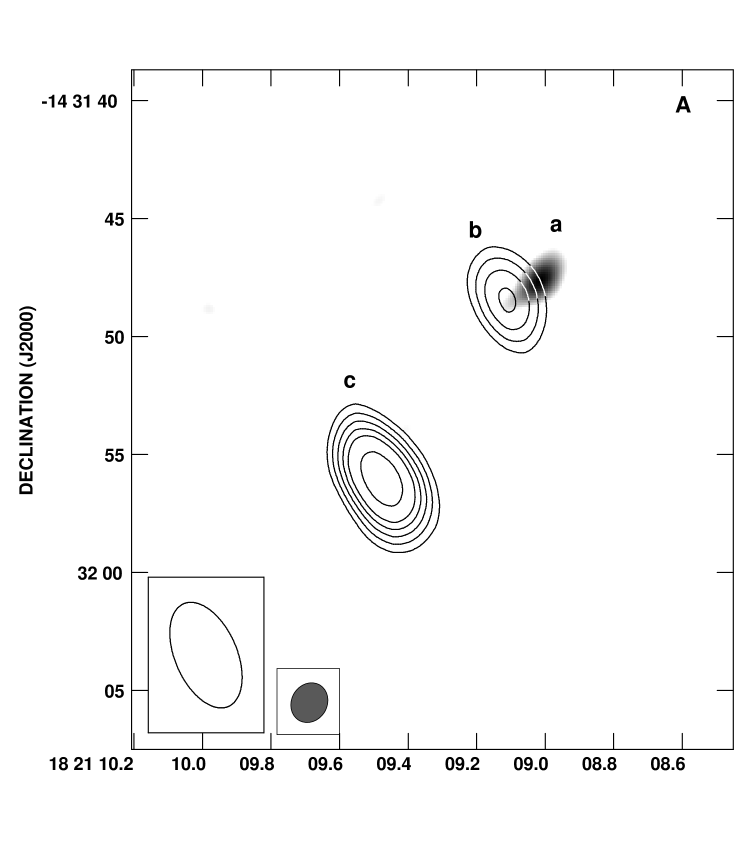
The 3.6, 1.3 and 0.7 cm maps (see Figures 4 and 5) show that IRAS 18182-1433 is a triple source with components separated by 2 to 10 arcseconds. We refer to these components as IRAS 18182-1433a, IRAS 18182-1433b and IRAS 18182-1433c.
4.2.1 IRAS 18182-1433a
IRAS 18182-1433a is detected in our 7 mm continuum map, but not in our 3.6 cm and 1.3 cm maps above the 4 level of 55 and 70 Jy, respectively. This source is not resolved in the 7 mm continuum map. However, based on our synthesized beam, we set an upper limit of 2 ′′ for its angular size.
In Figure 5 we can see that this source is associated with the water masers and the 1.2 mm continuum core found by Beuther et al. (2002a,c). However, there is a shift of about 0.3′′ between the two peaks at 7 and 1.2 mm. One possibility, is that this shift could be due to the fact that dust emission contribution at 1.2 mm comes from both sources, IRAS 18182-1433a and IRAS 18182-1433b, while the source IRAS 18182-1433b was not detected in our 7 mm continuum map.
Figure 6a shows the spectral energy distribution for IRAS 18182-1433a from the centimeter to submillimeter wavelengths. It shows a spectrum associated with a strong dust emission, possibly from the core and disk.
4.2.2 IRAS 18182-1433b
IRAS 18182-1433b is resolved in our 1.3 cm continuum maps. It has deconvolved dimensions of and a P.A. .
IRAS 18182-1433b is not detected in our 7 mm map above a 4 level of 0.22 mJy. The CH3OH Class II maser spot found by Beuther et al. (2002c) is associated with this source. Figure 6b shows its spectral energy distribution from the centimeter to submillimeter wavelengths. It shows a slowly rising (=0.100.01) spectrum. We propose that is produced by free-free emission from a thermal jet or stellar wind. However, this flat spectral index is also consistent with an optically thin H II region.
4.2.3 IRAS 18182-1433c
This source is not resolved in our 1.3 cm maps. Again, based on our synthesized beam, we set an upper limit of 2′′ for its angular size. IRAS 18182-1433c is not detected in our 7 mm map above a 4 level of 0.22 mJy.
Figure 6c shows its spectral energy distribution from the centimeter to submillimeter wavelengths. It shows a slightly negative spectrum (=-0.360.05), which is suggestive of non thermal radiation. Similar negative spectral indices found in sources associated with massive and low-mass star formation are believed to be due to synchrotron contamination from strong shocks (Serpens: Rodríguez et al. 1989, HH 80-81: Martí, Rodríguez, & Reipurth 1993, Cep A: Garay et al. 1996, W3(OH): Wilner, Reid, & Menten 1999, IRAS 16547-4247: Rodríguez et al. 2005 G192.16-3.82: Shepherd & Kurtz 1999). A detailed discussion on the presence of thermal and non thermal components in this type of objects is given in Garay et al. (1996).
4.3 IRAS 18264-1152
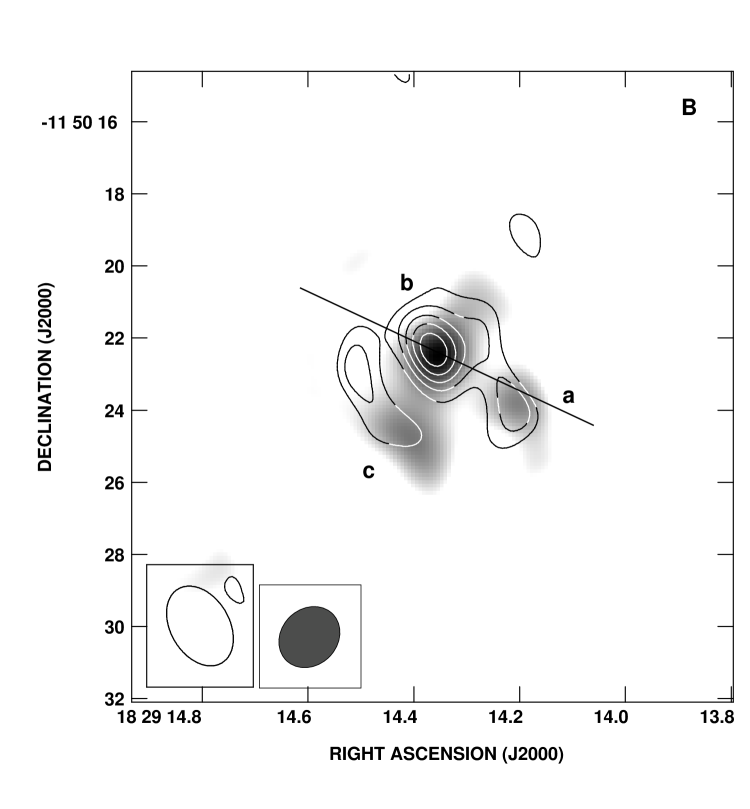
This region contains a strong and extended ( 15′′) 1.2 mm continuum source and H2O and Class II CH3OH maser spots (Beuther et al. 2002a, 2002c). IRAS 18264-1152 shows evidence of outflowing activity. Beuther et al. (2002b) found an extended ( 1′) CO(2-1) molecular outflow emanating from here.
The 7 mm and 1.3 cm maps (see Figures 7 and 8) show that this source is a triple source, with components separated approximately by 2′′. We refer to these components as IRAS 18264-1152a, IRAS 18264-1152b, and IRAS 18264-1152c. We propose that they are possibly tracing the components of a triple stellar system.
4.3.1 IRAS 18264-1152a
Figure 9 shows the spectral energy distribution of this source from the centimeter to millimeter wavelengths. The power law index of 2.10.05 suggests an optically thick H II region or dust emission from the core and disk.
4.3.2 IRAS 18264-1152b
This source is resolved in our 7 mm continuum maps. It has deconvolved dimensions of and a P.A. .
Figure 9 shows its spectral energy distribution from the centimeter to millimeter wavelengths. The slightly rising spectrum (spectral index of 0.270.06) between 3.6 and 1.3 cm suggests a thermal jet or a partially optically thick H II region. The flux density at 7 mm is much larger than the value extrapolated from the 3.6 and 1.3 cm observations and suggests that dust emission may be dominant at 7 mm.
4.3.3 IRAS 18264-1152c
This source is resolved in our 7 mm continuum maps. It has deconvolved dimensions of and a P.A..
Figure 9 shows its spectral energy distribution from the centimeter to millimeter wavelengths. At 3.6 cm, we have only an upper limit. The power law index of 2.10.05 between 1.3 cm and 7 mm suggests an optically thick H II region or dust emission from a core and disk.
4.4 IRAS 18308-0841
This region contains a strong and extended ( 17′′) 1.2 mm continuum source and one H2O maser spot (Beuther et al. 2002a, 2002c). Beuther et al. (2002b) found strong 12CO(2-1) molecular emission. However the presence of bipolar outflow structure was not clearly established.
The 7 mm and 1.3 cm maps (see Figures 10 and 11) show that this source is a triple source with components separated by 3′′ to 10′′. We refer to these components as IRAS 18308-0841a, IRAS 18308-0841b and IRAS 18308-0841c.
4.4.1 IRAS 18308-0841a
This source is resolved in our 7 mm continuum maps. It has deconvolved dimensions of and a P.A. . This source is also resolved in our 1.3 cm continuum maps. It has deconvolved dimensions of and a P.A. . Finally, the source is also resolved in our 3.6 cm continuum maps. It has deconvolved dimensions of and a P.A. . We find that while the 7 mm and 1.3 cm deconvolved dimensions are consistent, the deconvolved dimensions at 3.6 cm appear to be significantly larger. This may be due to the presence of extended emission that is resolved out or too faint to be detected at 7 mm and 1.3 cm.
Figure 12 shows its spectral energy distribution from the centimeter to millimeter wavelengths. The negative spectral index of -0.420.07 could be suggest the presence of synchrotron emission. However, this spectral index could also be due to missing flux density in the higher angular resolution and higher frequency observations. Matching beam observations of the source at several frequencies are needed to discuss the spectral indices in a very reliable way.
4.4.2 IRAS 18308-0841b
This source is resolved in our 3.6 cm continuum maps. It has deconvolved dimensions of and a P.A. .
Figure 12 shows its spectral energy distribution from the centimeter to millimeter wavelengths. Again, the negative spectral (-0.260.01) index could be suggest the presence of synchrotron emission. However, this spectral index could also be due to missing flux density in the higher angular resolution and higher frequency observations. Matching beam observations of the source at several frequencies are also needed to discuss the spectral indices in a very reliable way.
4.4.3 IRAS 18308-0841c
Figure 12 shows its spectral energy distribution from the centimeter to millimeter wavelengths. It was detected only at 7 mm, suggesting that dust is dominant at this wavelength.
4.5 Clusters of UCHII Regions in the Vicinity of the sources IRAS 18089-1732(1) and IRAS 18182-1433
We report for the first time the detection of seven ultracompact HII regions in the vicinity of the source IRAS 18089-1732(1) and two more ultracompact HII regions in the source IRAS 18182-1433 at 3.6 cm (see Figure 13 and 14). Their physical parameters are shown in Table 5. Most of them show a cometary or unresolved spherical morphology. Following Van der Tak and Menten (2005), and assuming that the free-free emission is optically thin, that the ionized gas has a temperature of 104 K, and that these sources have distances of 3.6 and 4.5 kpc, we find that the flux of Lyman continuum photons for each UCHII, can be provided by an early B-type star (see Panagia 1973).
We searched for more UCHII regions in the vicinity of the others two IRAS sources that were observed at 3.6 cm, however, we did not detect other cases at a 4 level of their respective rms noises. Therefore, in comparison with these regions, IRAS 18089-1732(1) and IRAS 18182-1433 can be considered rich regions of high mass star formation.
4.6 General Discussion of the Sources
With the present angular resolution and sensitivities of our images, it is interesting to note that the four sources detected at 7 mm (IRAS 18089-1732, IRAS 18182-1433, IRAS 18264-1152, and IRAS 18308-0841) are double or triple, with no case of a single source. In the four regions with detected 7 mm emission, we find a total of 11 subcomponents. The spectral index of these subcomponents varies and suggests different interpretations for the nature of the sources. In Table 6 we give a tentative interpretation for the nature of the sources, based on our discussion.
We note that the sources IRAS 18089-1732(1)a, IRAS 18182-1433b, IRAS 18264-1152b hat exhibit slightly rising spectral indices (that are frequently associated with winds or thermal jets), show a correlation with methanol masers spots. Furthermore, those maser spots are found in the same orientation of the molecular outflows (See figure 1b, 5 and 8). Since the methanol masers already have been suggested to be associated with shocked molecular gas in the outflows produced by the star (De Buizer 2003; Kurtz 2004), our data show this correlation, and supports the notion that the methanol masers are associated with ionized or shocked gas rather than disks (or dust emission).
It is puzzling that we only detected 4 of the 10 sources observed, since they all (with the exception of IRAS 18553+0414 and IRAS 18089-1732(4)) seem to have similar luminosities, and distances. However, these four detected continuum sources (IRAS 18089-1732, IRAS 18182-1433, IRAS 18264-1152 and IRAS 18308-0841) are embedded in the most massive cores of our initial subset (see Table 1).
Of the 11 subcomponents detected, four (IRAS 18089-1732(1)b, IRAS 18182-1433a, IRAS 18264-1152b, IRAS 18308-0841c) have 7 mm emission that could be coming from the dust.
5 Conclusions
Our main conclusions are summarized below.
1) We mapped ten regions of massive star formation at 7 mm with the VLA, detecting compact emission in four of them. These four sources were further observed with the VLA at 1.3 and 3.6 cm.
2) Multiplicity is a common factor in the emission detected: three of the four sources detected are resolved into three subcomponents, while the fourth source is a double source.
3) Four of the sources detected show 7 mm emission above the value extrapolated from the observations at longer wavelengths assuming jet emission. These sources are IRAS 18089-1732(1)b, IRAS 18182-1433a, IRAS 18264-1152b, IRAS 18308-0841c. They are considered good candidates of massive young stars with dust emission at 7 mm that could come from a disk or envelope. However, further observations at higher and lower frequencies are required to establish if the detected 7 mm emission is actually coming from dust or from optically thick ionized gas (free-free emission).
4) Two of the sources show spectral indices consistent with ionized outflows: IRAS 18089-1732(1)a and IRAS 18182-1433b. IRAS 18264-1152b show, in addition to the 7 mm excess, a spectral index consistent with an ionized outflow between 3.6 and 1.3 cm. This last source may then be a combination of thermal jet and disk.
5) Two of the sources show spectral indices consistent with optically thick HII regions: IRAS 18264-1152a and c.
6) Three of the sources show negative spectral indices that suggest the presence of synchrotron contamination: IRAS 18182-1433c, and IRAS 18308-0841a and b. However, these spectral indices could also be due to missing flux density in the higher angular resolution, higher frequency observations. If confirmed with multifrequency, matching beam observations, this synchrotron emission could be an indicator of strong shocks produced by the powerful outflows known to exist in these regions.
8) Finally, we also find that the methanol masers in these regions are systematically associated with radio sources that show slightly rising spectral indices: IRAS 18089-1732(1)a, IRAS 18182-1433b, and IRAS 18264-1152b. This indicates that the methanol maser emission is associated with outflows rather than with disks. The interpretation is that these masers are associated with the presence of compact free-free emission.
Our findings are consinstent with the accretion scenario, where a dynamical collapse of molecular clumps, results in the formation of disks and molecular outflows, which leads to the formation of a massive stellar core. However, in each IRAS source we also detected multiple radio sources separate a few arcseconds, suggesting the formation of groups of massive stars.
References
- (1)
- (2) Bally, J. & Zinnecker, H. 2005, AJ, 129, 2281
- (3)
- (4) Beuther, H., Schilke, P., Menten, K. M., Motte, F., Sridharan, T. K., & Wyrowski, F. 2002a, ApJ, 566, 945
- (5)
- (6) Beuther, H., Schilke, P., Sridharan, T. K., Menten, K. M., Walmsley, C. M., & Wyrowski, F. 2002b, A&A, 383, 892
- (7)
- (8) Beuther, H., Schilke, P., Sridharan, T. K., et al. 2002c, A&A, 383, 892
- (9)
- (10) Beuther, H., Walsh, A., Schilke, P., Sridharan, T. K., Menten, K. M., & Wyrowski, F. 2002d, A&A, 390, 289
- (11)
- (12) Beuther, H. et al. 2004a, ApJ, 616, L23
- (13)
- (14) Beuther, H., et al. 2004b, ApJ, 616, L31
- (15)
- (16) Beuther, H., 2005b, ApJ, 628, 800
- (17)
- (18) Bonnell I. A., Bate M. R., & Zinnecker H., 1998, MNRAS, 298, 93
- (19)
- (20) Cesaroni, R., Felli, M., Testi, L., Walmsley, C. M., & Olmi, L. 1997, A&A, 325, 725
- (21)
- (22) Cesaroni, R., Felli, M., Jenness, T., et al. 1999, A&A, 345, 949
- (23)
- (24) DeBuizer, J. 2003, MNRAS, 341, 277
- (25)
- (26) Garay, G., Ramirez, S., Rodríguez, L. F., Curiel, S., & Torrelles, J. M. 1996, ApJ, 459, 193
- (27)
- (28) Garay, G., & Lizano, S. 1999, PASP, 111, 1049
- (29)
- (30) Gibb, A. G., Hoare, M. G., Wyrowski, F., & Mundy, L. G., 2004, IAUS, 221, 425
- (31)
- (32) Hildebrand, R. 1983, QJRAS, 24, 267
- (33)
- (34) Hollenbach, D. 1997, in IAU Symp. 182, Herbig-Haro Flows and the Birth of Stars, ed. B. Reipurth & C. Bertout (Dordrecht: Kluwer), 181
- (35)
- (36) Jiang, Z. et al., 2005, Nature, 437, 112
- (37)
- (38) Kurtz, S., Hofner, P., & Vargas Alvarez, C. 2004, ApJS, 155, 149
- (39)
- (40) Martí. J., Rodríguez, L. F., & Reipurth, B. 1993, ApJ, 416, 208
- (41)
- (42) McKee, C. F., & Tan, J. C. 2002, Nature, 416, 59
- (43)
- (44) Norberg, P., & Maeder, A. 2000, A&A, 359, 1025
- (45)
- (46) Patel et al. 2005, Nature, 437, 109
- (47)
- (48) Panagia, N. 1973, AJ, 78, 929
- (49)
- (50) Pestalozzi, M. R., Elitzur, M., Conway, J. E., & Booth, R. S. 2004, ApJ, 603, L113
- (51)
- (52) Rodríguez, L. F., Curiel, S., Moran, J. M., Mirabel, I. F., Roth, M. & Garay, G. 1989, ApJ, 346, L85
- (53)
- (54) Rodríguez, L. F., Garay, G., Brooks, K. J., & Mardones, D., 2005, ApJ, 626, 953R
- (55)
- (56) Shepherd, D. S., & Kurtz, S. E. 1999, ApJ, 523, 690
- (57)
- (58) Shepherd, D. S., Claussen, M. J., & Kurtz, S. E. 2001, Science, 292, 1513
- (59)
- (60) Stahler, S. W., Palla, F., & Ho, P. T. P., 2000, in Protostars and Planets IV, ed. V. Mannings, A. P. Boss, & S. S. Russell (Tucson: Univ. Arizona Press), 327
- (61)
- (62) Sridharan, T. K., Beuther, H., Schilke, P., Menten, K. M., & Wyrowski, F. 2002, ApJ, 566, 931
- (63)
- (64) Van der Tak, F. F. S., & Menten, K. M. 2005, A&A, 437, 947
- (65)
- (66) Walsh, A. J., Burton, M. G., Hyland, A. R., & Robinson, G. 1998, MNRAS, 301, 640
- (67)
- (68) Wilner, D. J., Reid, M. J., & Menten, K. M. 1999, ApJ, 513, 775
- (69)
- (70) Wolfire, M. G., & Cassinelli, J. P. 1987, ApJ, 319, 850
- (71)
- (72) Yorke, H. W., & Welz, A. 1996, A&A, 315, 555
- (73)
- (74) Zhang, Q., Hunter, T. R., & Sridharan, T. K. 1998, ApJL, 505, L151
- (75)
- (76) Zhang, Q., Hunter, T. R., Sridharan, T. K., & Cesaroni, R. 1999, ApJ, 527, L117
- (77)
- (78) Zhang, Q., Hunter, T. R., Sridharan, T. K., & Ho, P. T. P. 2002, ApJL, 566, 982
- (79)


| Physical Parameters | |||||
|---|---|---|---|---|---|
| Coordinates | Distanceb | Luminosity | Core Massc | ||
| Source | [Kpc] | [L⊙] | [M⊙] | ||
| IRAS 180891732(1) | 18 11 51.3 | -17 31 29 | 3.6 | 3.2 104 | 1200 |
| IRAS 180891732(4) | 18 12 30.4 | -17 32 59 | 3.6 | - | 200 |
| IRAS 180901832 | 18 12 01.9 | -18 31 56 | 6.6 | 1.3 104 | 1000 |
| IRAS 181821433 | 18 21 07.9 | -14 31 53 | 4.5 | 2.0 104 | 1500 |
| IRAS 182641152 | 18 29 14.3 | -11 50 26 | 3.5 | 1.0 104 | 2200 |
| IRAS 182900924 | 18 31 44.8 | -09 22 09 | 5.3 | 2.5 104 | 800 |
| IRAS 183080841 | 18 33 31.9 | -08 39 17 | 4.9 | 1.6 104 | 1300 |
| IRAS 185210134 | 18 54 40.8 | 01 38 02 | 5.0 | 1.3 104 | 500 |
| IRAS 185530414 | 18 57 52.9 | 04 18 06 | 0.6 | 2.5 102 | 15 |
| IRAS 190120536 | 19 03 45.1 | 05 40 40 | 4.6 | 1.6 104 | 500 |
Note. — Units of right ascension are hours, minutes, and seconds, and units of declination are degrees, arcminutes, and arcseconds.
| Bootstrapped | Rms | Synthesized Beam | |||||
|---|---|---|---|---|---|---|---|
| Phase Center | Phase | Flux Density | Noise | Size | P.A. | ||
| Source | Calibrator | [Jy] | [mJy] | [arcsec] | [deg.] | ||
| 180891732(1) | 18 11 51.3 | -17 31 29 | 1820-254 | 0.4790.008 | 0.18 | 1.631.08 | -29 |
| 180891732(4) | 18 12 30.4 | -17 32 59 | 1820-254 | 0.4790.008 | 0.16 | 2.111.47 | -33 |
| 180901832 | 18 12 01.9 | -18 31 56 | 1820-254 | 0.4790.008 | 0.18 | 1.991.49 | -30 |
| 181821433 | 18 21 07.9 | -14 31 53 | 1832-105 | 0.6560.006 | 0.19 | 1.901.59 | -30 |
| 182641152 | 18 29 14.3 | -11 50 26 | 1832-105 | 0.6560.006 | 0.18 | 1.841.62 | -28 |
| 182900924 | 18 31 44.8 | -09 22 09 | 1832-105 | 0.6560.006 | 0.16 | 1.371.14 | -10 |
| 183080841 | 18 33 31.9 | -08 39 17 | 1832-105 | 0.6560.006 | 0.22 | 1.771.64 | -14 |
| 185210134 | 18 54 40.8 | 01 38 02 | 1851+005 | 0.790.01 | 0.13 | 1.351.18 | -9 |
| 185530414 | 18 57 52.9 | 04 18 06 | 1851+005 | 0.790.01 | 0.13 | 1.381.20 | -22 |
| 190120536 | 19 03 45.1 | 05 40 40 | 1851+005 | 0.790.01 | 0.12 | 1.361.19 | -30 |
Note. — Units of right ascension are hours, minutes, and seconds, and units of declination are degrees, arcminutes, and arcseconds.
| Bootstrapped | Rms | Synthesized Beam | |||||
|---|---|---|---|---|---|---|---|
| Phase Center | Phase | Flux Density | Noise | Size | P.A. | ||
| Source | Calibrator | [Jy] | [Jy] | [arcsec] | [deg.] | ||
| 180891732(1) | 18 11 51.3 | -17 31 29 | 1820-254 | 0.6260.003 | 70 | 1.730.94 | 15 |
| 181821433 | 18 21 07.9 | -14 31 53 | 1832-105 | 0.9810.006 | 70 | 2.351.63 | 28 |
| 182641152 | 18 29 14.3 | -11 50 26 | 1832-105 | 0.9810.006 | 60 | 2.381.63 | 31 |
| 183080841 | 18 33 31.9 | -08 39 17 | 1832-105 | 0.9810.006 | 170 | 2.441.63 | 36 |
Note. — Units of right ascension are hours, minutes, and seconds, and units of declination are degrees, arcminutes, and arcseconds.
| Bootstrapped | Rms | Synthesized Beam | |||||
|---|---|---|---|---|---|---|---|
| Phase Center | Phase | Flux Density | Noise | Size | P.A. | ||
| Source | Calibrator | [Jy] | [Jy] | [arcsec] | [deg.] | ||
| 180891732(1) | 18 11 51.3 | -17 31 29 | 1820-254 | 0.7710.002 | 40 | 4.702.75 | 17 |
| 181821433 | 18 21 07.9 | -14 31 53 | 1832-105 | 1.4150.004 | 55 | 4.752.62 | 24 |
| 182641152 | 18 29 14.3 | -11 50 26 | 1832-105 | 1.4150.004 | 40 | 4.902.66 | 31 |
| 183080841 | 18 33 31.9 | -08 39 17 | 1832-105 | 1.4150.004 | 160 | 4.402.68 | 28 |
Note. — Units of right ascension are hours, minutes, and seconds, and units of declination are degrees, arcminutes, and arcseconds.
| Physical Parameters | ||||||
|---|---|---|---|---|---|---|
| Flux Density | log(NL)b | |||||
| Source | Deconvolved Size | P.A. | [mJy] | s-1 | ||
| G12.879+0.496 | 18 11 48.834 | -17 31 49.07 | 75∘ 10∘ | 6.00.1 | 45.7 | |
| G12.891+0.495 | 18 11 50.422 | -17 31 14.12 | 115∘ 68∘ | 3.00.1 | 45.5 | |
| G12.886+0.487 | 18 11 51.510 | -17 31 40.57 | 58∘ 25∘ | 1.00.1 | 45.0 | |
| G12.883+0.480 | 18 11 52.680 | -17 32 04.92 | 16∘ 50∘ | 6.00.1 | 45.7 | |
| G12.918+0.487 | 18 11 55.360 | -17 30 01.92 | 44∘ 26∘ | 6.00.1 | 45.7 | |
| G12.910+0.477 | 18 11 56.751 | -17 30 44.05 | 42∘ 20∘ | 5.00.1 | 45.6 | |
| G12.944+0.488 | 18 11 58.314 | -17 28 38.78 | 43∘ 13∘ | 1.00.1 | 45.1 | |
| G16.560+0.001 | 18 20 54.977 | -14 31 39.84 | - | - | 2.50.1 | 45.5 |
| G16.614-0.018 | 18 21 05.386 | -14 29 20.45 | - | - | 0.90.1 | 45.1 |
Note. — Units of right ascension are hours, minutes, and seconds, and units of declination are degrees, arcminutes, and arcseconds.
| Flux Density | ||||||
|---|---|---|---|---|---|---|
| 3.6 cm | 1.3 cm | 0.7 cm | ||||
| Source | [mJy] | [mJy] | [mJy] | Nature | ||
| 180891732(1)a | 18 11 51.451 | -17 31 28.85 | 1.100.05 | 1.600.04 | 3.000.30 | Thermal Jet + Core |
| 180891732(1)b | 18 11 51.571 | -17 31 27.89 | 0.20 | 0.30 | 2.100.30 | H II Region? |
| 181821433a | 18 21 09.014 | -14 31 47.62 | 0.20 | 0.35 | 2.260.30 | Core+Disk |
| 181821433b | 18 21 09.129 | -14 31 48.59 | 0.600.05 | 0.800.05 | 0.720.10 | Thermal Jet |
| 181821433c | 18 21 09.469 | -14 31 56.93 | 1.650.03 | 1.100.05 | 0.80 | Strong Shocks? |
| 182641152a | 18 29 14.203 | -11 50 23.80 | 0.20 | 0.340.10 | 1.300.20 | H II Region? |
| 182641152b | 18 29 14.356 | -11 50 22.50 | 0.800.02 | 1.060.07 | 2.700.20 | Thermal Jet + Core |
| 182641152c | 18 29 14.406 | -11 50 24.77 | 0.20 | 0.440.10 | 1.700.30 | H II Region? |
| 183080841a | 18 33 32.891 | -08 39 18.47 | 11.400.05 | 10.300.20 | 5.380.50 | Strong Shocks? |
| 183080841b | 18 33 32.904 | -08 39 07.33 | 3.210.05 | 2.460.10 | 0.80 | Strong Shocks? |
| 183080841c | 18 33 33.120 | -08 39 07.53 | 0.60 | 0.75 | 2.200.40 | Core? |
Note. — Units of right ascension are hours, minutes, and seconds, and units of declination are degrees, arcminutes, and arcseconds.