Constraints on changes in fundamental constants from a cosmologically distant OH absorber/emitter
Abstract
We have detected the four 18cm OH lines from the gravitational lens toward PMN J01340931. The 1612 and 1720 MHz lines are in conjugate absorption and emission, providing a laboratory to test the evolution of fundamental constants over a large lookback time. We compare the HI and OH main line absorption redshifts of the different components in the absorber and the lens toward B0218+357 to place stringent constraints on changes in . We obtain , consistent with no evolution over the redshift range . The measurements have a sensitivity of or to fractional changes in and over a period of Gyr, half the age of the Universe. These are among the most sensitive constraints on changes in .
pacs:
98.80.Es,06.20.Jr,33.20.Bx,98.58.-wIntroduction.— A fairly generic feature of modern higher-dimensional theoretical models is that fundamental constants like the fine structure constant , the electron-proton mass ratio , the proton gyromagnetic ratio , etc, depend on the scale lengths of the extra dimensions of the theory. In the current theoretical framework, it is implausible that these scale lengths remain constant, implying that , , etc should vary with time. The detection of such changes provides an avenue to probe new and fundamental physics.
Null results have been obtained in all terrestrial studies of evolving constants, with atomic clocks and isotopic abundances in the Oklo natural fission reactor providing the tightest constraints on fractional changes in the fine structure constant ( per year, over three years Peik et al. (2004), and , over years Damour and Dyson (1996), respectively). However, terrestrial measurements only probe fairly small fractions of the age of the Universe; astrophysical techniques are needed to examine the possibility of variations at earlier times (e.g. Murphy et al. (2003); Srianand et al. (2004); Kanekar et al. (2004); Tzanavaris et al. (2005); Ivanchik et al. (2005)). It is these techniques that provide tantalizing evidence for changes in ; the “many-multiplet” method, applied to Keck telescope optical spectra, gives over the redshift range Murphy et al. (2003). However, a similar technique, applied to Very Large Telescope spectra, yields a conflicting result, , over Srianand et al. (2004). Independent techniques are clearly needed as systematics appear to play a significant role in the current results.
The four 18cm radio OH lines have very different dependences on , and and their redshifted frequencies can hence be compared to each other and to those of the HI 21cm hyperfine line or HCO+ rotational lines to measure any variation Chengalur and Kanekar (2003); Darling (2003). Even more interesting is the case of conjugate emission/absorption by the 18cm satellite OH lines, detected in a single cosmologically distant object (at toward PKS1413+135; Kanekar et al. (2004); Darling (2004)). Here, the pumping mechanism guarantees that the two lines arise from the same gas; a comparison can thus be made between the 1720 and 1612 MHz redshifts without concerns about systematic motions between the clouds in which the different lines arise.
Only four redshifted OH main absorbers are currently known Kanekar and Chengalur (2002), with high resolution data only available for the lens toward B0218+357 Kanekar et al. (2003). Similarly, only one redshifted conjugate OH satellite system is known, at a relatively low redshift, ; this corresponds to a lookback time of Gyr, not much earlier than the time range probed by the Oklo reactor 111Throughout this paper, we use an LCDM cosmology, with , and km/s Mpc-1.. We report here the detection of all four 18cm OH lines in a new conjugate system at , corresponding to a lookback time of Gyr.
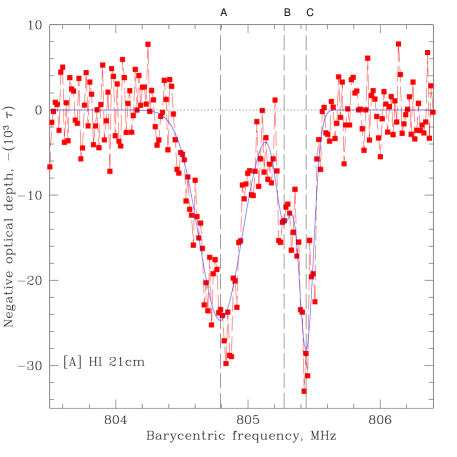
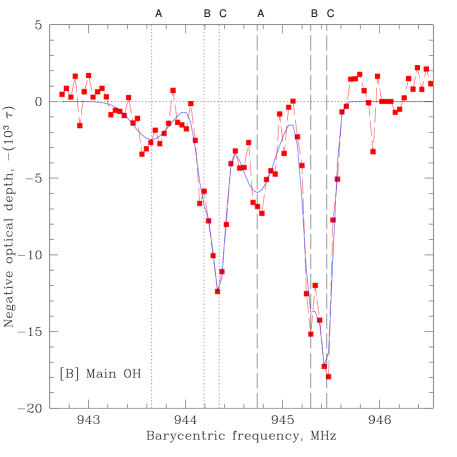
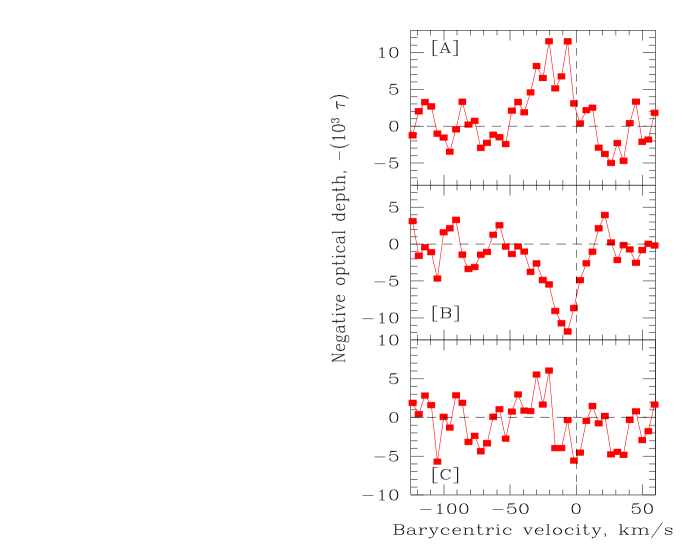
Spectra and results— The redshifted OH 18cm lines from the lens toward PMN J01340931 were observed simultaneously with the Green Bank Telescope (GBT) in October, 2004, and January, 2005, with an observing resolution of km/s (after Hanning smoothing). A separate GBT observation in January, 2005, provided a high resolution spectrum in the redshifted HI 21cm line, originally detected by Kanekar and Briggs (2003). The HI 21cm and main line OH spectra (smoothed to resolutions of and km/s, respectively, and resampled) are shown in Figs. 1[A] and [B], while the three panels of Fig. 2 show the 1720 and 1612 MHz satellite spectra and the sum of 1720 and 1612 MHz optical depths (all at a resolution of km/s). PMN J01340931 is unresolved by the GBT beam; the above optical depths are the ratio of line flux density to continuum flux density for each transition (using the low optical depth limit). All spectra have a root-mean-square optical depth noise of , per km/s channel.
Besides the above, the redshifted HCO+ 2–1 line was observed with the IRAM 30m telescope and the Australia Telescope Compact Array (ATCA), the 6 cm ground state H2CO doublet lines with the GBT and the 2 cm first rotationally excited state H2CO lines with the Very Large Array and the GBT. None of these transitions were detected, down to limits of for the HCO+ line and , for the ground and excited state H2CO lines, respectively. This is curious as every other redshifted OH absorber has also been detected in HCO+ absorption (e.g. Wiklind and Combes (1998); Kanekar and Chengalur (2002)). While the structure of the background source is very different at the HCO+ and OH frequencies, implying that small-scale structure in the molecular cloud could be an issue, it is still surprising that none of the OH components, at very different velocities from each other, show any trace of mm-wave absorption.
The HI 21cm profile has three fairly clear components, two of which are blended and well-separated from the third. Similarly, both the 1667 and 1665 MHz OH lines show two clearly resolved components, with the lower redshift one somewhat asymmetric, suggesting that it is blended. While the redshifts of the two strong 21cm and main OH components are similar, the OH satellite lines are blue-shifted by km/s relative to the lowest redshift (highest frequency) component in Fig. 1[A] and [B]. This is reminiscent of the situation in the other redshifted conjugate OH system, PKS1413+135 Kanekar et al. (2004). In both cases, the sum of the satellite frequencies is different from the sum of the main line frequencies; since the two sums have the same dependence on , and Chengalur and Kanekar (2003); Darling (2003), the satellite and main OH lines must arise in different gas.
The sum of the 1720 and 1612 MHz optical depths in Fig. 2[c] is consistent with noise; the satellite lines are thus conjugate with each other. Such conjugate behavior arises due to competition between the intra-ladder and cross-ladder decay routes to the OH ground state, after the molecules have been pumped by collisions or far-infra-red radiation into the higher excited states (e.g. van Langevelde et al. (1995)). The fact that the 1720 MHz line is seen in emission and the 1612 MHz, in absorption, implies that the intra-ladder decay route dominates. This, and the requirement that the transition be optically thick for the 1720 MHz line inversion van Langevelde et al. (1995), yields the constraint cm-2 on the OH column density.
The 1720 MHz line luminosity is , making this the brightest known 1720 MHz megamaser by more than an order of magnitude. It is also the most distant OH megamaser; for comparison, the furthest known 1667 MHz megamaser is at Baan et al. (1992). This is also the first case of conjugate OH satellite emission/absorption in a “normal” galaxy; all previous cases were objects containing an active galactic nucleus (e.g. Cen A; van Langevelde et al. (1995)), where the OH level populations might have been affected by nuclear activity. This is interesting as it suggests that such conjugate behaviour might not be as rare as earlier expected and hence, that it might be used as a tool to probe both spatial and temporal changes in fundamental constants.
Constraining changes in fundamental constants.— A comparison between the redshifts of different spectral lines to measure changes in fundamental constants involves the assumption that the lines have no intrinsic velocity offsets from each other. This is true even for comparisons between lines of the same species as different transitions might be excited under different physical conditions and thus, in different spatial locations. This appears to be the case with the main and satellite OH lines here, implying that one cannot compare their redshifts to estimate changes in the different constants.
However, as in the case of PKS1413+135 Kanekar et al. (2004); Darling (2004), the conjugate nature of the satellite lines ensures that they arise in the same physical region and, crucially, that systematic velocity offsets are not an issue. The different dependences of the sum and difference of the 1720 MHz and 1612 MHz frequencies on , and then allows us to estimate changes in the quantity Chengalur and Kanekar (2003); Kanekar et al. (2004). The low signal-to-noise ratio of the 1720 and 1612 spectra of Fig. 2 precludes such an estimate at the present time. However, the high redshift of the system implies that it is an excellent target for deep integrations in the satellite lines, enabling a precision measurement of changes in , and in the future. For example, observations with the Square Kilometer Array, a next generation radio telescope, should be able to detect fractional changes in this system, implying a sensitivity of . This is similar to the sensitivity of the Oklo measurement but with fewer assumptions and out to a far larger lookback time of Gyr. In addition, this sensitivity would be obtained from a single system, unlike the many-multiplet method, which requires a large number of absorbers to average out systematic effects. A comparison between the results from the conjugate systems in PKS1413+135 and PMN J01340931 will thus allow one to probe true spatio-temporal changes in the above constants (instead of merely averaging over spatial effects), especially since the two sources are very widely separated on the sky.
Comparisons between the HI 21cm and main OH lines suffer from the drawback of possible systematic velocity offsets between the two species. However, a tight correlation has been found between the velocities of HCO+ and nearest HI 21cm absorption in the Galaxy, with a dispersion of only km/s Drinkwater et al. (1998). Further, the velocities of Galactic OH and HCO+ absorption have been found to be remarkably similar (Liszt and Lucas (2000); see Figs. 4 and 5 of Liszt and Lucas (2000)). OH and HI 21cm velocities should thus also be well-correlated and, in fact, the dispersion in this correlation is likely to be less than that between the HCO+ and HI 21 velocities, as the spatial structure of the background source is quite similar at the nearby OH 18 cm and HI 21cm frequencies. It should thus be possible to use a comparison between main OH and HI 21cm absorption from a statistically large number of redshifted systems as an independent probe of any evolution in , and Chengalur and Kanekar (2003). We next apply this technique to the absorbers toward PMN J01340931 and B0218+357, albeit using a more conservative dispersion of 3 km/s between OH and HI intrinsic velocities, characterising internal motions within a molecular cloud.
The HI 21cm profile of Fig. 1[A] has the highest signal-to-noise ratio of our spectra (at the same resampled resolution of km/s) and has three clear components. We hence used a three-gaussian template to locate the peak redshifts of the different 21cm absorption components, with the amplitudes, positions and widths of the gaussians all left as free parameters. A similar three-gaussian fit was then carried out to the smoothed and resampled 1665 and 1667 MHz spectra, with the difference that the velocity widths here were fixed to those obtained from the 21cm fit and only the amplitudes and positions of individual components left as free parameters. The 1665 and 1667 MHz fits were carried out simultaneously, to account for the possibility of blending between the components. Note that the original spectral resolution was km/s in all cases and no additional components were seen in any of the spectra. The possibility that strong narrow components might be blended in the lower resolution spectra of Figs. 1 [A] and [B] can thus be ruled out.
Figs. 1[A] and [B] show the fitted gaussians as solid lines, overlaid on the HI and OH spectra. The three fitted 21cm components have peak redshifts , and , while the sums of the 1665 and 1667 MHz frequencies have peak redshifts , and . Comparing these redshifts, component by component, we obtain , and , where and only statistical errors have been included. A weighted average of these values gives . Note that a comparison using an entirely unconstrained six-Gaussian fit to the OH spectrum gives the weighted average . Similarly, the HI 21cm and main OH redshifts in the lens toward B0218+357 are Carilli (2000) and Chengalur and Kanekar (2003), giving . All the above values are consistent with the null hypothesis of no evolution in the different constants. Combining results from the two absorbers (using the constrained fit and a weighted average), we obtain , over , where the second error is due to velocity offsets between HI and OH lines, assuming a velocity dispersion of 3 km/s. Of course, four measurements are far too few for a reliable estimate of this error. However, the fact that the OH and HI redshifts are in reasonable agreement within the measurement errors in all four cases (two of which have errors ) suggests that systematic velocity offsets do not dominate the accuracy of the measurement.
The strong dependence of on and ( and ) implies a sensitivity of or to fractional changes in and from (i.e. a lookback time of Gyrs) to today, where we have added the errors in quadrature (these sensitivities are not independent as we measure ). Assuming linear evolution, these correspond to sensitivities of yr-1 or yr-1, among the best present sensitivities to changes in . For comparison, Ivanchik et al. (2005) obtains for while Tzanavaris et al. (2005) obtains for , at level, using redshifted optical lines. The present radio analysis is not affected by two important sources of systematic error in the optical regime (wavelength calibration and relative isotopic abundances; e.g. Murphy et al. (2003)), although, of course, the optical observations probe a larger redshift range. The primary source of the error in our technique is likely to lie in the velocity dispersion between OH and HI lines and perhaps in blending between weak narrow spectral components. We do not feel that these dominate the present results; deeper observations in the OH and HI lines should help quantify their effects.
While the size of the radio sample is still small, surveys are being carried out that will significantly increase the number of known redshifted OH, HI and HCO+ absorbers. Comparisons between radio lines are thus likely to provide an important independent constraint on changes in fundamental constants in the future.
Acknowledgements.
We thank Bob Garwood and Jim Braatz for help with the data analysis. The National Radio Astronomy Observatory is operated by Associated Universities, Inc., under cooperative agreement with the National Science Foundation. The Australia Telescope Compact Array is part of the Australia Telescope, funded by the Commonwealth of Australia for operation as a National Facility managed by CSIRO.References
- Peik et al. (2004) E. Peik, B. Lipphardt, H. Schnatz, T. Schneider, C. Tamm, and S. G. Karshenboim, Phys. Rev. Lett. 93, 170801 (2004).
- Damour and Dyson (1996) T. Damour and F. J. Dyson, Nucl. Phys. B 480, 37 (1996).
- Murphy et al. (2003) M. T. Murphy, J. K. Webb, and V. V. Flambaum, Mon. Not. R. Astron. Soc. 345, 609 (2003).
- Srianand et al. (2004) R. Srianand, H. Chand, P. Petitjean, and B. Aracil, Phys. Rev. Lett. 92, 121302 (2004).
- Kanekar et al. (2004) N. Kanekar, J. N. Chengalur, and T. Ghosh, Phys. Rev. Lett. 93, 051302 (2004).
- Tzanavaris et al. (2005) P. Tzanavaris, J. K. Webb, M. T. Murphy, V. V. Flambaum, and S. J. Curran, Phys. Rev. Lett 95, 1301 (2005).
- Ivanchik et al. (2005) A. Ivanchik, P. Petitjean, D. Varshalovich, B. Aracil, R. Srianand, H. Chand, C. Ledoux, and P. Boissé, Astron. Astrophys 440, 45 (2005).
- Chengalur and Kanekar (2003) J. N. Chengalur and N. Kanekar, Phys. Rev. Lett. 91, 241302 (2003).
- Darling (2003) J. Darling, Phys. Rev. Lett. 91, 011301 (2003).
- Darling (2004) J. Darling, Astrophys. J 612, 58 (2004).
- Kanekar and Chengalur (2002) N. Kanekar and J. N. Chengalur, Astron. Astrophys 381, L73 (2002).
- Kanekar et al. (2003) N. Kanekar, J. N. Chengalur, A. G. de Bruyn, and D. Narasimha, Mon. Not. R. Astron. Soc. 345, L7 (2003).
- Kanekar and Briggs (2003) N. Kanekar and F. H. Briggs, Astron. Astrophys 412, L29 (2003).
- Wiklind and Combes (1998) T. Wiklind and F. Combes, ApJ 500, 129 (1998).
- van Langevelde et al. (1995) H. J. van Langevelde, E. F. van Dishoek, M. N. Sevenster, and F. P. Israel, Astrophys. J 448, L123 (1995).
- Baan et al. (1992) W. A. Baan, J. Rhoads, K. Fisher, D. R. Altschuler, and A. Haschik, Astrophys. J 396, L99 (1992).
- Drinkwater et al. (1998) M. J. Drinkwater, J. K. Webb, J. D. Barrow, and V. V. Flambaum, Mon. Not. R. Astron. Soc. 295, 457 (1998).
- Liszt and Lucas (2000) H. Liszt and R. Lucas, Astron. Astrophys 355, 333 (2000); H. Liszt (private communication)
- Carilli (2000) C. L. Carilli et al., Phys. Rev. Lett. 85, 5511 (2000).