Large-scale Filamentary Structure around the Protocluster at Redshift 11affiliation: Based on data collected at Subaru Telescope which is operated by the National Astronomical Observatory of Japan.
Abstract
We report the discovery of a large-scale coherent filamentary structure of Ly emitters in a redshift space at . We carried out spectroscopic observations to map the three dimensional structure of the belt-like feature of the Ly emitters discovered by our previous narrow-band imaging observations centered on the protocluster at . The feature was found to consist of at least three physical filaments connecting with each other. The result is in qualitative agreement with the prediction of the ’biased’ galaxy-formation theories that galaxies preferentially formed in large-scale filamentary or sheet-like mass overdensities in the early Universe. We also found that the two known giant Ly emission-line nebulae showing high star-formation activities are located near the intersection of these filaments, which presumably evolves into a massive cluster of galaxies in the local Universe. This may suggest that massive galaxy formation occurs at the characteristic place in the surrounding large-scale structure at high redshift.
1 INTRODUCTION
Theories of structure formation predict that galaxy formation preferentially occurs along large-scale filamentary or sheet-like mass overdense regions in the early Universe and the intersections of such filaments or sheets evolve into dense clusters of galaxies at the later epoch (Governato et al. 1998; Kauffmann et al. 1999; Cen & Ostriker 2000; Benson et al. 2001). Recent deep observations of star-forming galaxies at high redshift, such as Lyman break galaxies (LBGs) or Ly emitters (LAEs), have revealed their inhomogeneous spatial distribution over several tens to a hundred Mpc (Steidel et al. 1998, 2000, hereafter S98, S00; Adelberger et al. 1998; Möller & Fynbo 2001, Shimasaku et al. 2003, 2004; Palunas et al. 2004; Francis et al. 2004; Ouchi et al. 2005). However, their volume coverage or redshift information are still limited. Thus, there is little direct observational evidence of this theoretical prediction.
A large overdensity of LBGs and LAEs was discovered at in the SSA22 and it was regarded as a protocluster of galaxies (S98 and S00). We carried out wide-field and deep narrow-band imaging observations of the SSA22 proto-cluster and discovered a belt-like region of high surface density of LAEs with the length of more than 60 Mpc and the width of about 10 Mpc in comoving scale (Hayashino et al. 2004, hereafter H04). We could not distinguish, however, whether the belt-like feature on the sky is a physically coherent structure or just a chance projection of isolated clumps in space.
There exist two giant extended Ly nebulae (Ly blobs, LABs) in this proto-cluster whose sizes are larger than 100 kpc (S00). We also detected in our narrow-band images 33 LABs with Ly isophotal area larger than 16 arcsec2, which corresponds to 900 kpc2 or kpc at (Matsuda et al. 2004, hereafter M04). It is, however, noted that M04’s LABs are smaller than S00’s two giant LABs. The two giant LABs seem to be rare outstanding objects in the region.
In this letter, we present the redshift distribution of LAEs in the belt-like feature. We use AB magnitudes and adopt a set of cosmological parameters, , and km s-1 Mpc-1.
2 OBSERVATIONS
The targets of our spectroscopy were chosen from the 283 candidate LAEs detected in our narrow-band imaging observations centered on the SSA22 proto-cluster (RA=, Dec=, [J2000.0]) at using the Prime Focus Camera (Suprime-Cam, Miyazaki et al. 2002) of the 8.2 m Subaru telescope. We briefly describe the selection criteria below. Details are given in H04. The 283 candidate LAEs satisfies the following criteria; (1) bright narrow-band magnitude at 4970Å, mag, and (2) large observed equivalent width, Å (or L erg s-1 at ). In addition, we imposed one of the following two criteria; (3) red continuum color, mag, for the objects with brighter than 26.4 mag, or (4) larger equivalent width, Å, for the objects with fainter than 26.4 mag. Here, represents the emission-line free -band magnitude obtained after subtracting the narrow-band flux from the -band flux. Note that LAEs at , which often have continuum spectra of , should have greater than 0.2 mag, since the Ly forest dims the continuum blueward of Ly line of galaxies (e.g. Madau 1995).
The distribution of the 283 LAEs showed the belt-like feature of high surface density running from NW to SE on the sky (the bottom right panel of Figure 1). In order to examine the three-dimensional structure of this belt-like feature, we carried out the spectroscopic observations of the candidate LAEs using Faint Object Camera And Spectrograph (FOCAS, Kashikawa et al. 2002) on the Subaru telescope in the two first-half nights of 29 and 30 October 2003 (UT). The diameter of the field of view of a FOCAS slit mask was . We used 6 slit masks along the belt-like feature (see Figure 1). Out of the 283 LAEs, 122 are located in the area covered by the 6 masks. We prepared the slits for bright 84 of the 122 selected in order of NB magnitudes. We used the 300B grism and the SY47 filter. The typical wavelength coverage was 4700–9400 Å. The slit widths were and the seeing was –. The spectral resolution was Å at 5000 Å, corresponding to a velocity resolution of 600 km s-1. The pixel sampling was 1.4 Å in wavelength (no binning) and in spatial direction (3 pixel binning). Exposure times were 0.7–1.5 hours per mask. We reduced the data using the IDL program developed by FOCAS team and IRAF. We used both Th-Ar lamp spectra and night sky lines in wavelength calibration. The rms of fitting error in wavelength calibration was smaller than 2 Å. We used the standard star Feige 110 in flux calibration.
3 RESULTS AND DISCUSSION
Among the 84 targeted LAEs, 56 spectra show a single emission-line with a signal-to-noise ratio (S/N) per resolution element (10 Å) larger than 5. The typical S/N of the 56 emission-lines is about 11. The most plausible interlopers of the emission-lines are [OII]3727 at . In this case, the [OIII]4959,5007 should be detected, since the wavelength coverage of most spectra extends longer than 6700Å. Most of star-forming galaxies at low redshifts have [OIII]5007/[OII]3727 ratio larger than 0.15 (e.g. Jansen et al. 2000). Since the upper limits for [OIII]5007/[OII]3727 ratios are smaller than 0.15 for our spectra, there is no evidence for contamination of [OII] emission-line galaxies. Therefore, we identify the single emission-lines as Ly with high confidence. The mean redshift of the 56 identified LAEs is and the redshift dispersion is ( km/s). We stacked the observed frame spectra of remaining 28 unidentified objects with emission-lines with S/N. The stacked spectrum shows a significant double-peak emission-line, whose profile is similar to the shape of the redshift histogram of the 56 identified LAEs. Accordingly, it is highly probable that a large fraction of the unidentified LAEs is also located in the same structure at .
Redshifts of the LAEs are not the exact measure of the Hubble flow or the spatial distribution due to their peculiar velocities. In fact, peculiar velocities are considered to be the dominant source of errors in the spatial distribution of LAEs111We note that there are differences between the redshifts of Ly emission-lines and those of other nebular lines which are expected to be better tracers of the systemic redshift of galaxies (Adelberger et al. 2003). Since neutral hydrogen and dust in galaxies tend to absorb the blue side of the Ly emission-lines, the peak of Ly emission-lines apparently shifts to higher redshifts. According to Adelberger et al. (2003), the excess and the rms scatter of redshifts for Ly emission-line for LAEs are and , respectively. This scatter is smaller than the predicted peculiar velocity dispersion.. While the peculiar velocity dispersion of galaxies is in the local universe (Zehavi et al. 2002; Hawkins et al. 2003), it is expected to be smaller at high redshifts even in the over-dense regions (Hamana et al. 2001, 2003). Indeed, the predicted pair wise peculiar velocity dispersion of galaxies at in cosmological simulations is (Zhao et al. 2002), which corresponds to a very small redshift dispersion of .
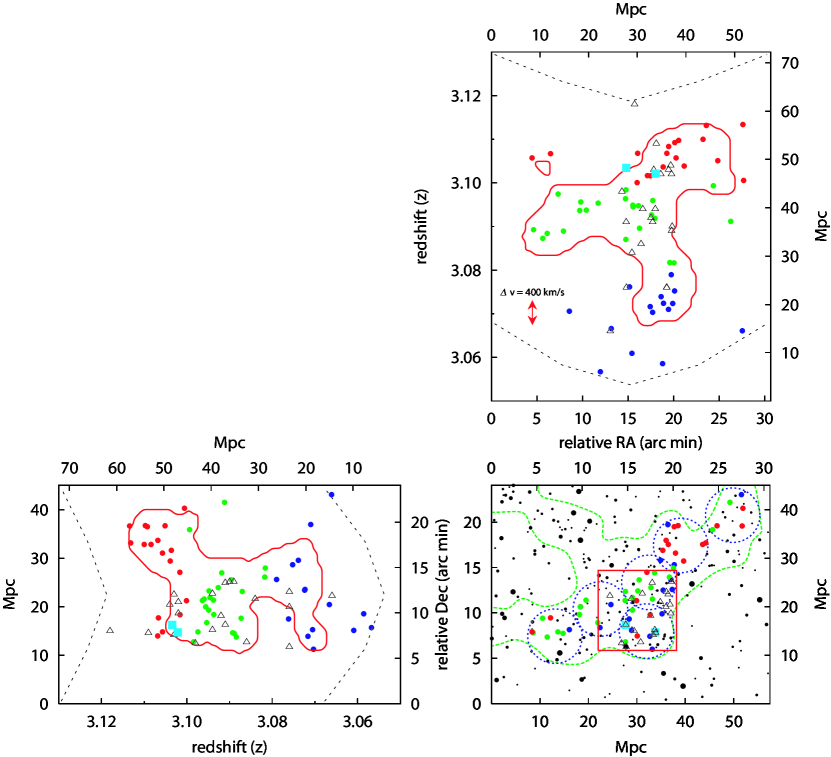
In Figure 1, we plot the resultant three dimensional distribution of the 56 LAEs, together with the projected distribution. We can see that the belt-like feature seen in the projected distribution consists of a filamentary structure running from (RA[arcmin], Dec[arcmin], Redshift[])(25, 18, 3.108) to (5, 8, 3.088) and another concentration around (19, 14, 3.074). In order to compute the volume density of the LAEs, we convolved the spatial distribution of the 56 LAEs with a Gaussian kernel with Mpc, which is comparable to the redshift dispersion due to the predicted peculiar velocity dispersions, km s-1. By drawing the projected contour of volume density of , we identified three filaments connecting with each other with the intersection at around (16, 11, 3.094). The length of each filament is about 30 Mpc and the width is about 10 Mpc in comoving scale. This is the largest coherent filamentary structure mapped in three dimensional space at . In the central region, we also plot in Figure 1 the 21 LBGs in Steidel et al. (2003) whose Ly emission redshifts lie in the same redshift range of our narrow-band imaging observations, . These LBGs seem to be concentrated near the intersection of the filaments of LAEs.
Although our spectroscopic observations are not complete yet, we tried to constrain the three-dimensional over-density of these filaments using the same Gaussian kernel above. The highest number density of the LAEs is . The average number density along the filaments is while the average number density of 283 LAEs in the whole volume sampled by the narrow band filter, Mpc3, is . Note, however, that the number density estimated from the spectroscopy is the lower limit because of the incompleteness in our redshift measurements. If we assume that the remaining 66 LAEs, which are in the fields of 6 slit masks but not considered in the present analysis, have similar spatial distribution, the real number density of the LAEs in the filament would be higher by a factor of 2 and would be 3 times as large as the average value of the entire field.
In Figure 2, we show the composite spectrum of the 56 LAEs which are shifted into the rest frame using their Ly emission redshifts. There is no evidence of [OIII] emission-lines for [OII] emitters at in this spectrum. The rest frame EW of Ly emission-line of the spectrum is about 60 Å, which is roughly consistent with the EW estimated from our narrow-band imaging observations. The continuum flux blueward of the Ly line is 20% dimmer than that redward of the line. However, this value is small compared with the continuum depression found in high S/N composite spectra of LBGs (e.g. Shapley et al. 2003). This may be due to the poor quality of our spectra blueward of Ly emission-line because of the rapid decrease of the transmittance of our SY47 filter at 4600–4900Å. The spectral resolution of is too large to resolve the line profile of Ly, since the typical FWHM of the Ly emission line of LAEs at high redshifts is (e.g. Venemans et al. 2005). We could not find any significant evidence of other emission or absorption lines in the composite spectrum. The observed CIV1549/Ly ratio is smaller than 0.1. This suggests that narrow-line AGNs do not dominate these LAEs; the CIV1549/Ly ratio is typically 0.2 for narrow-line AGNs at (Steidel et al. 2002). Thus the Ly emission of the LAEs is likely to originate from their star-formation activities.
A cosmological numerical simulation of galaxy formation including gas particles suggests that the average star-formation rate (SFR) of galaxies at is nearly independent of their environment while a few galaxies with very large SFR may exist in the highest density regions (Keres̆ et al. 2005). We estimated the SFR of the LAEs from their UV continuum luminosities. The left panel of Figure 3 shows the SFR of all the 283 LAEs as a function of projected surface number density, while the right panel shows the SFR as a function of volume density for the 56 LAEs with spectroscopic redshifts. We do not find any significant correlation. We checked that the dust reddening correction using their continuum colors does not change this trend. The environmental effect thus seems to be weak for the high-redshift LAEs, which is in fact consistent with the prediction of the simulation in Keres̆ et al. (2005).
There are lines of evidence that the LAB1 is a very massive galaxy with intensive star-formation activities. Bright submillimeter source was detected at the position of LAB1 and the SFR estimated from the submillimeter flux is extremely large ( M⊙ yr-1) (Chapman et al. 2001). Not only the dust emission but the CO emission line was detected in LAB1, which implies that the large amount of molecular gas also exists (Chapman et al. 2004). The large mass of the host dark matter halo ( M⊙) was also suggested for LAB1 from the velocity dispersion and the physical extent of Ly emission-line, by assuming that the gas is bound within its gravitational potential (Bower et al. 2004). LAB2 looks similar to LAB1 on the Ly image, and it is likely that the two giant LABs are very massive galaxies in their forming phase. Accordingly, it is interesting to see their location with respect to the filamentary structure.
We measured the redshifts of LAB1 and LAB2 at their surface brightness peaks of the emission line. Their redshifts, for LAB1 and for LAB2, indicate that they are located near the intersection of the three filaments (Figure 1). Cosmological simulations predict that the intersections of large-scale filaments in the early Universe evolve into the present day massive clusters of galaxies. Thus, we can reasonably speculate that the two LABs may be progenitors of very massive galaxies near the center of a massive cluster. The smaller LABs of M04 are also concentrated near the position of the intersection in the projected distribution. It would be interesting to investigate by future observations whether or not the smaller LABs are preferentially located at the intersection of filaments in three dimensional space.
References
- Adelberger et al. (1998) Adelberger, K. L. et al. 1998, ApJ, 505, 18
- Adelberger et al. (2003) Adelberger, K. L., Steidel, C. C., Shapley, A. E. & Pettini, M. 2003, ApJ, 584, 45
- Benson et al. (2001) Benson, A. J., Frenk, C. S., Baugh, C. M., Cole, S., & Lacey, C. G. 2001, MNRAS, 327, 1041
- Bower et al. (2004) Bower, R. G. et al. 2004, MNRAS, 351, 63
- Cen & Ostriker (2000) Cen, R., & Ostriker, J. P. 2000, ApJ, 538, 83
- Chapman et al. (2001) Chapman, S. C. et al. 2001, ApJ, 548, L17
- Chapman et al. (2004) Chapman, S. C. et al. 2004, ApJ, 606, 85
- Francis et al. (2004) Francis, P. J., Palunas, P., Teplitz, H. I., Williger, G. M., Woodgate, B. E. 2004, ApJ, 614, 75
- Governato et al. (1998) Governato, F. et al. 1998, Nature, 392, 359
- Hamana et al. (2001) Hamana, T., Colombi, S., & Suto, Y. 2001, A&A, 367, 18
- Hamana et al. (2003) Hamana, T., Kayo, I., Yoshida, N., Suto, Y., & Jing, Y. P. 2003, MNRAS, 343, 1312.
- Hayashino et al. (2004) Hayashino, T. et al. 2004, AJ, 128, 2073
- Hawkins et al. (2003) Hawkins, E. et al. 2003, MNRAS, 346, 78
- Jansen, et al. (2000) Jansen, R. A., Fabricant, D., Franx, M., & Caldwell, N. 2000, ApJS, 126, 331
- Kashikawa et al. (2002) Kashikawa, N. et al. 2002, PASJ, 54, 819
- Kauffmann et al. (1999) Kauffmann, G., Colberg, J. M., Diaferio, A., & White, S. D. 1999, MNRAS, 307, 529
- Keres̆ et al. (2004) Keres̆, D., Katz, N., Weinberg, D. H. & Davé, R. 2005, MNRAS, 363, 2
- Matsuda et al. (2004) Matsuda, Y. et al. 2004, AJ, 128, 569
- Miyazaki et al. (2002) Miyazaki, S. et al. 2002, PASJ, 54, 833
- Moller & Fynbo (2001) Möller, P., & Fynbo, J. U. 2001, A&A, 372, L57
- Ouchi et al. (2005) Ouchi, M. et al. 2005, ApJ, 620, L10
- Palunas et al. (2004) Palunas, P., Teplitz, H. I., Francis, P. J., Williger, G. M., Woodgate, B. E. 2004, ApJ, 602, 545
- Shapley et al. (2003) Shapley, A. E., Steidel, C. C., Pettini, M. & Adelberger, K. L. 2003, ApJ, 568, 65
- Shimasaku et al. (2003) Shimasaku, K. et al. 2003, ApJ, 566, L111
- Shimasaku et al. (2004) Shimasaku, K. et al. 2004, ApJ, 605, L93
- Steidel et al. (1998) Steidel, C. C. et al. 1998, ApJ, 492, 428
- Steidel et al. (2000) Steidel, C. C. et al. 2000, ApJ, 552, 170
- Steidel et al. (2002) Steidel, C. C. et al. 2002, ApJ, 576, 653
- Steidel et al. (2003) Steidel, C. C. et al. 2003, ApJ, 592, 728.
- Venemans et al. (2005) Venemans, B. P. et al. 2005, A&A, 431, 739
- Zehavi et al. (2002) Zehavi, I. et al. 2002, ApJ, 571, 172
- Zhao et al. (2002) Zhao, D., Jing, Y. P. & Börner, G. 2002, ApJ, 581, 876