The vicinity of the galactic supergiant B[e] star CPD from near- and mid-IR long baseline spectro-interferometry with the VLTI (AMBER and MIDI)
Abstract
We present the first spectro-interferometric observations of the circumstellar envelope (CSE) of a B[e] supergiant (CPD), performed with the Very Large Telescope Interferometer (VLTI) using the beam-combiner instruments AMBER (near-IR interferometry with three 8.3 m Unit Telescopes or UTs) and MIDI (mid-IR interferometry with two UTs). Our observations of the CSE are well fitted by an elliptical Gaussian model with FWHM diameters varying linearly with wavelength. Typical diameters measured are mas or AU (adopting a distance of kpc) at , and mas or AU at . We show that a spherical dust model reproduces the SED but it underestimates the MIDI visibilities, suggesting that a dense equatorial disk is required to account for the compact dust-emitting region observed. Moreover, the derived major-axis position angle in the mid-IR () agrees well with previous polarimetric data, hinting that the hot-dust emission originates in a disk-like structure. Our results support the non-spherical CSE paradigm for B[e] supergiants.
1 Max-Planck-Institut für Radioastronomie, Auf dem Hügel 69, 53121 Bonn, Germany
2 Observatoire de la Côte d’Azur, Gemini, CNRS UMR 6203, Avenue Copernic, 06130 Grasse, France
3 Dept. of Physics and Astronomy, P.O. Box 26170, University of North Carolina at Greensboro, Greensboro, NC 27402–6170, USA
4 Laboratoire Universitaire d’Astrophysique de Nice (LUAN), CNRS UMR 6525, UNSA, Parc Valrose, 06108 Nice, France
1. Introduction
CPD is a poorly-studied object, for which McGregor et al. (1988) suggested a distance of kpc, assuming that it belongs to the Carina OB association. A high reddening and the presence of CO emission bands at makes it compatible with the supergiant B[e] (sgB[e]) class. Zickgraf (2003) obtained high-resolution optical spectra exhibiting double-peaked emission lines that are suggestive of a flattened CSE geometry, typical for sgB[e] stars. However, the physical parameters of neither the star nor its CSE have been studied in detail yet.
2. Results
We report here our results on CPD based on recent (Dec/2004 - Feb/2005) spectro-interferometric observations performed with the VLTI instruments AMBER (e.g., Petrov et al. 2003) and MIDI (e.g., Leinert et al. 2004).
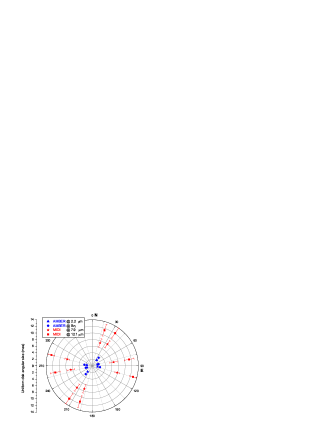
Figures 1 and 2 show the spectra and visibilities obtained with AMBER and MIDI, respectively. CPD is resolved in both spectral regions at all projected baselines and position angles PA. As a zero-order size estimate these figures also show the uniform disk angular diameters obtained from the visibilities at each spectral channel. Figure 3 (left) shows the as a function of the baseline position angle observed with AMBER and MIDI. The measured sizes are clearly different on the 4 spectral channels chosen (, Br line, , and ); in particular, the mid-IR sizes are much larger than those in the near-IR. Indications of a flattened CSE is more evident in the near-IR than in the mid-IR but, as we will show in Sect. 3., both AMBER and MIDI observations suggest a non-spherical CSE.
The AMBER observations show a zero closure phase (Fig. 3 right) at all wavelengths (within the noise level of a few degrees). This is a strong indication that the near-IR emitting regions (continuum and Br line) have an approximately centrally-symmetric intensity distribution.
Since sgB[e] stars are thought to have non-spherical winds, we expect an elongated shape for their CSE, unless the star is seen close to pole-on. Hereafter, we show that both AMBER and MIDI observations can indeed be well reproduced by an elliptical Gaussian model for the CSE intensity distribution, corresponding to visibilities of the form:
| (1) |
where and are the spatial-frequency coordinates, is the major-axis FWHM of the intensity distribution (image plane), and is the ratio between the minor and major axes FWHM (). Since, in general, forms an angle with the North direction (towards the East), and should be replaced in Eq. 1 by () and (), respectively. A preliminary analysis of at each individual showed that and can be considered independent on within a given spectral band ( or ). On the other hand, the size varies with , as one can see from the curves in Figs. 1 to 3.
2.1. Size and geometry in the band
We interpret the AMBER observations in terms of an elliptical Gaussian model (Eq. 1) with a chromatic variation of the size. The curves in Fig. 1 suggest a linear increase of the size within this part of the band. In addition, the AMBER visibilities decrease significantly inside Br, indicating that the line-forming region is more extended than the region responsible for the underlying continuum. Based on these considerations, we adopted the following expression for the major-axis FWHM:
| (2) |
where is the major-axis FWHM at a chosen reference wavelength , and is the slope of . The size increase within Br is modelled by a Gaussian with an amplitude and FWHM , centered at . Figure 1 shows a rather good fit of this model to the observed visibilities both in the continuum and inside Br. The parameters derived from the fit are listed in Table 1.

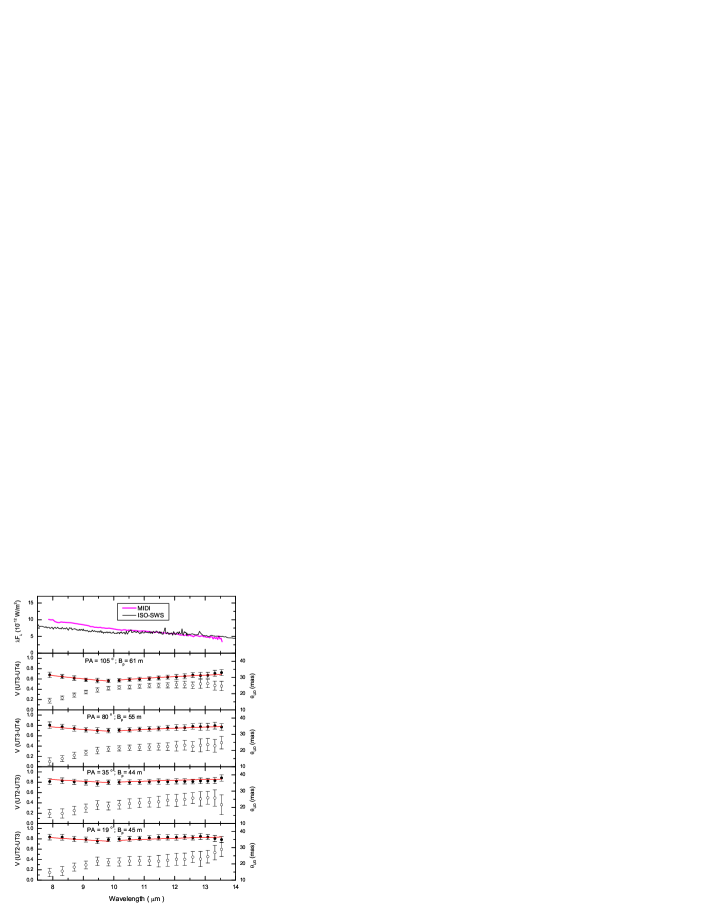

2.2. Size and geometry in the band
Similarly to the analysis of the AMBER visibilities, we interpret the MIDI observations of CPD in terms of an elliptical Gaussian model (Eq. 1) with a size varying linearly with as given in Eq. 2 (for the analysis of the MIDI data the parameter is set to zero). Additionally, since shows a stronger -dependence between 7.9 and 9.8 compared to the region between 10.2 and 13.5 (see Fig. 2), we performed an independent fit for each of these two spectral regions. This elliptical Gaussian model provides a good fit to the MIDI visibilities as also shown in Fig. 2. The parameters corresponding to the fit in the two spectral regions within the band are listed in Table 1.
| Parameter | AMBER | MIDI () | MIDI () |
|---|---|---|---|
| () | 2.2 | 8.0 | 12.0 |
| major axis (mas) | 0.7 | ||
| (mas/) | |||
| position angle (∘) | |||
| minor axis (mas) | |||
| Br: (mas) | – | – | |
| Br: () | – | – | |
| 0.7 | 0.1 | 0.1 |
3. Discussion and conclusions
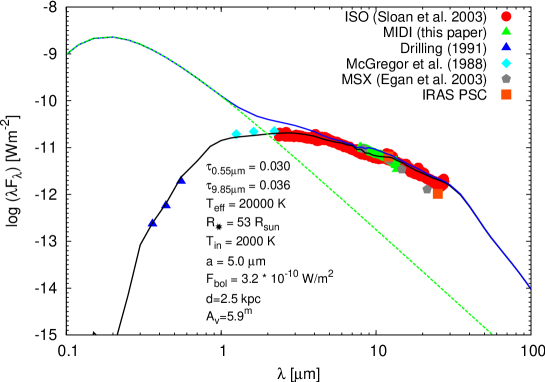
To further investigate the geometry of the CSE, we attempted to simultaneously fit the MIDI visibilities and the spectral energy distribution (SED) using the spherical 1D code DUSTY (Ivezić & Elitzur 1997). To reproduce the featureless spectrum around , we used large silicate grains and/or carbonaceous dust. The nature of the dust and the featureless mid-IR spectrum will be addressed in detail elsewhere. This spherical model in the optically-thin regime can nicely fit the SED (as shown in Fig. 4), but it significantly underestimates the mid-IR visibilities, even when the model parameters are varied considerably. This means that the measured dust-emitting region is too compact ( or ; see Table 1) to be reproduced by a spherical model (even though the SED fit is acceptable). Only a disk-like structure seems to allow the dust to survive within AU from the star (see Kraus & Lamers 2003).
Another argument against a spherical CSE comes from polarization measurements of Yudin & Evans (1998). After correction for the interstellar polarization, Yudin (private communication) estimated an intrinsic polarization position angle . Interestingly, within the error bars this angle is perpendicular to the major-axis PA we derived from the MIDI data (; see Table 1), as is expected from a disk-like dusty CSE.
Thanks to the unprecedent combination of interferometric resolution, multi-spectral wavelength coverage and relatively high spectral resolution now available from the VLTI we measured the size and geometry of the CSE of a sgB[e] star in the near- and mid-IR. We hope that the present work will open the door for new spectro-interferometric observations of these complex and intriguing objects as well as motivate the development of interferometry-oriented and physically-consistent models for such objects. A more complete description of the present work is given by Domiciano de Souza et al. (2005).
Acknowledgments.
A.D.S. acknowledges the Max-Planck-Institut für Radioastronomie for a postdoctoral fellowship. We are indebted to Dr. R. V. Yudin for his calculations on the intrinsic polarization vector.
References
- (1) Domiciano de Souza, A., Driebe, T., Chesneau, O., et al. 2005, A&A, accepted
- (2) Drilling, J. S. 1991, ApJS, 76, 1033
- (3) Egan, M. P., Price, S. D., Kraemer, K. E., et al. 2003, The Midcourse Space Experiment Point Source Catalog (v.2.3)
- Ivezić & Elitzur (1997) Ivezić, Ž., & Elitzur, M. 1997, MNRAS, 287, 799
- Joint IRAS Science Working Group (1988) Joint IRAS Science Working Group 1988, Point Source Catalog
- Kraus & Lamers (2003) Kraus, M., & Lamers, H. J. G. L. M. 2003, A&A, 405, 165
- Leinert et al. (2004) Leinert, Ch., van Boekel, R., Waters, L.B.F.M., et al. 2004, A&A, 423, 537
- McGregor et al. (1988) McGregor, P. J., Hyland, A. R., & Hillier, D. J. 1988, ApJ, 324, 1071
- Petrov et al. (2003) Petrov, R. G., Malbet, F., Weigelt, G., et al. 2003, SPIE proc., 4838, 924
- Sloan et al. (2003) Sloan, G. C., Kraemer, K. E., Price, S. D., & Shipman, R. F. 2003, ApJS, 147, 379
- Yudin & Evans (1998) Yudin, R. V., & Evans, A. 1998, A&AS, 131, 401
- Zickgraf (2003) Zickgraf, F.-J. 2003, A&A, 408, 257