VLTI/AMBER and VLTI/MIDI spectro-interferometric
observations of the B[e] supergiant
CPD††thanks: Based on observations obtained with the
VLTI of the European Southern Observatory (ESO), Chile
We present the first high spatial and spectral observations of the circumstellar envelope (CSE) of a B[e] supergiant (CPD), performed with the Very Large Telescope Interferometer (VLTI). Spectra, visibilities, and closure phase, were obtained using the beam-combiner instruments AMBER (near-IR interferometry with three 8.3 m Unit Telescopes or UTs) and MIDI (mid-IR interferometry with two UTs). The interferometric observations of the CSE are well fitted by an elliptical Gaussian model with FWHM diameters varying linearly with wavelength. Typical diameters measured are mas or AU (adopting a distance of kpc) at , and mas or AU at . The size of the region emitting the Br flux is mas or AU. The major-axis position angle of the elongated CSE in the mid-IR () agrees well with previous polarimetric data, hinting that the hot-dust emission originates in a disk-like structure. In addition to the interferometric observations we also present new optical () and near-IR () broadband photometric observations of CPD. Our spectro-interferometric VLTI observations and data analysis support the non-spherical CSE paradigm for B[e] supergiants.
Key Words.:
Techniques: high angular resolution – Techniques: interferometric – Infrared: stars – Stars: early-type – Stars: emission-line, Be – Stars: mass-loss – Stars: individual: CPD1 Introduction
Supergiant B[e] (sgB[e]) stars are luminous () post-main sequence objects showing the B[e] phenomenon (Lamers et al. 1998): (1) strong Balmer emission lines, (2) low-excitation emission lines of Fe ii, [Fe ii], and [O i], and (3) strong near/mid-infrared (IR) excess due to hot circumstellar dust. Spectroscopic and polarimetric observations suggest that sgB[e] stars have non-spherical circumstellar envelopes (CSE; e.g., Zickgraf et al. 1985; Magalhães 1992). Zickgraf et al. (1985) proposed an empirical model of the sgB[e] CSE that consists of a hot and fast line-driven wind in the polar regions, and a slow, much cooler and denser wind (by a factor of ) in the equatorial region, where dust could be formed. Rapid rotation of the central star seems to play a key role in the origin of the CSE, but a complete explanation of its formation mechanism is still unknown.
To investigate these crucial questions concerning the origin, geometry, and physical structure of the sgB[e] CSE, it is necessary to combine several observing techniques. In particular, the high spatial resolution provided by optical/IR long-baseline interferometry allows us to directly probe the vicinity of these complex objects. In this paper we present the first direct multi-wavelength measurements of the close environment of a Galactic sgB[e] star, namely CPD (WRAY 15-535), using the VLTI with its instruments AMBER and MIDI.
CPD is a poorly-studied object, for which McGregor et al. (1988) suggested a distance of kpc, assuming that it belongs to the Carina OB association. A high reddening and the presence of CO emission bands at makes it compatible with the sgB[e] class. Zickgraf (2003) obtained high-resolution optical spectra exhibiting double-peaked emission lines that are suggestive of a flattened CSE geometry, typical for sgB[e] stars. However, the physical parameters of neither the star nor its CSE have been studied in detail yet.
2 Interferometric observations and data reduction
2.1 VLTI/AMBER (near-IR)
CPD was observed on 2005 February 25 using the VLTI/AMBER instrument (e.g., Petrov et al. 2003) to combine the light from the 8.3 m Unit Telescopes UT2, UT3, and UT4. With an exposure time of 85 ms, 3000 spectrally dispersed interferograms (frames) were recorded on the target and calibrator (HD 90393). This allowed us to obtain spectra as well as wavelength-dependent visibilities and a closure phase in the band with a spectral resolution of between and (including the Br line).
Data reduction was performed with the amdlib software (Millour et al. 2004; Malbet et al. 2005). We checked the consistency of our results by selecting a fixed percentage of frames from the target and calibrator data sets, based on the fringe contrast signal-to-noise ratio. By keeping 50%, 30%, and 10% of the frames with the best SNR, we found that the derived quantities were stable (differences ). Moreover, we also found good agreement between the results from the amdlib software and our own software based on a power spectrum analysis.
2.2 VLTI/MIDI (mid-IR)
We also observed CPD with the VLTI/MIDI instrument (Leinert et al. 2004) on 2004 December 28 and 30. The –band spectrum as well as spectrally dispersed fringes have been recorded between and with a spectral resolution of , allowing us to study the wavelength dependence of the apparent size of CPD in the mid-IR. In total, 4 data sets have been obtained using the UT2-UT3-47 m and UT3-UT4-62 m baselines. Several calibrator stars were observed: HD 37160, HD 50778, HD 94510, and HD 107446.
Data reduction was performed with the MIA (Leinert et al. 2004) and EWS (Jaffe (2004)) packages. While MIA follows the classical power spectrum analysis, in the EWS software the fringes are coherently added after correction for the instrumental and atmospheric delay in each scan. The visibilities derived with both softwares agree within the uncertainties of .
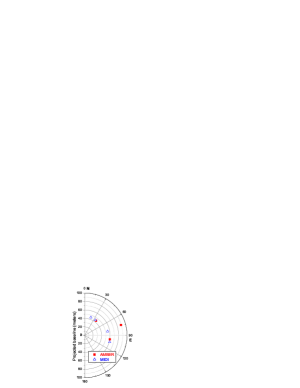
The logs of the AMBER and MIDI observations are given in Table 1, while Fig. 1 shows the projected baseline lenghts and corresponding position angles PA used. In Table 2 we list the uniform disc diameters and observation log for the calibrators. Calibrated visibilities from both AMBER and MIDI observations were obtained using the known uniform disk diameters of the calibrator stars (Richichi et al. 2005), which were observed in the same nights as CPD.
| AMBER () |
| 3 Unit Telescopes |
| night | UT | PA | ||
|---|---|---|---|---|
| (UTC) | baseline | (m) | (∘) | |
| 2005-02-26 | 03:41:21 | UT2-UT3 | 43.5 | 37.8 |
| UT3-UT4 | 59.8 | 98.8 | ||
| UT2-UT4 | 89.4 | 73.6 |
| MIDI () |
| 2 Unit Telescopes |
| night | UT | PA | ||
|---|---|---|---|---|
| (UTC) | baseline | (m) | (∘) | |
| 2004-12-29 | 05:52:12 | UT2-UT3 | 45.2 | 18.5 |
| 07:26:06 | UT2-UT3 | 43.9 | 35.1 | |
| 2004-12-31 | 06:04:03 | UT3-UT4 | 54.8 | 79.6 |
| 08:02:48 | UT3-UT4 | 60.9 | 104.8 |
| AMBER () |
| 3 Unit Telescopes |
| Calibrator | night | ||
| HD number | (mas) | (UTC) | |
| 90393 | 2005-02-26 | 04:38:04 |
| MIDI () |
| 2 Unit Telescopes |
| Calibrator | night | ||
| HD number | (mas) | (UTC) | |
| 37160 | 2004-12-29 | 04:12:26 | |
| 05:29:32 | |||
| 50778 | 2004-12-29 | 06:13:08 | |
| 2004-12-31 | 02:15:59 | ||
| 03:04:33 | |||
| 94510 | 2004-12-29 | 07:47:21 | |
| 2004-12-31 | 06:31:19 | ||
| 07:41:22 | |||
| 107446 | 2004-12-31 | 07:19:17 |
3 Photometric observations
| JD | |||||||||
|---|---|---|---|---|---|---|---|---|---|
| 2450000+ | |||||||||
| 615.29 | 5.76 | 4.87 | 4.02 | 2.73 | |||||
| 640.21 | 5.80 | 4.88 | 4.03 | 2.74 | |||||
| 640.23 | 10.08 | 0.30 | 1.65 | 1.23 | 2.39 | ||||
| 811.57 | 5.74 | 4.86 | 4.02 | 2.73 |
In addition to the VLTI data we also present here new broadband photometric observations of CPD. Optical () and near-IR () photometric observations were obtained quasi-simultaneously on 1997 July 10 at the South-African Astronomical Observatory (SAAO). Additional near-IR observations were obtained on 1997 June 15 and December 28. The 0.75–meter telescope with a single-element InSb photometer (Carter 1990) was used in the near-IR, while the 0.5–meter telescope with a GaAs photometer (Menzies et al. 1991) was used in the optical region.
The data are presented in Table 3. The errors in the tabulated magnitudes and colors are not greater than 0.02 mag. A number of standard stars were observed during the same nights for calibration.
Our photometric results are very close to a few published observations of the star. Drilling (1991) obtained 3 observations in 1972–1976 (=10.20:, =1.66, =0.41 mag; the colon indicates either a variability suspicion or an uncertainty of over 0.08 mag), and McGregor et al. (1988) obtained near-IR observations on 1983 May 15 (, , mag). The 2MASS data obtained on 2000 January 18 (Cutri et al. 2003) are very similar (, , mag). However, the near-IR fluxes from Swings & Allen (1972) are very different: , , mag. Also, Wackerling (1970) quotes mag and mag111mpg means photographic magnitude, which is usually considered a rough analog of a B-band photometry.. This information is not sufficient to conclude whether any brightness changes occurred in the early 1970s, but it indicates that the optical and near-IR fluxes have been stable for the last 30 years.
Analysis of the available photometric and spectroscopic data for the object and its neighborhood allows us to put some constraints on the basic parameters of the underlying star and the distance toward it, an issue that has never been carefully addressed. The observed set of emission lines in the optical region (H i, He i, Fe ii; Zickgraf 2003, McGregor et al. 1988, Carlson & Henize 1979, and others) suggests that the star has an early B spectral type, which in combination with the large optical colour-indices implies a high reddening (see Table 3). However, the presence of a significant amount of gas and dust in the object’s CSE makes uncertain whether the entire reddening is interstellar. On the other hand, this is most likely the case, because the observed and colour-indices are in agreement with the interstellar reddening slope for the stars in the object’s direction (E/E). If we ignore the possible impact of the CSE gas on the object’s SED, then dereddening with the above colour-index ratio gives E mag and the spectral type B (also in agreement with the spectral line content). Moreover, strong diffuse interstellar bands (at Å and Å) are present in the spectrum, and their strengths are consistent with the E (Herbig 1993).
Adopting the typical galactic total-to-selective interstellar extinction ratio AV/E for early-type stars, we get A mag and the intrinsic visual brightness mag. Such a brightness, in combination with the high reddening, implies a high stellar luminosity. Since a few nearby A-type stars of 9–10 mag have negligible reddenings, there is almost no interstellar extinction in the object’s direction closer than kpc. Even at such a distance, CPD2874 would be a supergiant (). An upper limit for the distance ( kpc) is set by the Humphreys-Davidson luminosity limit (, Humphreys & Davidson 1979). Thus, the most probable range for the object’s distance is kpc. It is difficult to constrain it better due to the unknown contribution of the CSE gas to the star’s brightness, possible anomalous extinction by the CSE dust, and the absence of high-resolution spectroscopic data that show photospheric lines and allow us to measure their radial velocities. The distance determination using galactic kinematic models and available radial velocities of the emission lines is uncertain, because the line profiles are double-peaked. The interstellar extinction law in the object’s direction indicates a patchy structure of dust in the line of sight and hampers further improvement of the above distance estimate.
Summarizing the above discussion, we adopt the following parameters for CPD2874: kpc, T K, A mag. They lead to an estimate for the star’s radius of .
4 Results
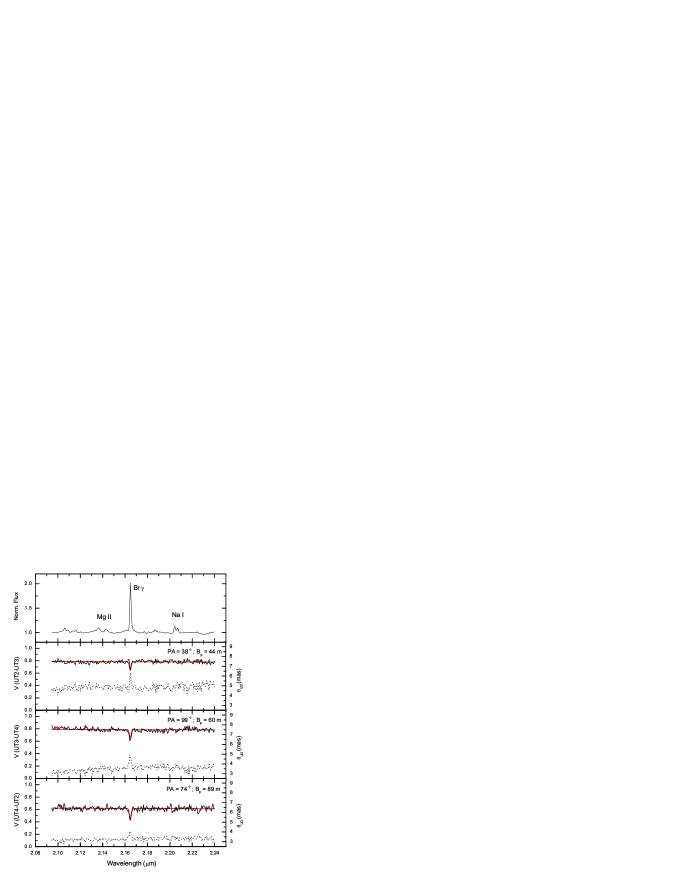
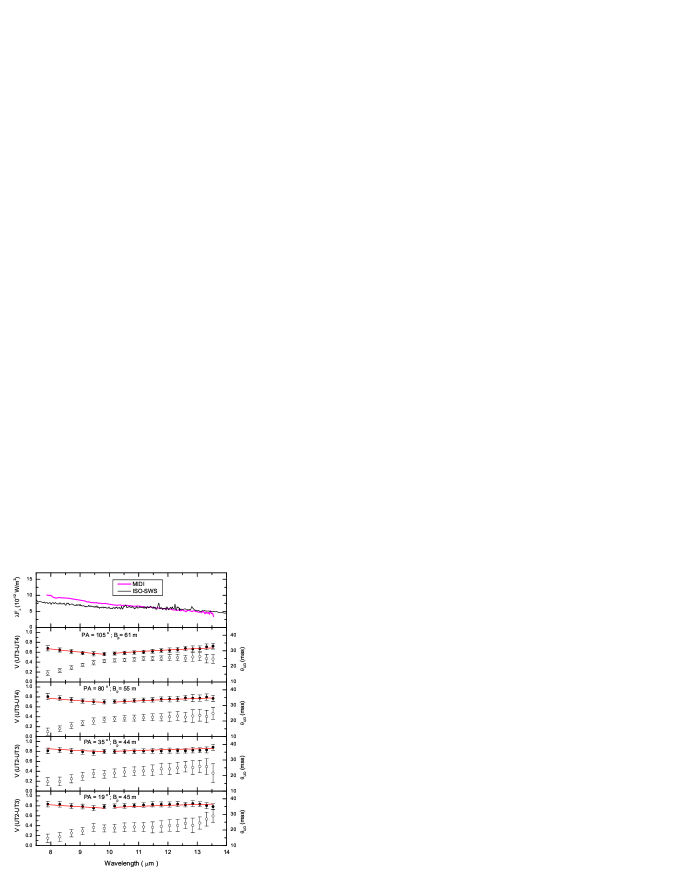
Figures 2 and 3 show the spectra and visibilities obtained with AMBER and MIDI, respectively. CPD is resolved in both spectral regions at all projected baselines and position angles PA. As a zero-order size estimate these figures also show the uniform disk angular diameters obtained from the visibilities at each spectral channel. The size of the region emitting the Br line is larger than the region emitting the near-IR continuum. Moreover, the mid-IR sizes are much larger than those in the near-IR.
The AMBER observations also reveal a zero closure phase (Fig. 4) at all wavelengths (within the noise level of a few degrees). This is a strong indication that the near-IR emitting regions (continuum and Br line) have an approximately centrally-symmetric intensity distribution.
Since sgB[e] stars are thought to have non-spherical winds, we expect an elongated shape for their CSE projected onto the sky, unless the star is seen close to pole-on. Hereafter, we show that both AMBER and MIDI observations can indeed be well reproduced by an elliptical Gaussian model for the CSE intensity distribution, corresponding to visibilities of the form:
| (1) |
where and are the spatial-frequency coordinates, is the major-axis FWHM of the intensity distribution (image plane), and is the ratio between the minor and major axes FWHM (). Since, in general, forms an angle with the North direction (towards the East), and should be replaced in Eq. 1 by () and (), respectively. A preliminary analysis of at each individual wavelength showed that and can be considered independent on within a given spectral band ( or ). On the other hand, the CSE size varies with , as seen from the curves in Figs. 2 and 3.
4.1 Size and geometry in the band
We interpret the AMBER observations in terms of an elliptical Gaussian model (Eq. 1) with a chromatic variation of the size. The curves in Fig. 2 suggest a linear increase of the size within this part of the band. In addition, the AMBER visibilities decrease significantly inside Br, indicating that the line-forming region is more extended than the region responsible for the underlying continuum. Based on these considerations, we adopted the following expression for the major-axis FWHM:
| (2) |
where is the major-axis FWHM at a chosen reference wavelength , and is the slope of . The size-increase within Br is modeled by a Gaussian with an amplitude and FWHM , centered at . Figure 2 shows a rather good fit of this model to the observed visibilities in both the continuum and inside Br. The parameters derived from the fit are listed in Table 4.

4.2 Size and geometry in the band
Similar to the analysis of the AMBER visibilities, we interpret the MIDI observations of CPD in terms of an elliptical Gaussian model (Eq. 1) with a size varying linearly with as given in Eq. 2 (for the analysis of the MIDI data the parameter is set to zero). Additionally, since the curves show a stronger -dependence between 7.9 and 9.8 compared to the region between 10.2 and 13.5 (see Fig. 3), we performed an independent fit for each of these two spectral regions. The adopted elliptical Gaussian model also provides a good fit to the MIDI visibilities as shown in Fig. 3. The parameters corresponding to the fit in the two spectral regions within the band are listed in Table 4.
| Instrument | major axis | position | minor axis | Br: | Br: | ||||
|---|---|---|---|---|---|---|---|---|---|
| (m) | (mas) | (mas/m) | angle | (mas) | (mas)222Corresponding to a FWHM major axis mas and minor axis mas at the center of the Br line (). | (m) | |||
| AMBER | 2.2 | 1.990.24 | 0.530.03 | 1.80.1 | 1.20.1 | 1.80.2 | 0.7 | ||
| MIDI () | 8.0 | 10.10.7 | 2.580.41 | 0.760.11 | 7.71.0 | 0.1 | |||
| MIDI () | 12.0 | 15.30.7 | 0.450.22 | 0.800.10 | 12.21.1 | 0.1 |
5 Discussion and conclusions
Our analysis of the VLTI spectro-interferometric data presented in Sect. 4 supports the hypothesis of a non-spherical CSE for sgB[e] stars.
In particular, the MIDI observations suggest that the hot-dust emission originates in an elongated structure (probably in an equatorial disk), which is in agreement with previous polarization measurements from Yudin & Evans (1998). After correction for the interstellar polarization, Yudin (private communication) estimated an intrinsic polarization position angle . Interestingly, within the error bars this angle is perpendicular to the major-axis PA we derived from the MIDI data (; see Table 4), as is expected from a disk-like dusty CSE. Under the disk hypothesis, the measured mid-IR flattening (; see Table 4) allows us to estimate an intermediate viewing angle for the non-spherical CSE ().
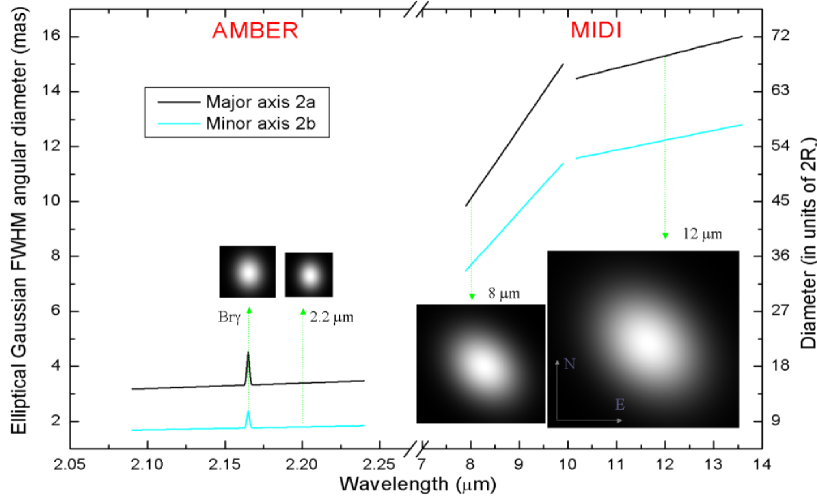
The contemporaneous recording of the AMBER and MIDI data enables us to compare the CSE structure in the near- and mid-IR. As shown in Table 4, the size, flattening, and orientation of the elliptical Gaussian model significantly changes from the to the band. For example, the region emitting the mid-IR flux (333Adopting a distance kpc; see Sect.3. at ) is more than 2.5 times larger than the one emitting the near-IR continuum flux ( at ).
If we correct the influence of the continuum on the visibility measured in Br (Malbet et al. 2005), we estimate the size (minor major axes) of the region responsible for the pure Br emission to be mas (or AU). This size is larger than that of the underlying near-IR continuum, but more than times smaller than the mid-IR emitting region (). Near-IR diameters of AU correspond to (assuming ; see Sect.3). This measurements are compatible the theoretical CSE diameters computed by Stee & Bittar (2001) for a classical Be star, though our data show a larger difference between the Br and continuum sizes.
The differences in flattening and position angle of the elliptical models fitted to the AMBER and MIDI data are in agreement with the two-component CSE paradigm suggested for sgB[e] stars (Zickgraf et al. 1985). The mid-IR flux is probably solely due to dust emission from an equatorial disk. By contrast, the near-IR continuum flux distribution probably results from a complex interplay among the radiation from the central star, the tail of hot-dust emission ( K), and the free-free and free-bound emission from the fast polar wind and the disk-wind interaction. The Br emission does not necessarily follow the same geometry.
A detailed investigation of the CSE geometry in the near-IR (continuum and Br) requires additional interferometric observations covering a larger range of baselines and position angles. In addition, we believe that further MIDI observations at baselines longer than m should be performed to obtain higher spatial resolution of the innermost parts of the dusty CSE. This would allow one to investigate more deeply how close to the hot central star (T K) the dust is formed.
Moreover, the combination of interferometric resolution, multi-spectral wavelength coverage and relatively high spectral resolution now available from the VLTI, requires de development of interferometry-oriented and physically-consistent models for sgB[e] stars. We hope that the present work will motivate the development of such models, as well as open the door for new spectro-interferometric observations of these complex and intriguing objects.
6 Acknowledgments
A.D.S. acknowledges the Max-Planck-Institut für Radioastronomie for a postdoctoral fellowship. We thank the JMMC-France user-support for information about the ASPRO software. We are indebted to Dr. R. V. Yudin for his calculations on the intrinsic polarization vector.
References
- Carlson & Henize (1979) Carlson, E. D., & Henize, K. G. 1979, Vistas in Astronomy, 23, 213
- (2) Carter, B. C. 1990, MNRAS, 242, 1
- (3) Cutri, R. M., Scrutskie, M. F., Van Dyk, S., et al. 2003, The 2MASS All-Sky Catalog of Point Sources, University of Massachusetts and Infrared Processing and Analysis Center (IPAC/California Institute of Technology)
- (4) Drilling, J. S. 1991, ApJS, 76, 1033
- (5) Herbig, G. H. 1993, ApJ, 407, 142
- (6) Humphreys, R. M. & Davidson, K. 1979, ApJ, 232, 409
- Jaffe (2004) Jaffe, W. 2004, Proc. SPIE, 5491, 715
- Kraus & Lamers (2003) Kraus, M., & Lamers, H. J. G. L. M. 2003, A&A, 405, 165
- Lamers & Pauldrach (1991) Lamers, H. J. G. L. M., & Pauldrach, A. W. A. 1991, A&A, 244, L5
- Lamers et al. (1998) Lamers, H. J. G. L. M., Zickgraf, F., de Winter, D., Houziaux, L., & Zorec, J. 1998, A&A, 340, 117
- Leinert et al. (2004) Leinert, Ch., van Boekel, R., Waters, L.B.F.M., et al. 2004, A&A, 423, 537
- Magalhães (1992) Magalhães, A. M. 1992, ApJ, 398, 286
- (13) Malbet, F., Benisty, M., de Wit, W. J., et al. 2005, A&A, submitted
- McGregor et al. (1988) McGregor, P. J., Hyland, A. R., & Hillier, D. J. 1988, ApJ, 324, 1071
- (15) Menzies, J. W., Marang, F., Laing, J. D., Coulson, I. M., & Engelbrecht, C. A. 1991, MNRAS, 248, 642
- Millour et al. (2004) Millour, F., Tatulli, E., Chelli, A. et al. 2004, Proc. SPIE, 5491, 1222
- Petrov et al. (2003) Petrov, R. G., Malbet, F., Weigelt, G., et al. 2003, Proc. SPIE, 4838, 924
- Richichi, Percheron & Khristoforova (2005) Richichi, A., Percheron, I., & Khristoforova, M. 2005, A&A, 431, 773
- Sloan et al. (2003) Sloan, G. C., Kraemer, K. E., Price, S. D., & Shipman, R. F. 2003, ApJS, 147, 379
- Stee & Bittar (2001) Stee, P., & Bittar, J. 2001, A&A, 367, 532
- (21) Swings, J.-P., & Allen, D. A. 1972, PASP, 84, 523
- (22) Wackerling, L. R. 1970, Mem. RAS, 73, 153
- Yudin & Evans (1998) Yudin, R. V., & Evans, A. 1998, A&AS, 131, 401
- Zickgraf (2003) Zickgraf, F.-J. 2003, A&A, 408, 257
- Zickgraf et al. (1985) Zickgraf, F.-J., Wolf, B., Stahl, O., Leitherer, C., & Klare, G. 1985, A&A, 143, 421