Constraints on the IMF of the first stars
Abstract
Motivated by theoretical predictions that first stars were predominantly very massive, we investigate the physics of the transition from an early epoch dominated by massive Pop III stars to a later epoch dominated by familiar low-mass Pop II/I stars by means of a numerically-generated catalogue of dark matter halos coupled with a self-consistent treatment of chemical and radiative feedback. Depending on the strength of the chemical feedback, Pop III stars can contribute a substantial fraction (several percent) of the cosmic star formation activity even at moderate redshifts, . We find that the three sources tentatively detected in NICMOS UDFs should be powered by Pop III stars, if these are massive; however, this scenario fails to reproduce the derived WMAP electron scattering optical depth. Instead, both the UDFs and WMAP constraints can be fulfilled if stars at any time form with a more standard, slightly top-heavy, Larson IMF in the range .
keywords:
galaxies: formation - cosmology: theory - cosmology: observations - intergalactic medium1 Introduction
In the last few years, the universality of the stellar initial mass function (IMF) has been questioned by the results of theoretical studies, which consistently predict that the first stars (hereafter Pop III stars) had characteristic masses of 100-600 (Omukai & Nishi 1998; Abel, Bryan & Norman 2002; Bromm, Coppi & Larson 2002; Omukai & Palla 2003), about 100 times more massive than those observed today (Larson 2003).
Indeed, the physical conditions in primordial star-forming regions appear to systematically favor the formation of very massive stars. In particular, (i) the fragmentation scale of metal-free clouds is typically (Abel, Bryan & Norman 2002; Bromm, Coppi & Larson 2002) (ii) because of the absence of dust grains the radiative feedback from the forming star is not strong enough to halt further gas accretion (Omukai & Palla 2003). (iii) since the accretion rate is as large as -, the star grows up to within its lifetime (Stahler, Palla & Salpeter 1986; Omukai & Nishi 1998; Ripamonti et al. 2002).
In spite of the significant progresses made by numerical simulations and semi-analytic models, many aspects of primordial star formation remain to be fully understood, the more important of which are the radiative feedback effects which operate during protostellar accretion and which are likely to ultimately set the final stellar mass. By modeling the structure of the accretion flow and the evolution of the protostar, Tan & McKee (2004) have recently shown that radiative feedback becomes dynamically significant at protostellar masses , and are likely to constrain the mass of first stars in the range .
On the other hand, observations of present-day stellar populations show that stars form according to a Salpeter IMF with a characteristic mass of 1 , below which the IMF flattens. Thus, unless the current picture of primordial star formation is lacking in some fundamental physical process, a transition in the modes of star formation must have occurred during cosmic evolution.
The physical processes responsible for this transition, as well as its cosmological consequences, are currently the subject of systematic investigation. In particular, following the early study by Yoshii & Sabano (1980), it has been shown that a key element driving this transition is the metallicity of the star-forming gas (Omukai 2000; Bromm et al. 2001; Schneider et al. 2002, 2003). The fragmentation properties of the collapsing clouds change as the mean metallicity of the gas increases above a critical threshold, (Schneider et al. 2002, 2003). The fragmentation of clouds with proceeds only down to relatively massive () cores, whereas in clouds with lower mass fragments can be formed. Within the critical metallicity range, low-mass cores can form if a sufficient amount of metals are depleted onto solid dust grains, which provide an efficient cooling channel in the high density regime (Schneider et al. 2003; Omukai et al. 2005).
On cosmic scales, the transition between an epoch dominated by the formation of massive Pop III stars to an epoch dominated by the formation of ordinary Pop II/I stars is controlled by the strength of the so-called chemical feedback: the explosions of the first massive supernovae starts to metal-enrich the gas out of which subsequent stellar generations form. In particular, in regions of the Universe where the metallicity exceeds , low-mass stars can form. Chemical feedback self-propagates through the metal enrichment process and therefore depends on many poorly constrained parameters, such as the star formation efficiency at high redshifts, the number of supernovae per stellar mass formed, the efficiency of metal ejection and mixing. In particular, the shape of the primordial IMF governs the number of Pop III stars with masses in the pair-instability supernova range (PISN, Heger & Woosley 2002) 140 - 260 (which contribute to the metal enrichment) relative to that of Pop III stars which end up as massive black holes (which instead do not contribute to the metal enrichment as all the heavy elements are captured by the black hole).
Using a semi-analytic approach, Scannapieco, Schneider & Ferrara (2003) have modeled the probability that a collapsing halo has been impacted by metal-enriched outflows from neighboring halos. Exploring different chemical feedback strengths, they concluded that the transition between the Pop III and Pop II/I dominated star formation epochs is essentially controlled by the spatial distribution of metals. Because metal enrichment is generally inefficient (the filling factor of metals is always found to be ), the transition epoch is extended in time, with coeval Pop III and Pop II/I star formation episodes, and Pop III stars still contributing to the global star formation rate at redshifts . These findings have very important implications for the detection of Pop III stars through their strong Ly emission (Scannapieco et al. 2003) as well as the corresponding pair-instability supernova rate (Scannapieco et al. 2005).
In this work, we investigate the cosmic transition between Pop III and Pop II/I stars following a complementary approach. We use the code PINOCCHIO111http://www.daut.univ.trieste.it/pinocchio. developed by Monaco, Theuns & Taffoni (2002) and Taffoni, Monaco & Theuns (2002) to produce random catalogues of dark matter halos at different redshifts. We then propagate metal enrichment along the hierarchy of mergers of star-forming galaxies to predict the number and mass distribution of metal-free objects, which can host Pop III stars, at each redshift. We then couple these findings to the star formation history (of Pop III and Pop II/I stars) and to the history of cosmic reionization and quantify their interplay through radiative feedback effects which can contribute to the extinction of Pop III stars.
A similar approach has been recently undertaken by Furlanetto & Loeb (2005) with the aim of assessing the plausibility of the double reionization scenario suggested by Cen (2003) as a way to meet both the constraints on the gas neutral fraction implied by observations of Gunn-Peterson troughs in the spectra of distant quasars (Fan et al. 2002, 2003) and on the gas ionized fraction derived by the high optical depth to Thomson scattering measured by the WMAP satellite (Spergel et al. 2003; Kogut et al. 2003).
Here we instead focus on the extinction epoch of Pop III stars which we believe to be regulated by feedback both of radiative and chemical types. We investigate the implications that complementary observations on galaxy number counts at redshifts (Bouwens et al. 2005) and on the history of cosmic reionization (Kogut et al. 2003) set on the transition epoch between Pop III and Pop II/I stars and on the nature of Pop III stars as sources of UV photons contributing to cosmic reionization.
In particular, the detection of galaxies at the highest redshifts is challenging because of the redshifting of UV light into the infrared and the well-known limitations of current IR instruments. In spite of these difficulties, the search for high redshift galaxies, based on the dropout technique, has provided the first tentative detection of galaxies at redshifts beyond (Bouwens et al. 2004), stimulating a re-analysis of the small amount of deep IR data. Bouwens et al. (2005) looked at the prevalence of galaxies at by applying the dropout technique to the wide variety of deep fields that have been imaged with the Near Infrared Camera and Multi-Object Spectrometer (NICMOS) on board of the Hubble Space Telescope. Using an appropriate selection criterion for high- sources, Bouwens et al. (2005) concluded that the number of sources must be three or fewer. When combined with the high optical depth to Thomson scattering inferred from the Wilkinson Microwave Anisotropy Probe (WMAP) satellite (Kogut et al 2003), these data already provide a demanding benchmark for theoretical models.
The paper is organized as follows. In Section 2 we describe the different feedback effects that control the transition from a Pop III to a Pop II dominated star formation epoch. We illustrate the adopted chemical feedback model, predicting the number and mass function of halos which can host Pop III stars at different redshifts. In Section 3, we couple these predictions to a star formation and reionization model. In Section 4 we summarize the observations of galaxy counts at redshifts and discuss how these can be used to set important constraints on the model. Finally, in Section 5 we present the main results and in Section 6 we discuss their implications.
Throughout the paper, we adopt a CDM cosmological model with parameters , , , , and , which lie within the experimental errorbars of WMAP experiment (Spergel et al. 2003). We also use the AB magnitude system222AB magnitudes are defined as AB, where is the spectral energy density within a given passband in units of erg s-1 cm-2 Hz-1.
2 Feedback-regulated transition
At least three types of feedback effects can be relevant to the extinction of the first massive stars: (i) radiative feedback caused by H2 photo-dissociating radiation emitted by the first stellar sources, which can inhibit gas cooling and star formation inside small halos (ii) chemical feedback due to the release of metals and dust in the first Pop III supernova explosions, which pollute the gas out of which subsequent generations of Pop II stars form (iii) radiative feedback due to photo-heating filtering caused by cosmic reionization, i.e. the increased temperature of the cosmic gas suppresses the formation of galaxies below the Jeans mass. A thorough discussion of each of these processes is beyond the scope of this paper and can be found in the recent extensive review by Ciardi & Ferrara (2005).
As a first step, we build up the hierarchy of mergers of dark halos hosting the star formation sites. We use PINOCCHIO code (Monaco, Theuns & Taffoni 2002; Taffoni, Monaco & Theuns 2002) to generate random catalogues of dark matter halos in a hierarchical universe.
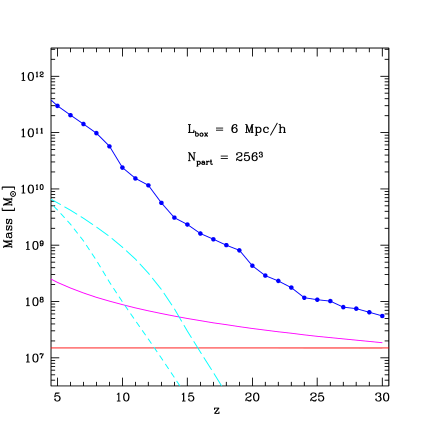
Our reference run has particles within a volume of comoving side 6 Mpc so that the smallest resolved dark matter halos have total mass (in the merger trees only halos with at least 10 particles are considered). Fig. 1 summarizes the details of our reference PINOCCHIO run and shows the redshift evolution of the largest and smallest mass present in the simulation box and of the minimum halo mass that is allowed to form stars. The latter corresponds, at each redshift, to halos with virial temperatures K,
| (1) |
so that stars do not form in halos which rely only on H2 cooling (radiative feedback). The chosen resolution ensures that we can follow the formation of stars in the lowest mass halos at the highest redshift. Due to radiative feedback, the first star-forming halos have a total mass and start to form at . This resolution is appropriate to follow the transition from a Pop III to a Pop II star formation mode around redshift , which is the main scope of this analysis.
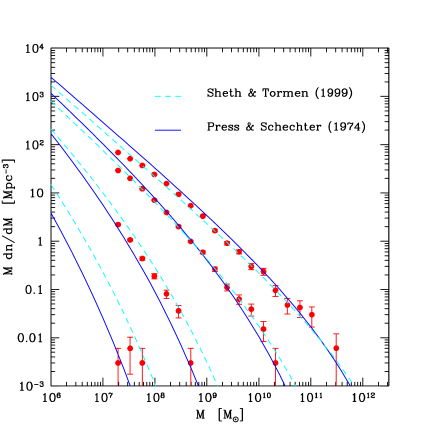
In Fig. 2 we compare the resulting mass function of existing halos at redshifts 30, 20, 10 and 5 in the simulation box, to the analytic predictions of Press & Schechter (1974) and Sheth & Tormen (1999). The errorbars are Poisson errors on the counts in each mass-bin. The agreement is very good down to redshift showing that the chosen resolution ensures completeness in the simulation volume in the redshift range relevant to our analysis.
2.1 Chemical feedback
At each redshift, existing halos which are allowed to form stars ( K) are classified as hosting Pop II (Pop III) stars depending on whether the halo itself or any of its progenitors have (have not) already experienced an episode of star formation, leading to the formation of SN progenitors which then metal-enrich the gas. Note that even a single 200 PISN can enrich the gas within a halo with mass to a metallicity level well above the critical value as,
| (2) |
where, following Heger & Woosley (2002), we have assumed that the mass of metals released in a PISN explosion is 45% of the initial progenitor mass.
This way of taking into account chemical feedback is very conservative as (i) we are assuming that all metals synthesized during a star formation episode remain confined (or are re-accreted) within the host halo and/or (ii) even if a fraction of metals is ejected out of the host halo, the metals that are kept within the potential well are sufficient to pollute the gas within the host system or within any unpolluted halo that the system will later merge with, to a metallicity level larger than . On the other hand, we are neglecting metal pollution from neighboring galaxies through enriched-winds (Scannapieco et al. 2003; Sigward, Ferrara & Scannapieco 2005).
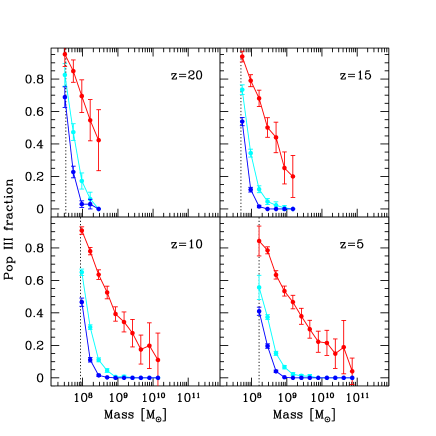
Fig. 3 shows the fraction of halos which can host Pop III stars (hereafter Pop III halos) at different redshifts as a function of their mass. The three different curves correspond to different assumptions on the shape of the primordial IMF. In particular, we randomly classify Pop III halos as SN-forming or BH-forming depending on whether they host stars with masses in the PISN range or outside this range. SN-forming halos are metal-enriched and pollute their descendants. BH-forming halos are not enriched in metals and therefore do not propagate chemical feedback along their subsequent hierarchy of mergers. The fraction of SN-forming halos, , is therefore a free parameter that controls the strength of chemical feedback.
The three curves shown in each panel of Fig. 3 correspond (from bottom to top) to . Each curve represents an average over 50 realizations of the random classification procedure and the errors are Poisson errors on the counts in each mass bin.
When , all Pop III halos are SN-forming and chemical feedback is strong. The total fraction of Pop III halos decreases with time, being at and at ; at all redshifts, Pop III stars are confined to form in the smallest halo mass bins (close to the minimum mass to form stars shown as the vertical dotted line in each panel). For (50% of Pop III halos host SN), the number of Pop III halos at each redshift is larger than the previous case ( at and at ) but Pop III halos are still confined to the smallest mass bins (). Finally, when the strength of chemical feedback is significantly reduced (as only 10% of Pop III halos at each redshift host SN) and therefore the fraction of Pop III halos is dominant at all redshifts, being at and at , not negligible even in halos with the largest mass present in the simulation box at each redshift. Hereafter we only consider and as representative of weak and strong chemical feedback models.
Despite the strength of chemical feedback, Pop III halos continue to form stars even at redshifts as small as , in agreement with the results of Scannapieco et al. (2003). Thus, independently of whether it preferentially propagates through galaxy mergers or through metal-enriched winds, chemical feedback always leads to a smooth transition between a Pop III and a Pop II dominated star formation epoch. Note that the above results depend only on the parameter and on the hierarchy of galaxy mergers, and are totally independent of the star formation efficiency or of the value of critical metallicity for the transition in fragmentation scales of collapsing pre-stellar clouds.
| Pop III | Pop II | ||||||||
|---|---|---|---|---|---|---|---|---|---|
| Model | IMF | IMF | |||||||
| A | 0.1 | 0 | Top-Heavy | 4.862 | 0.2 | Salpeter | 3.602 | ||
| B | 1 | 0 | Top-Heavy | 4.862 | 0.2 | Salpeter | 3.602 | ||
| C | 1 | 0 | Salpeter | 4.235 | 0.2 | Salpeter | 3.602 |
2.2 Photoionization
So far, we have taken into account radiative feedback only through the choice of the minimum halo mass that can host stars. Namely, we have assumed that mini-halos with virial temperatures less than K do not significantly contribute to the cosmic star formation history. However, radiative feedback does affect larger halos, particularly when the universe is approaching the epoch of cosmic reionization. Indeed, the increase in temperature of cosmic gas during reionization will suppress the formation of small galaxies with mass below the Jeans mass. To quantify this effect, we follow the method proposed by Gnedin (2000) and adopt the filtering mass as the characteristic scale below which the gas fraction in star forming objects, hence the fraction of stellar mass, is reduced with respect to the universal value. In particular, before reionization, the average baryon fraction (the ratio of the mass in baryons over the total halo mass) has the universal value while after reionization it can be approximated by the fitting formula (Gnedin 2000),
| (3) |
where the characteristic mass, , is the total mass of objects which, on average, retain 50% of their universal baryon mass, . This characteristic mass is very well approximated by the linear-theory filtering mass, , with
| (4) |
where the Jeans mass is given by
| (5) |
with and the temperature and molecular weight of the cosmic gas.
Here we assume the temperature of ionized regions to be K and we modulate the increase in temperature of the cosmic gas due to reionization with the volume filling factor of ionized regions at the corresponding redshift (see Section 5.1).
Thus, the characteristic mass depends on the thermal history of the gas and it accounts for the finite time required for pressure to influence the gas distribution. The redshift evolution of the filtering mass is shown in Fig. 1 for a model where reionization occurs at redshift (short-dashed line) and (long-dashed line). The filtering mass steeply increases with time and, as expected, its value in the redshift range depends strongly on the reionization history. At redshift , the filtering mass is for the late reionization case, and it is a factor ten larger for the early reionization case.
As can be inferred from Fig. 1 and 3, following reionization, photoionization feedback can significantly suppress the formation of Pop III stars since halos with masses have evaporated at least 50% of their mass.
3 Reionization history
Following Barkana & Loeb (2001), we compute the redshift evolution of the filling factor of HII regions as,
| (6) |
where and are the present-day number densities of hydrogen and baryons ( is the hydrogen mass fraction), and is the production rate of ionizing photons that we can express as,
| (7) |
where is the escape fraction, i.e. the fraction of ionizing photons that is able to escape the host galaxy, is the time-averaged number of ionizing photons emitted per unit stellar mass formed, and is the comoving star formation density,
| (8) |
where is the star formation efficiency, is the baryon fraction given by eq. (3), is the minimum halo mass to form stars (see eq. 1) and is the number density of halos (Pop II and Pop III) at redshift . The parameter also affects the relative strength of the stellar continuum and the Ly line and nebular luminosity of each galaxy. The latter contributions are particularly important for massive Pop III stars.
Finally, the function takes into account the effect of recombinations. Assuming a time-independent volume-averaged clumping factor , common to all HII regions, we can write,
| (9) |
and
| (10) |
where is the hydrogen recombination rate.
For a given reionization history, it is straightforward to compute the optical depth to electron scattering as,
| (11) |
where is the Thomson cross Section and is the number density of free electrons at redshift . In this paper we only consider the evolution of the filling factor of HII regions (). However, for the purpose of computing the optical depth to electron scattering, we assume that and we neglect the contribution of electrons coming from HeIII regions (see also Haiman & Holder 2003). Under these assumptions we can write where is given by eq.(6).
4 Galaxy counts at redshift 10
Bouwens et al. (2005) looked at the prevalence of galaxies at by applying the dropout technique to the wide variety of deep F110W- and F160W-band (hereafter and , respectively) fields that have been imaged with the Near Infrared Camera and Multi-Object Spectrometer (NICMOS). The principal data set is constituted by two 1.3 arcmin2 deep NICMOS parallels taken with the Advanced Camera for Surveys (ACS) Hubble Ultra Deep Field (UDF; each has about orbits data). Complementary shallower fields possessing similar imaging have been analyzed as well. The 5 limiting magnitude for the UDFs is in and in ( aperture). Since these limiting magnitudes are reached only in the deepest regions of the two NICMOS UDFs, we adopt the conservative limiting magnitude (Bouwens, private communication).
The primary selection criterion for high- sources is . Using this criterion, Bouwens et al. (2005) found eleven sources. Eight of these are ruled out as credible sources, either as a result of detection () blue-ward of or because of their colors red-ward of the break (). The nature of the three remaining sources could not be assessed from the data, but this number appears consistent with the expected contamination from low-redshift interlopers. Hence, Bouwens et al. (2005) concluded that the actual number of sources in the NICMOS parallel fields must be three or fewer.
Adopting the same selection criterion as in Bouwens et al. (2005), we compute the number of galaxies detectable in the NICMOS UDFs predicted by our models. Assuming that the three candidates selected by Bouwens et al. (2005) are indeed galaxies, we can set interesting constraints on the models. In particular, for a given chemical feedback strength , we compute the number density of Pop III and Pop II halos at each redshift. We then assume a universal value for the star formation efficiency and escape fraction of ionizing photons and we characterize each stellar population (Pop III and Pop II/I stars) by assuming a specific template emission spectrum.
In the following, we consider two models, A and B, whose details are given in Table 1. We assume two representative chemical feedback strengths ( = 0.1 for model A and = 1 for model B). In both cases, the emission properties of Pop II stars have been computed using a simple stellar population model taken from the GALAXEV library (Bruzual & Charlot 2003). Pop II stars have an initial metallicity of and are assumed to form according to a Salpeter IMF (with masses in the range 0.1 - 100 ). Pop III stars are assumed to be very massive (with masses larger than 100 ) and their emission properties are computed using the stellar spectra of Schaerer (2002), including the nebular continuum emission found to be very important for stars with strong ionizing fluxes333Since the emission spectrum of very massive Z=0 stars is found to be independent of the stellar mass for stars with masses (Bromm, Kudritzki & Loeb 2001; Schaerer 2002), we are not forced to make any assumption about the shape of the IMF of Pop III stars as long as these are assumed to be very massive..
For each model, we then compute the number of sources per unit solid angle with observed flux in the range and as
| (12) |
where is the comoving volume element per unit solid angle and redshift, is the comoving number of objects at redshift with observed flux in the range , given by
| (13) |
Here is the halo formation rate, and the factor converts the number density per unit mass in unit flux interval.
The average flux from a halo of mass at redshift that has formed at is,
| (14) |
where is the template luminosity per unit solar mass for a population of age (the time elapsed between the redshift and ), is the luminosity distance, is the instrumental bandwidth, and are the restframe frequencies corresponding to the observed ones. Finally, is the intergalactic medium (IGM) effective optical depth at between redshift and (see Sect. 2.2 of Salvaterra & Ferrara 2003)
5 Results
We compute the expected number of galaxies detectable in the NICMOS UDFs using eqs. 12-14 and applying the same selection criterion of Bouwens et al. (2005) (, integrated up to the magnitude limit of the survey, ). Assuming that only the three most luminous sources should be above the detection threshold, we derive the maximum allowed value for the star formation efficiency, , corresponding to a given escape fraction of ionizing photons.
The results obtained for models A and B are shown in Fig. 4 in terms of comoving star formation density in Pop III and Pop II stars as a function of redshift. Model C will be discussed in section 5.1.
In each panel, vertically (horizontally) shaded regions represent the range of star formation histories for Pop III (Pop II) stars allowed by the NICMOS-UDFs counts when a value in assumed (see Table 1 for the corresponding values of ). For both models and all the explored values of , the three most luminous objects in NICMOS UDFs are always represented by galaxies hosting Pop III stars, as their strong Ly and nebular emission (Schaerer 2002) is dominant. As a consequence, is restricted to relatively small values, which increase with increasing . Model B, being characterized by the strongest chemical feedback, and therefore by the smallest fraction of halos hosting Pop III stars at redshift (see also Fig. 3), has larger allowed star formation efficiencies than model A.
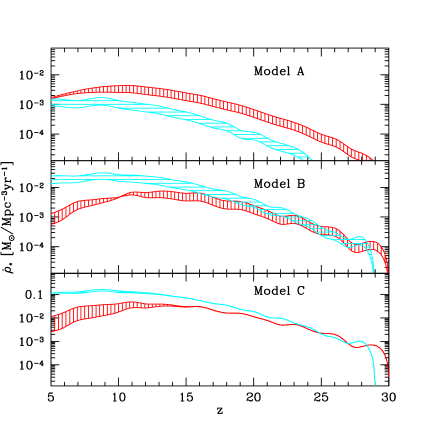
Fig. 4 shows that in model A chemical feedback is very inefficient () and Pop III stars dominate the cosmic star formation history down to redshift . Conversely, model B shows that when chemical feedback is maximally efficient, the star formation density in Pop III stars is sub-dominant at all but the highest redshifts, but Pop III stars still make a significant contribution to the cosmic star formation history down to redshift 5.
Because of the moderate star formation efficiencies implied by the observed NICMOS UDFs counts, radiative feedback is negligible for the most massive galaxies. To evaluate its impact on the predicted star formation densities shown in Fig. 4, we have assumed a clumping factor . For , the corresponding reionization redshifts vary in the range for model A, and in the range for model B.
In model A, radiative feedback effect on the overall Pop III star formation density manifests itself as a progressive decrement of the upper limit (which corresponds to the largest and ) of the shaded region for . In model B, where the star formation efficiencies implied by the observed counts are larger and, at each redshift, Pop III stars are confined to form only in the smallest halos, radiative feedback is more significant; around redshift 10, the lines corresponding to the maximum and minimum Pop III star formation efficiencies cross each other (the highest the star formation efficiency and escape fraction, the strongest the radiative feedback).
Overall, the observed galaxy counts at redshift favor a cosmic star formation history where the transition from Pop III to Pop II stars is governed by strong chemical feedback, with all Pop III halos efficiently propagating metal enrichment to their descendants along the hierarchy of galaxy mergers. In fact, in less efficient chemical feedback scenarios (), the predicted cosmic star formation density is dominated by Pop III stars down to redshift .
5.1 Implications for reionization
Stronger constraints on models A and B come from their corresponding reionization histories. Figs. 5 and 6 show isocontours of redshifts of reionization as a function of the clumping factor and the escape fraction (the star formation efficiency is set by the observed counts at ). We define the redshift of reionization, , as the redshift when the filling factor of ionized regions, given by eq. (6) is . The shaded regions indicate the parameter space which leads to an optical depth to electron scattering within the range observed by the WMAP satellite (Spergel et al. 2003; Kogut et al. 2003), with the dashed line corresponding to the central value.
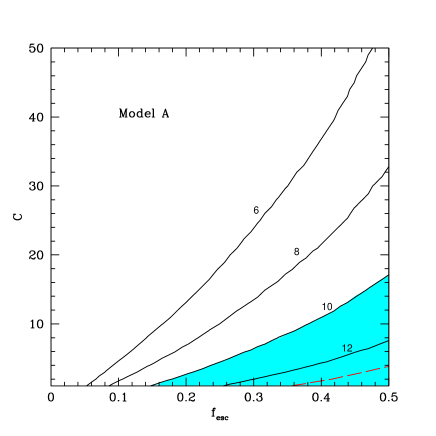
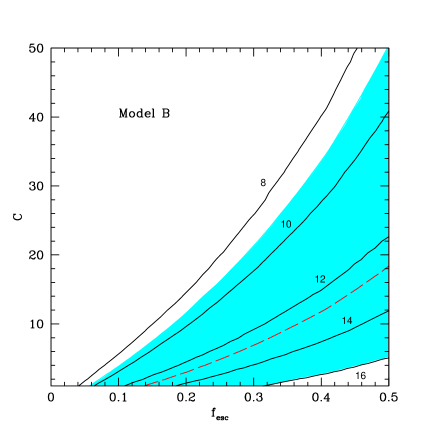
As it can be inferred from the figures, both models lead to reionization histories which are in poor agreement with observations. Indeed, large escape fractions and moderate clumping factors are required to reproduce the observed range of optical depths. Independent observations of the escape fraction give, with few exceptions, values in the range (Ciardi & Ferrara 2005 and references therein) whereas numerical simulations (Gnedin & Ostriker 1997; Iliev, Scannapieco & Shapiro 2005) and semi-analytic models (Madau, Haardt & Rees 1999) predict clumping factors in the range .
Fig. 5 shows that in model A, even assuming an homogeneous IGM (), the escape fraction has to be to be marginally consistent with the observations. In model B, the agreement improves but still requires extreme assumptions on either the escape fraction or the clumping factor: when , the predicted optical depth lies within -1 error from the observed value only if .
Our analysis suggests that it is very hard to reconcile the observed number counts at redshift with the reionization history inferred by WMAP observations if Pop III stars are assumed to be all very massive, with masses . This result is somehow counter-intuitive because metal-free very massive stars have always believed to play an important role in an early epoch of cosmic reionization (Cen 2003; Haiman & Holder 2003; Sokasian et al. 2004, 2004; Venkatesan, Tumlinson & Shull 2003; Wyithe & Loeb 2003; but see also Ciardi, Ferrara & White 2003, and Ricotti & Ostriker 2004 for alternative interpretations).
Still, due to their strong Ly and nebular luminosity, Pop III stars with masses always dominate the predicted galaxy number counts at , even assuming the strongest chemical feedback model. The paucity of candidate objects observed in NICMOS UDFs implies that star formation in halos with K must have occurred very inefficiently. Even if all three objects identified by Bouwens et al. (2005) are truly sources, the contribution of Pop III stars to cosmic reionization is strongly constrained.
The constraints are particularly severe when chemical feedback is less efficient (model A), because Pop III stars can form at redshift in relatively large, and therefore luminous, galaxies. Even if chemical feedback is assumed to be maximally efficient and Pop III stars are confined to form in the smallest halos, their contribution to cosmic reionization is in agreement with observations only for moderate () clumping factors.
Unless an additional type of feedback comes into play, the transition between Pop III to Pop II halos, regulated by chemical and radiative feedback, is very smooth. Thus, to relax the severe upper limits placed on the star formation efficiencies by NICMOS UDFs counts, the emission properties of Pop III stars have to be modified.
In particular, if Pop III stars are assumed to form according to a Salpeter IMF with masses in the range , their Ly and nebular emission is strongly suppressed. In this limit, (see model C in Table 1), all Pop III halos contribute to chemical feedback, , because each burst of star formation leads to the formation of SN progenitors and NICMOS UDFs counts at are dominated by Pop II galaxies. As a consequence, the upper limit on the star formation efficiency set by the observed counts is , much higher than those found for models A and B and independent of the escape fraction.
The predicted evolution of the star formation density in Pop II and Pop III stars is shown in the lowest panel of Fig. 4. Similar to model B, Pop II star dominate the star formation history at all but the highest redshifts. Indeed, in our approach the transition between Pop III and Pop II dominated star formation epochs is controlled only by the strength of chemical feedback () and it is independent of the assumed star formation efficiencies (see section 2.1). However, contrary to model B, the star formation density depends on the escape fraction only indirectly, through the strength of radiative feedback. For this reason, the shaded regions representing the range of allowed star formation densities are not degenerate only after reionization which, for and occurs at redshift (for Pop II stars, which are preferentially hosted in large halos, this effect is negligible).
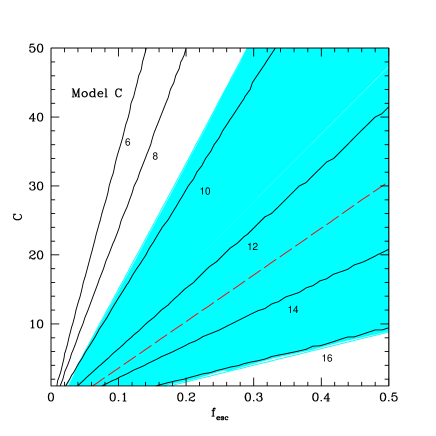
The implications for the history of reionization are summarized in Fig. 7, which shows that model C is in much better agreement with observations than model A and B. The optical depth observed by WMAP can be reproduced with even if the clumping factor is as high as .
Thus, when the observed counts are used to set an upper limit to the allowed star formation efficiency, Pop III stars forming with a conventional IMF are more efficient sources of cosmic reionization than very massive stars. Note that this conclusion is independent on issues related to chemical and radiative feedback. Indeed, both models B and C assume maximally efficient chemical feedback and radiative feedback plays a minor role for model C because the predicted counts are dominated by massive Pop II galaxies, which are largely unaffected by photoevaporation.
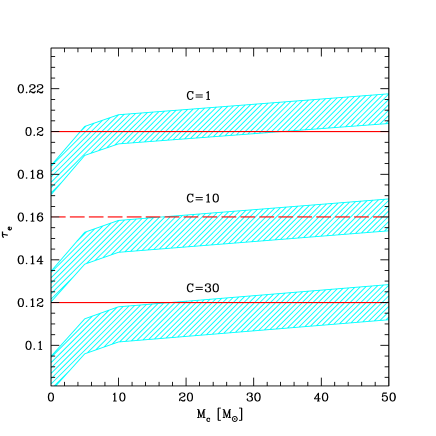
Fig.7 shows that the best-fit value of optical depth implied by WMAP observations, , can only be reproduced by model C with if . If larger values of are to be favored or the observed optical depth will be corrected up-ward in future WMAP data releases, a revision of model C is to be considered.
However, unless the NICMOS UDFs counts have under-estimated by a large factor the number of sources, our results suggest that the only plausible revision of model C is to modify the primordial IMF by increasing the characteristic mass but allowing Pop III stars to form only in the conventional mass range, . In Fig. 8 we show the predicted optical depth as a function of the Pop III characteristic stellar mass, . We assume that the characteristic stellar mass enters in the definition of the stellar IMF as suggested by Larson (1998),
| (15) |
which, for leads to the standard Salpeter IMF.
For a given , we compute considering the proper emission rate of ionizing photons (taken from Table 1 of Ciardi & Ferrara 2005), assuming , three different clumping factors and 30, and that either all 3 or none of the candidates identified by Bouwens et al. (2005) in NICMOS UDFs represent galaxies (upper and lower limits to each shaded region). Fig. 8 shows that the predicted optical depth depends more on the clumping factor than on the assumed value of . If , the predicted is in agreement with the observed values even assuming , consistent with the results shown in Fig. 7. If , WMAP and NICMOS UDFs data can be reconciled only if all three candidates are confirmed to be galaxies and if the characteristic Pop III stellar mass is . Finally, if the observed will be corrected up-ward in future analyses of WMAP data, none of the models considered, independently of the assumed , will be able to reconcile the observed reionization history with the counts at , unless .
6 Discussion
The tentative detections of galaxies in NICMOS UDFs by Bouwens et al. (2005) provides tight constraints on the relative contributions of Pop III and Pop II stars to the galaxy luminosity function. When coupled to the reionization history of the universe implied by the WMAP satellite, this collection of data sets represents already a very demanding benchmark for galaxy evolution models.
Stimulated by these data, we have followed the assembling history of high-redshift galaxies hosting the first stars in a hierarchical model for structure formation. Adopting simple prescriptions for chemical and radiative feedbacks along with available data, we have constrained the evolution of the IMF of the first stars. In particular we find that:
-
1.
Two types of feedbacks need to be considered: (ia) radiative feedback, which suppresses star formation in H2-cooling halos and the formation of low-mass galaxies because of photoionization heating following reionization, and (ib) chemical feedback due to the progressive enrichment of (Pop II) star forming gas by the metals released by the first (Pop III) stellar explosions.
-
2.
If chemical feedback is weak () Pop III stars can form in relatively large halos and dominate the evolution of the cosmic star formation density down to redshift . More realistic scenarios are found assuming , where Pop III stars are confined to form only in the smallest halos at each redshift.
-
3.
The combined effect of radiative and chemical feedbacks fails to suppress the formation of massive Pop III stars at .
-
4.
If Pop III stars are assumed to form with a Top-Heavy IMF, that is with masses , Pop III galaxy are always found to dominate the predicted NICMOS UDFs counts. Because of their strong Ly and nebular luminosities, very tight upper limits on the star formation efficiency in K halos are placed by the paucity of observed counts. The corresponding reionization histories fail to reproduce the observed WMAP optical depths unless uncomfortably large values for the escape fraction of ionizing photons and/or too small values for the IGM clumping factor are assumed.
-
5.
Reionization constraints from WMAP and observed counts in NICMOS UDFs can be reconciled if Pop III stars form according to a Larson IMF with stellar masses in the conventional range and a characteristic mass if the clumping factor is , or if the clumping factor is as large as 30. In the latter case, at least 1 candidate identified by Bouwens et al. (2005) has to be a galaxy at .
Our analysis is based on the assumption that chemical feedback propagates along the hierarchy of galaxy mergers from progenitors to descendants rather than through metal-enriched galaxy outflows (Scannapieco et al. 2003). By adopting this simplified scheme, we are implicitly assuming that (i) even if a fraction of metals is ejected out of the host halo, the metals that are kept within the potential well are sufficient to pollute the gas within the host system or within any unpolluted halo that the system will later merge with, to a metallicity level larger than and that (ii) metal pollution from neighboring galaxies is negligible. In spite of these simplifying assumptions, the resulting Pop III and Pop II star formation histories are consistent with the predictions of Scannapieco et al. (2003). In particular, even assuming a maximally efficient chemical feedback, the transition is always predicted to be very smooth, with Pop III stars which continue to form in the smallest halos at each redshift down to . Interestingly enough, our conclusion is independent of the primordial IMF and/or star formation efficiency. We show that models where all Pop III halos are able to metal pollute their descendants () are favored by observations. The smoothness of the cosmic IMF transition is therefore strictly linked to the inhomogeneous character of the metal enrichment process, independently of how it is implemented in the models.
Even if we have adopted a very approximate description of the thermal evolution of the cosmic gas, we find that radiative feedback following reionization can play an important role in the extinction of Pop III stars. In particular, if reionization occurs at redshifts () the baryon fraction in halos is reduced to 70% (99%) of its universal value () at redshift 10 and to 10% (30%) of this value at redshift 5. Thus, the baryon content in the smallest halos where Pop III stars can form at low redshift is severely limited by radiative feedback. This is strongly related to the epoch of cosmic reionization which, in turn, depends on the degree of inhomogeneities which characterize the cosmic gas. We have parametrized this quantity through a constant clumping factor and we have explored different values of ranging from 1 to 50. However, it is likely that the degree of clumpiness of the cosmic gas varies with time, rising from at high redshift to a few tens at as structures go increasingly non-linear.
Recently, Iliev et al. (2005) have studied the effect of IGM clumping at redshifts , providing a fit to the evolution of the clumping factor (see their Fig. 7) where at redshift 30 and raises to at redshift 10. Adopting this evolution for the clumping factor and we find that models A and B are unable to reproduce the optical depths inferred from WMAP data whereas in model C we find that reionization is complete at redshift 13.5 and that the resulting optical depth is in very good agreement with the observed value.
Thus, our analysis suggests that Pop III stars forming with masses in the same dynamical range as Pop II/I stars, but possibly with higher characteristic stellar mass, appear to be favored by observations. Several scenarios that enable the formation of low-mass stars in metal-free environments have been proposed, among which the bi-modal IMF (Nakamura & Umemura 1999, 2002), enhanced HD-cooling in relic HII regions (Uehara & Inutsuka 2000; Nakamura & Umemura 2002), the influence of a strong UV radiation field due to the vicinity of a very massive star (Omukai & Yoshii 2003), fragmentation in shock-compressed shells induced by the first very massive SN explosions (Mackey, Bromm & Hernquist 2003; Salvaterra, Ferrara & Schneider 2004).
However, all these processes either require very special conditions, generally related to the existence of a previous generation of very massive stars, or have failed to be realized in realistic numerical simulations. In spite of this, observations seem to indicate that either radiative feedback effects during the accretion phase on protostellar cores and/or a combination of the above mentioned processes can lead to the formation of Pop III stars with masses . According to the results of our analysis, the latter contribution to the Pop III stellar IMF must be dominant at least at redshifts .
If this scenario is correct, relics of the low-mass Pop III star formation mode should be still present in our Galaxy, eventually contributing to the lowermost end of the metallicity distribution function (Salvadori, Schneider & Ferrara in prep).
Acknowledgments
We acknowledge the use of PINOCCHIO v 1.0 package written by Pierluigi Monaco, Tom Theuns & Giuliano Taffoni (http://www.daut.univ.trieste.it/pinocchio). This work has been partially supported by the Research and Training Network “The Physics of the Intergalactic Medium” set up by the European Community under the contract HPRN-CT-2000-00126.
References
- [1] Abel T., Bryan G. L., Norman M. L. 2002, Science, 295, 93
- [2] Barkana, R. & Loeb, A. 2001, PhR, 349, 125
- [3] Bouwens R. J. et al. 2004, , ApJ, 616, L79
- [4] Bouwens R. J., Illingworth G. D., Thomson R. I., & Franx M, 2005, ApJ, 624, L5
- [5] Bromm, V., Ferrara A., Coppi P. S., Larson R. B. 2001, MNRAS, 328, 969
- [6] Bromm, V., Kudritzki, R. P. & Loeb, A. 2001, ApJ, 552, 464
- [7] Bromm, V., Coppi P. S., Larson R. B. 2002, ApJ, 564, 23
- [8] Bruzual, G. & Charlot, S. 2003, 344, 1000
- [9] Ciardi, B. & Ferrara, A. 2005, Space Science Reviews, 116, 625
- [10] Ciardi, B., Ferrara, A., White, S. D. M. 2003, MNRAS, 344, L7
- [11] Cen, R. 2003, ApJ, 591, 12
- [12] Furlanetto, S. & Loeb, A. 2005, ApJ in press, (astro-ph/0409736)
- [13] nedin, N., Ostriker, J. 1997, ApJ, 474, 581
- [14] Gnedin, N. 2000, ApJ, 542, 535
- [15] Haiman, Z. & Holder, G. P. 2003, ApJ, 595, 1
- [16] Heger, A. & Woosley, S. 2002, ApJ, 567, 532
- [17] Iliev, I., Scannapieco, E., Shapiro, P. 2005, ApJ, 624, 491
- [17] Kogut, A. et al. 2003, ApJS, 148, 161
- [18] Larson, R. B. 1998, MNRAS, 301, 569
- [19] Mackey, J., Bromm, V., Hernquist, L. 2003, ApJ, 586, 1
- [20] Madau, P., Haardt, F., Rees, M. J. 1999, ApJ, 514, 648
- [21] Monaco, P., Theuns, T. & Taffoni, G. 2002, MNRAS, 331, 587
- [22] Nakamura, F., Umemura, M. 1999, ApJ, 515, 239
- [23] Nakamura, F., Umemura, M. 2002, ApJ, 569, 549
- [24] Omukai, K. & Nishi, R. 1998, ApJ, 508, 141
- [25] Omukai, K. 2000, ApJ, 534, 809
- [26] Omukai, K. & Palla, F. 2003, ApJ, 589, 677
- [27] Omukai, K. & Yoshii, Y. 2003, ApJ, 599, 746
- [28] Omukai, K., Tsuribe, T., Schneider, R., Ferrara, A. 2005, ApJ, 626, 627
- [29] Ricotti, M. & Ostriker, J. P., 2004, MNRAS, 350, 539
- [30] Ripamonti, E., Haardt, F., Ferrara, A., & Colpi, M., 2002, MNRAS, 334, 401
- [31] Salvaterra, R., Ferrara A., Schneider R. 2004, New Astronomy, 10, 11
- [31] Salvaterra, R. & Ferrara A. 2003, MNRAS, 339, 973
- [32] Scannapieco, E., Schneider, R. & Ferrara, A. 2003, ApJ, 589, 1
- [33] Scannapieco, E., Madau, P., Woosley, S., Heger, A., Ferrara, A. 2005, ApJ, in press (astro-ph/0507182)
- [34] Schaerer, D. 2002, A&A, 382, 28
- [35] Schneider R., Ferrara A., Natarajan P., Omukai K. 2002, ApJ, 571, 30
- [36] Schneider R., Ferrara A., Salvaterra R., Omukai K., Bromm V. 2003, Nature, 422, 869
- [37] Sigward, F., Ferrara, A. & Scannapieco, E. 2005, MNRAS, 358, 755
- [37] Sokasian, A., Yoshida, N., Abel, T., Hernquist, L., Springel, V. 2004, MNRAS 350, 47
- [38] Spergel, D. L. et al. 2003, ApJS, 148, 175
- [39] Stahler, S. W., Palla, F., & Salpeter, E. E. 1986, ApJ, 302, 590
- [40] Tan, J. C. & McKee, C. F. 2004, ApJ, 603, 383
- [41] Taffoni, G., Monaco, P. & Theuns, T. 2002, MNRAS, 333, 623
- [42] ehara, H. & Inutsuka, S. 2000, ApJ, 531, L91
- [43] Venkatesan, A., Tumlinson, J., Shull, J. M. 2003, ApJ, 584, 621
- [44] Wyithe, J. S. B. & Loeb, A. 2003, ApJ, 588, L69
- [45] Yoshii, Y., Sabano, Y. 1980, PASJ, 32, 229