Massive Stellar Content of Giant H II Regions in M 33 and M 101111Based on observations made with the NASA-CNES-CSA Far Ultraviolet Spectroscopic Explorer. FUSE is operated for NASA by the Johns Hopkins University under NASA contract NAS5-32985.
Abstract
Far-ultraviolet (900-1200Å) spectral synthesis of nine giant extragalactic H II regions in M 33 and M 101 is performed to study their massive stellar content. Several parameters are quantified, predicted, and compared to the literature: age, stellar mass, IMF slope, number of O-type and Wolf-Rayet stars, H and 5500Å continuum fluxes. The results of this particular technique are consistent with other methods and observations. This work shows that a total stellar mass of a few 103 M⊙ is needed to populate the IMF bins well enough at high masses to obtain accurate results from the spectral synthesis technique in the far-ultraviolet. A flat IMF slope seems to characterize better the stellar line profiles of these objects, which is likely the first sign of a small number statistic effect on the IMF. Finally, the H II region NGC 5461 is identified as a good candidate for hosting a second generation of stars, not yet seen at far-ultraviolet wavelengths.
Subject headings:
stars: early-type — galaxies: stellar content — galaxies: individual (M 33, M 101) – ultraviolet: stars1. Introduction
Giant extragalactic H II regions (GEHR) are important sites of star formation. They are small scale examples of extreme sites of star formation such as local and distant starburst galaxies. Like starburst regions, they contain several distinct star clusters (e.g. Meurer et al., 1995; Hunter et al., 1996) that can interact with each other to potentially enhance or slow down the star formation processes (see review by Tan, 2005, and references therein). They produce the most massive stellar types known (O, B, and Wolf-Rayet) that have the potential to transform the morphological and chemical aspects of galaxies through their feedback (e.g. Heckman et al., 1990; Martin et al., 2002; Tremonti et al., 2004; Calzetti et al., 2004, among others). Most GEHR are recent and quasi-instantaneous events of star-formation (Mas-Hesse & Kunth, 1991, 1999; Schaerer et al., 1999; Stasińska & Schaerer, 1999), as seems to be the case for a starburst, in the sense that most of their massive stars seems to form within less than 2-3 Myr (Pellerin, 2004).
Evolutionary synthesis is a powerful tool to study stellar populations in various environments (e.g. Worthey et al., 1994; Leitherer et al., 1999; Bruzual & Charlot, 2003; Robert et al., 2003). The main goal of evolutionary synthesis is to deduce the global properties of spatially unresolved stellar populations such as their averaged age, mass, and metallicity. The development of evolutionary synthesis codes in the past decade has considerably improved our knowledge of galaxies (e.g. González Delgado et al., 1999; Leitherer et al., 2001; Chandar et al., 2003, among many others). With the recent (and coming) generation of large telescopes such as Keck, Gemini, JWST, and ALMA, this technique will be very useful for our understanding of very distant galaxies and of their evolution through cosmic time.
Nearby GEHR are excellent candidates to test the accuracy of the evolutionary synthesis technique. GEHR like those found in M 33 are close enough to resolve individual stars and to compare their detailed stellar content with what is deduced from synthesis of integrated spectra. In this work, a detailed study of the massive stellar content of several GEHR observed in the far-ultraviolet (900-1200Å; FUV) is presented. The study is based on the spectral synthesis code LavalSB and its recent empirical spectral library in the FUV range (Robert et al., 2003). The synthesis of GEHR observed in M 33 and M 101 will be compared, when possible, to previous works detailing their resolved stellar content.
The following section presents a summary of the data processing. Section 3 describes the evolutionary synthesis code LavalSB used in this work. The synthesis results for each GEHR are detailed in §4, and compared with previous works at various wavelengths. A discussion of specific results is presented in section 5 and the main results are summarized in §6.
2. FUSE Data and Reduction
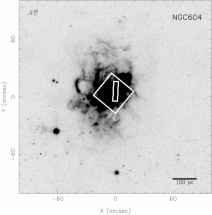
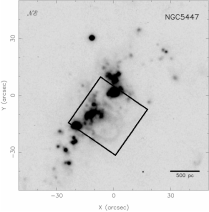
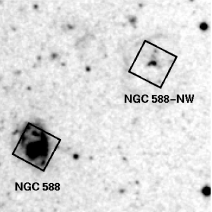
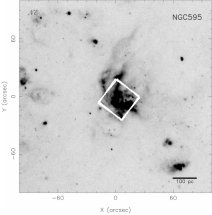
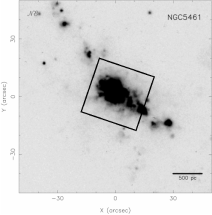
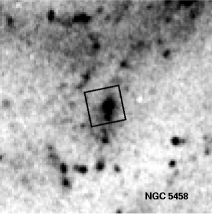
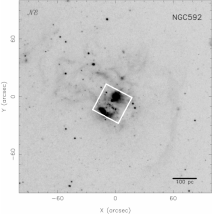
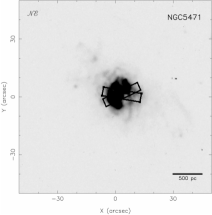
FUV spectrograms of nine GEHR were obtained by the Far Ultraviolet Spectroscopic Explorer (FUSE) telescope (Moos et al., 2000) for various projects. Most data were obtained through the largest aperture (LWRS; 30′′30′′) while some spectrograms were obtained using a smaller aperture (MDRS; 4′′20′′). Aperture locations are displayed in Figure 1. A general description of the FUSE data is reported in Table 1. Data were gathered from the MAST222Multimission Archive at Space Telescope Science Institute; http://archive.stsci.edu/ . public archives. The data were processed with the calfuse pipeline v2.4.2. This version corrects for Doppler shift induced by the heliocentric motion of Earth, event bursts, the walk problem, grating thermal shifts, bad pixels, background noise, distortions, and astigmatism. More information relative to calfuse is available electronically333http://fuse.pha.jhu.edu/analysis/calfuse.html. The output from calfuse comprises eight segment spectrograms for each exposure that correspond to the eight optical paths of the instrument. Each segment covers a different wavelength range, with some of them overlapping (see fig. 2 of Sahnow et al., 2000). First, for each segment, each exposure was combined with a statistical weight based on exposure time. Then the segments that cover the same wavelength regions (roughly 900-1000Å, 1000-1100Å, and 1100-1200Å) were averaged with weights based on their signal-to-noise ratios. Finally, the spectrograms of each wavelength range were simply coadded to obtain one spectrogram covering the entire 905-1187Å range. The spectrograms were then smoothed by a factor of 20 using the IRAF444Image Reduction and Analysis Facility, supported by NOAO and operated by AURA under cooperative agreement with the NSF; http://iraf.noao.edu/ . boxcar task, corresponding to a resolution of about 0.13Å. This last step increases the signal-to-noise ratio without affecting the stellar line profiles. The spectrograms were corrected for redshift. Reddening correction will be discussed in section 4.
3. Stellar population modeling in the FUV
A first work of spectral synthesis below 1200Å has been made by González Delgado, Leitherer, & Heckman (1997) for the O viLyC II feature. The stellar library was based on Copernicus and the Hopkins Ultraviolet Telescope (HUT) with a spectral resolution of 0.2Å. Their work clearly showed that the line profile was sensitive to the age of a stellar population. A new FUV spectral library, based on FUSE data, has recently been added to the spectral synthesis code LavalSB (Robert et al., 2003). This code has been proven to be very powerful for young stellar populations (Pellerin, 2004) and will be used in the present work to deduce the global properties of massive stars in GEHR from their integrated FUV light. LavalSB is a parallel version of Starburst99 (Leitherer et al., 1999). It uses the evolutionary tracks of the Geneva group (Schaller et al. 1992; Schaerer et al. 1993a, 1993b; Charbonnel et al. 1993; Meynet et al. 1994). The stellar population follows a mass distribution based on a chosen stellar initial mass function (IMF) and mode of star formation (instantaneous or continuous). Individual stellar parameters are used to assign the corresponding normalized empirical spectrogram from the FUV library based on relations from Schmidt-Kaler (1982). The normalized library spectrograms are flux calibrated using stellar atmosphere models of Kurucz (1992) for normal stars, and of Schmutz et al. (1992) for stars with extended envelopes. The Kurucz (1992) spectra have been fitted using a Legendre function to remove their low resolution spectral features in order to avoid any confusion with empirical stellar lines from the spectral library. The FUSE stellar library covers from 1003.1 to 1182.678Å with a dispersion of 0.127Å. The library metallicities corresponds to the evolutionary tracks of LavalSB, e.g. Z⊙ for Galactic stars (12log[O/H]8.7; Allende Prieto et al., 2001), 0.4 Z⊙ for LMC stars (12log[O/H]8.3; Russell & Dopita, 1992), and 0.1 Z⊙ for SMC stars (12log[O/H]8.0; Russell & Dopita, 1992).
The most useful stellar indicators in the FUV are the C III blend multiplet centered at 1175.6Å, and the P V doublet at 1118.0 and 1128.0Å. The profiles of these lines show strong variations with age and metallicity of the population, depending on what spectral types dominate in flux. Significant, but more subtle, changes also appear with different IMF parameters. At shorter wavelengths, the O vi 1031.9, 1037.6 and the S iv 1062.7, 1073.0, 1073.5 line profiles show variations with age and metallicity, and possibly with IMF. However, the empirical stellar library used in LavalSB contain stars for which these diagnostic lines are contaminated by interstellar features from Galactic H2 and other atomic transitions. Consequently, stellar lines of O vi and S iv will not be used in the present work since C III and P V lines alone will provide more accurate results. An extensive identification of stellar and interstellar lines contained within the FUSE range can be found in Robert et al. (2003) and Pellerin et al. (2002).
To establish the characteristics of an integrated stellar population in the FUV, the FUSE spectrogram is first normalized and the stellar indicators of C III 1175.6 and P V 1118.0, 1128.0 are compared to the models. The best-fit model is chosen both by eye and by performing a fit. This first step provides information on the age, the metallicity, and the IMF parameters of the population. A standard IMF is defined here as having a slope =2.35 a mass range from 1 to 100 M⊙. Once the age and metallicity of the stellar population are estimated from the normalized FUV spectrogram, the extinction is then evaluated by comparing the observed continuum slope of the flux calibrated data to the one of the best-fit model. The theoretical law from Witt & Gordon (2000) for a clumpy dust shell distribution with an optical depth of 1.5 in the V band is used to derive the internal extinction E(B-V)i. The Galactic extinction is corrected using the law of Seaton (1979). Finally, the stellar mass involved in the system is estimated from the unreddened flux level.
Uncertainties related to the line profile fitting are determined by comparing the different sets of models at a given metallicity. Since LavalSB covers only specific values (0.1 Z⊙, 0.4 Z⊙, Z⊙, and 2 Z⊙), it is not possible at this point to evaluate the full age range that could fit the data. The jumps in metallicity are quite large so the synthetic spectra from the next metallicity value do not always reproduce the observed line profiles and cannot give clues on the age range. Consequently, the age uncertainties given in the present work are underestimated and do not take into account the possibility that the data can be fitted using a slightly different age at a slightly different metallicity.
For a given model, the primary source of error in the estimation of stellar masses and predicted fluxes is usually the FUV flux uncertainty from FUSE, which is usually around 10%. However, in some cases, the age uncertainty gives a larger error bar than the FUSE uncertainty. In every case, the largest uncertainty is given. Also, the IMF slope used to calculate the total stellar mass affects the uncertainty on masses and predicted fluxes. However, these uncertainties are not explicitly included for the best fit model uncertainties. Where possible, parameters of other good-fit models are given to better evaluate the full uncertainties.
4. Massive Stellar Content of GEHR: the FUV Point of View
4.1. NGC 604
NGC 604 is a well-known GEHR within the Local Group galaxy M 33. Several studies found and confirmed the presence of very massive O, B, and Wolf-Rayet (WR) stars (Vilchez et al., 1988; Drissen et al., 1993; Hunter et al., 1996; González Delgado & Pérez, 2000; Bruhweiler et al., 2003; Maíz-Apellániz et al., 2004). At least four distinct starclusters have been identified in this object (Hunter et al., 1996).
The FUSE spectrogram of NGC 604 obtained through the LWRS aperture is shown in Figure 2a. This aperture corresponds to a physical size of 123123 pc2 (1′′=4.1 pc at 840 kpc; see also Fig.1 of Lebouteiller et al., 2005). The aperture includes the Cluster A from Hunter et al. (1996), but not the entire H II region. The spectrogram has a very good signal-to-noise ratio (S/N) of 20 between 1155 and 1165Å that allows to perform a good synthesis with details on the IMF slope. The C III line profile shows a large absorption feature in its blue wing, indicating the presence of evolved late-type O stars. The P V doublet also displays P Cygni line profiles typical of massive stars with strong winds. The line depths of C III and P V suggest a sub-solar metallicity for the stars. Continuous burst models have to be excluded since they produce stellar lines with too faint P Cygni profiles. To obtain a good fit, especially for the C III line profile, a flatter IMF with a slope =1.5-2.2 is better, while a standard IMF with =2.35 could also fit. The best fits are obtained for models having =1.5 and an age of 3.90.1 Myr for 0.1 Z⊙ and 3.30.1 Myr for a 0.4 Z⊙ metallicity. If (IMF)=2.35, then the best-fit ages are a little lower with 3.50.3 Myr for 0.1 Z⊙ models and 3.0 Myr at 0.4 Z⊙. The solution is not unique since there is a degeneracy in the line depth for the models at sub-solar metallicities when the P Cygni profiles are well developed.
González Delgado & Pérez (2000) performed a detailed study of NGC 604 using IUE spectrograms (9.522′′ aperture), optical ground-based data, and H images from the HST, to fully describe this GEHR. From the H Balmer and He I absorption lines, they deduced an age between 3 and 4 Myr for the stellar population with a standard IMF or flatter. A continuous burst cannot fit their emission line ratios. Their IUE spectrograms revealed a population of 3-5 Myr (better fit at 3 Myr) with an IMF slope flatter than 3.3. Vilchez et al. (1988) studied in detail the chemical abundances in M 33 from nebular lines. They measured an oxygen abundance 12log[O/H]=8.51 for NGC 604. All these results are fully consistent with the FUV line profile synthesis. The best-fit model parameters are reported in Table 2, together with the other good-fit models. Note that hereafter, calculations using the models at 0.4 Z⊙ are favored based on the metallicity from Vilchez et al. (1988).
Adopting an instantaneous burst model of 3.3 Myr at 0.4 Z⊙ with an IMF slope =1.5, the observed FUV continuum slope suggests no significant internal extinction E(B-V)i. No internal extinction is needed if a Galactic correction of 0.02 is applied, and E(B-V)i=0.03 is calculated if no Galactic extinction is applied. Using an IMF truncated between 1 and 100 M⊙, the FUV flux level leads to a stellar mass of (72)103 M⊙ within the LWRS aperture. Using an IMF slope of 2.35, the calculated stellar mass is rather (1.40.3)104 M⊙. González Delgado & Pérez (2000) obtained a E(BV)i of 0.1 based on their IUE spectrograms. They also estimate a stellar mass of 0.1-2105 M⊙. Hunter et al. (1996) found, based on optical HST images, an extinction value of 0.08 for Cluster A contained within the LWRS aperture. Their extinction and mass values are slightly higher than those from the FUSE data.
From the stellar population described above with =1.5, several physical parameters can be deduced and compared (see Table 3). First, such a population would theoretically lead to an unreddened H flux of (21)10-11 ergs s-1 cm-2 Å-1, and a continuum level at 5500Å around (31)10-12 ergs s-1 cm-2 Å-1. Changing the IMF does not change these numbers significantly. H fluxes of 4.0 and 3.3 10-11 ergs s-1 cm-2 Å-1 have been measured from HST and ground-based images by González Delgado & Pérez (2000) and Bosch et al. (2002), respectively. Those values are slightly above the FUV predicted values. The differences in H fluxes are consistent with the differences in stellar masses.
According to the H+UV images from HST (see Fig. 2 of González Delgado & Pérez, 2000), several massive stars from Cluster A are co-spatial with the nebular emission. These stars are good candidates to higher extinction and it is likely that their contribution to the FUV flux is significantly lower than at longer wavelengths (even at 1500Å) and then partly explain the differences observed in extinction values at various wavelength ranges. Furthermore, Fig. 2 of Hunter et al. (1996) shows that Cluster B and C contribute significantly to the nebular emission of NGC 604, but they are not taken into account in the total stellar mass derived from FUV since they are not included within the FUSE aperture. Also, a detailed study from Maíz-Apellániz et al. (2004) revealed an extremely complex gas/dust geometry for which around 27% of the ionizing photons might be missing in NGC 604 due to attenuation. In addition to the aperture effect, this obviously contributes to create a discrepancy between the predicted and observed values in the stellar mass and other fluxes parameters.
The FUV synthesis of a 3.3 Myr population with =1.5 at 0.4 Z⊙ predicts that about 9 WR stars (3 WN and 6 WC) should be present in NGC 604. Drissen et al. (1993) obtained ground-based and HST-WF/PC1 images and identified 12 WR or Of candidates, slightly more than the LavalSB predictions. More recently Drissen et al. (2005, in preparation) confirms that there are at least 6 WN and 2 WC stars among them. This WC-to-WN number ratio is not consistent with LavalSB (or Starburst99 neither). To obtain WC/WN1/3, both models propose an age around 4.5-4.7 Myr for the population. However, LavalSB do not include the effect of rotation in evolutionary tracks. By including rotation in the models, the result will be to extend the duration of the WR phase and to increase considerably the number of WN stars, which will fit better the observations (G. A. Vázquez 2005, private communication).
Also, for the population synthesized above for NGC 604, LavalSB predicts that 90 O-type stars (of all spectral types still present at this age). Hunter et al. (1996) estimate from HST/WFPC2 images that about 190 stars brighter than O9.5 V are present in NGC 604, which is higher than the FUV estimation. However, the number of Hunter et al. (1996) may include some B supergiants. If we use an IMF slope of 2.35, the model then predicts roughly the same number of O-type stars but no WR stars (or very few) at 3.0 Myr, which is in disagreement with the observations of Drissen et al. (1993). The comparison between the predicted and observed number of WR stars favors the case of an IMF slope flatter than 2.35.
The FUSE spectrogram of the inner part of NGC 604 obtained through the MDRS aperture is shown is Figure 2b (S/N14). This smaller aperture corresponds to a physical size of 1682 pc2. The stellar line profiles are similar to those obtained with the LWRS aperture, but not exactly the same. The C III and P V line profiles cannot be reproduced as well as for the LWRS data, especially in their blue wings. The models closer to the observed line profiles are those of 3.9-4.1 Myr at 0.1 Z⊙ and 3.3-3.4 Myr using 0.4 Z⊙ models. Interestingly, the MDRS spectrogram of NGC 604 corresponds better to a combination of a synthesized population and the spectrogram of a O8 I LMC star. The blue wings in P V and C III profiles are fitted by the single star spectrogram, while the photospheric portion cannot be fitted by the star, but by a modeled population. This strongly suggests that the number of massive stars within the aperture is low enough to be subject to statistical biases on the stellar IMF, and is not well represented anymore by an analytical IMF. Assuming a stellar population of 3.3 Myr at 0.4 Z⊙ as found previously, the continuum slope for the MDRS spectrogram gives E(B-V)i 0.030.02 if no Galactic extinction is considered. The flux level indicates a stellar mass of about 1103 M⊙ through the MDRS aperture, clearly indicating that the MDRS aperture does not include the whole GEHR.
4.2. NGC 595
As NGC 604, NGC 595 contains multiple star clusters with OB stars (e.g. Drissen et al., 1993; Mas-Hesse & Kunth, 1999; Maíz-Apellániz, 2001). The FUSE spectrogram of NGC 595 is presented in Figure 2c with S/N13. Particularly strong P Cygni profiles are observed in C III and P V. As for a single evolved O star, the C III profile of NGG 595 does not show a blend of photosphericwind features as in an integrated population, but a single well-developed P Cygni profile. In fact, it appears that a synthesized stellar population is unable to reproduce the FUV line profiles. The FUSE spectrograms have then been compared to those of single O stars from the FUV stellar library of LavalSB and it reveals that an O7 I LMC star is the closest match to the spectrogram of NGC 595 (see superimposed thick line spectrogram in Figure 2c). It is obvious here that there are not enough hot stars in NGC 595 to fit an analytical IMF as used in current spectral synthesis. Only a few stars with strong winds seem to dominate the line profiles.
According to LavalSB, O7 I stars appear between 2.5 and 4.0 Myr after an instantaneous burst. At 2.5 Myr, stars slightly brighter than O7 I will probably dominate the FUV flux. Consequently, the O7 I stars in NGC 595 would be consistent with an age of 3.50.5 Myr with a metallicity close to the LMC (0.4 Z⊙). This age is consistent with the works of Malumuth et al. (1996) and Mas-Hesse & Kunth (1999). Assuming a standard IMF, it is still possible to roughly estimate parameters related to the FUV slope and flux level. Adopting a Galactic extinction of 0.04 (NED555The NASA Extragalactic Database (NED) is operated by the Jet Propulsion Laboratory, California Institute of Technology, under contract with the National Aeronautics and Space Administration; http://nedwww.ipac.caltech.edu/ .), a very low internal extinction of E(B-V)i=0.020.02 is found. The stellar mass of NGC 595 is then estimated to be about 1103 M⊙ with very large uncertainties. Previous works in the visible range suggested a higher extinction value of 0.3 (Malumuth et al., 1996; Mas-Hesse & Kunth, 1999; Maíz-Apellániz, 2001) for this GEHR. Mas-Hesse & Kunth (1999) and Malumuth et al. (1996) also estimated a stellar mass of 5-6103 M⊙, which is also significantly higher than the FUV result, but of the same order of magnitude.
Based on LavalSB, the age and mass of NGC 595 suggest that about 10 O stars and 1 or 2 WR should be present in NGC 595. However, HST imaging reveals larger numbers of these stars. Drissen et al. (1993) identified 11 WR/Of candidates and Malumuth et al. (1996) estimated the number of O stars to be 90. Drissen et al. (1993) estimate that there are 2.5 times fewer stars between 15 and 60 M⊙ in NGC 595 than NGC 604, implying that NGC 595 must be about 2.5 times less massive than NGC 604. FUV synthesis gives a factor of 5 between the stellar masses of the two GEHR. Recently, optical spectra from Drissen et al. (2005, in preparation) confirmed the presence of several WR candidates within NGC 595 and classified them. Based on the HST/WFPC2-F170W archival image, the WR stars produce about 30% of the UV luminosity. Obviously, the observed number of WR stars in this object is incoherent with the FUV synthesis point of view.
In an attempt to reproduce the observed FUV spectrogram, simple combinations of individual hot stars are tested. The combinations are comprised of individual late O-type stars (or synthetic models) and WR stars for which 30% of the total FUV flux comes from 1 WN6/7 star and 4 WN7/8 stars, as classified by Drissen et al. (2005, in preparation). However, the resulting fits are poor, with the stellar combinations always giving wind profiles too strong in emission and having too narrow blue absorption. However, the FUSE atlas of WR stars from Willis et al. (2004) revealed spectra of WR stars in general with spectral line profiles that are changing considerably from one type to another. A closer look at this atlas shows that HDE 269927, a WN9 type star from the Galaxy, display line profiles of C III and P V similar to stellar lines of NGC 595. Replacing the WN7/8 spectra used in the previous combinations by the spectra of HDE 269927 gives surprisingly good results. In fact, the combination of spectrograms from a O7 I star (70% of the flux) as well as 1 WN6 and 4 WN9 stars (30% of the flux) reproduces well the FUSE data for NGC 595. This implies two things. First, it appears that the FUV spectra of WR stars show line profiles that change significantly from one spectral type to another, and that probably vary with metallicity as well. Consequently, the few WR spectrograms currently used in the LavalSB spectral library are probably not very representative of their spectral types. Fortunately, these stars do not usually contribute significantly to an integrated stellar population and then do not really affect the synthetic spectra. Second, it seems obvious that the FUV spectra of NGC 595 is dominated by evolved late-type O and WN-late stars. However, one fundamental question remains: how did NGC 595 come to produce a stellar population enhanced in WR stars?
The FUV synthesis of NGC 595 implies that F(H)=(1.30.2)10-12 ergs s-1 cm-2 Å-1. Various values are found in the literature. Bosch et al. (2002) obtained 1.110-11 ergs s-1 cm-2 Å-1, and Kennicutt (1979) measured 8.810-12 ergs s-1 cm-2 Å-1. It is obvious that the FUV synthesis is not accurate in this case, and possibly also that it does not include the entire GEHR.
The FUSE spectrogram of NGC 595 clearly reveals that a stellar population with a stellar mass of a few 103 M⊙ is too small to apply the spectral synthesis technique, at least below 1200Å. Obviously, statistical fluctuations related to a small number of massive stars are not well represented by an analytical IMF. A more detailed discussion on this subject will be given in §5.1
4.3. NGC 592
Because of its fainter H luminosity, NGC 592 is a much less studied GEHR, but not less interesting. The observed FUV spectrogram is shown in Figure 2d, with a rather low S/N of 6. The FUSE aperture contains the entire GEHR (Bosch et al., 2002; Keel et al., 2004). Despite noisy stellar lines, their profiles clearly display extended blue absorption wings from evolved O stars. Comparing both P V 1128.0 and C III 1175.6 lines to the models, it is possible to reproduce their profiles with a 4.00.5 Myr stellar population at Z⊙ metallicity. Models at 0.4 Z⊙ produce too weak P Cygni effects in C III. The spectrogram is too noisy to discriminate between various IMF slopes. From H and H narrow-band images, Bosch et al. (2002) estimated the age of NGC 592 to be more than 4.5 Myr, which is not really compatible with FUV line profiles displaying relatively strong P Cygni features. In term of metallicity, Keel et al. (2004) interpolated a value of 0.5 Z⊙ in [O/H], and Drissen et al. (2005, in preparation) estimated that 12log[O/H]8.4 (i.e. 0.5 Z⊙) from [O III]/H and [N II]/H line ratios. These values are consistent with the FUV synthesis considering that Z⊙ models can cover relatively well a metallicity range from 0.4-0.5 to 1.2 Z⊙ (Pellerin, 2004).
Using a model of 4.0 Myr at Z⊙ and a standard IMF, and assuming a Galactic extinction of 0.042 (NED), an E(B-V)i of 0.070.02 is deduced from the FUV continuum slope. Once the data are corrected for extinction, the stellar mass deduced is (1.10.3)104 M⊙. This mass is similar to that estimated for NGC 604, which is consistent with the fact that the stellar line profiles can be reproduced with a synthesis technique and an analytical IMF, contrary to NGC 595. The FUV flux level implies a unreddened H flux of (2.70.5)10-12 ergs s-1 cm-2 Å-1, which is the exact value by Bosch et al. (2002). Other predicted parameters are reported in Table 3.
4.4. NGC 588
The FUSE spectrogram of NGC 588 is presented in Figure 2e, with a good S/N of 12. The FUSE aperture includes the entire H II region (Bosch et al., 2002; Keel et al., 2004). Models at Z⊙ produce stellar lines definitely too deep compared to the observations. With models at 0.4 Z⊙ metallicity, a good fit can be obtained for a 3.50.5 Myr population with (IMF)2.35. A flatter IMF tends to give better results, but it is hard to really distinguish between various IMF slopes because of the relatively low S/N. Good fits can also be obtained with 0.1 Z⊙ models of 4.51.0 Myr and still with (IMF)2.35. In the literature, ages of 2.8, 4.5, and 4.2 Myr are reported for NGC 588 (Mas-Hesse & Kunth, 1999; Bosch et al., 2002; Jamet et al., 2004, respectively), in general agreement with FUV line profiles. Vilchez et al. (1988) derived a precise oxygen abundance of 12+log[O/H]=8.30 (i.e. 0.4 Z⊙), favoring the models at 0.4 Z⊙. A flat IMF is also favored by Mas-Hesse & Kunth (1999) and Jamet et al. (2004) obtained (IMF)=2.370.16 from a star counting method.
Based on the best-fit model at 0.4 Z⊙, a low internal extinction of at most 0.060.02 is measured, which leads to a stellar mass of (1.30.6)103 M⊙. The mass is higher, (41)103 M⊙, if we consider =2.35. Depending on the extinction law used, E(B-V)i values between 0.11 and 0.08 are measured (Mas-Hesse & Kunth, 1999; Jamet et al., 2004). These same authors obtained stellar masses of 534 and 3000-5800 M⊙, respectively. The smallest value was deduced from IUE data (aperture of 1020′′), and the largest mass is from full field imaging data, which explains the discrepancy. FUV data are in relatively good agreement with imaging data, which suggests that most OB stars of NGC 588 are within the FUSE aperture. With such a mass, the model predicts that F(H)=2.810-12 ergs s-1 cm-2 Å-1, which is in good agreement with the value of 2-310-12 ergs s-1 cm-2 Å-1 measured by Kennicutt (1979) and Bosch et al. (2002). The best-fit model predicts 2 WR stars in NGC 588, which is the exact number found by Jamet et al. (2004) in their HST images with resolved stars.
4.5. NGC 588-NW
A FUSE spectrogram has been obtained in the vicinity of NGC 588 (North-West). From the Digitized Sky Survey image (see Fig. 1), this region corresponds to a relatively compact and small cluster with a faint, extended nebular ring. It was first reported by Boulesteix et al. (1974, their object 281) and also identified in the work of Courtès et al. (1987). The ring suggests that the cluster is more evolved than those synthesized above. The FUSE spectrogram for this cluster is shown in Figure 2f (S/N7). Diagnostic stellar lines do not display P Cygni profiles. Synthetic models do not reproduce well the line profiles. The best fit is obtained for a stellar population around 5-6 Myr old at 0.4 Z⊙, but the line profiles are not properly fitted. A possible alternative is a single star spectrum, as was the case for NGC 595. Then, a Galactic O9.5 III star also consistent with a population of 5-6 Myr, gives a better match than the model but significant discrepancies still exist. This age is consistent with the presence of the faint extended ring seen around NGC 588-NW in the visible range.
To push the synthesis further, a stellar population of 5.5 Myr at 0.4 Z⊙ has been considered and an extinction value around 0 and a stellar mass of about 1103 M⊙ have been roughly estimated for this cluster. This stellar mass is similar to the one obtained for NGC 595. The relatively low mass of the cluster is a logical explanation for why the synthesis technique does not work well. Rough estimations of predicted observable parameters are reported in Table 3.
The study of NGC 588-NW gives some other clues on the evolution of GEHR. First, the FUSE spectrogram of NGC 588-NW reveals the presence of an important stellar population. However, because of its slightly greater age (5-6 Myr instead of 3.5 Myr for NGC 595), the nebular emission is not as strong as for NGC 595 and this region is consequently much less studied. It is likely that NGC 588-NW is representative of what NGC 595 may look like in 2-3 Myr. Second, the GEHR is still young and massive enough at this age not to have dissolved yet into the galaxy background. It would be interesting to search for slightly more evolved GEHR to better study their evolution, such as the dissipation timescale of clusters. This kind of cluster (i.e. still very young but with significantly low nebular emission) may be at the origin of the diffuse UV light in starburst galaxies (Meurer et al., 1995). NGC 588-NW is consistent with clusters of less than 103 M⊙ without O-type stars, as described by Chandar et al. (2005) for the diffuse UV component in starbursts. A more extensive search for this kind of object in local galaxies could settle this issue.
4.6. NGC 5447
NGC 5447 is a GEHR in the spiral galaxy M 101 (7.4 Mpc) that displays several knots of star formation (Bosch et al., 2002). The FUSE spectrogram has a S/N of 12 and is shown in Figure 3a. As shown in Fig. 1, the FUSE aperture does not include all knots. The spectrogram does not show strong wind profiles, suggesting that most O stars have already disappeared. Models at Z⊙ metallicity produce too deep stellar lines compared to the observations. Models at 0.1 Z⊙ cannot reproduce both P V and C III features at the same age. The best-fit model is obtained at 4.50.5 Myr with an IMF slope of 2.35 or flatter. This GEHR has not been extensively studied and no age has been proposed so far for this object. Scowen et al. (1992) deduced an oxygen abundance of 8.3 in 12+log[O/H], compatible with the line depths of P V and C III.
The measured FUV slope for NGC 5447 suggests that E(B-V)i=0. From photographic plates and the Balmer decrement, Smith (1975) estimated an extinction of 0.37, much larger than the FUV value. The FUV flux indicates a stellar mass of (1.20.2)105 M⊙. From FUV synthesis, LavalSB predicts that F(H)=(5.70.9)10-13 ergs s-1 cm-2 Å-1, and an EW(H)=1064Å for NGC 5447. Using photometric data Bosch et al. (2002) measured an H flux of 4.710-12 ergs s-1 cm-2 Å-1, and Kennicutt (1979) obtained a value of 1.610-12 ergs s-1 cm-2 Å-1. Since the GEHR is much more extended than the FUSE aperture (see Fig. 5 of Bosch et al., 2002), the factor 5-10 discrepancies can easily be explained. However, the presence of a second generation of stars contributing to the nebular flux but not to the FUV flux cannot be excluded (see §5.3). For their knot A only, Bosch et al. (2002) obtained that F(H)= 7.510-13 ergs s-1 cm-2 Å-1, suggesting that this knot must be the principal contributor to the FUV flux measured with FUSE. Torres-Peimbert et al. (1989) measured a dereddened equivalent width of 1096Å through a 3.812.4′′ slit, in very good agreement with the FUV predictions and the knot A.
4.7. NGC 5461
NGC 5461 is a very large GEHR (500 pc in diameter) with multiple components in M 101 (Bosch et al., 2002; Keel et al., 2004; Chen, Chu & Johnson, 2005). The FUSE aperture contains most of the H emission and should include most of the massive stellar content (see again Fig. 1). The FUSE spectrogram is shown in Figure 3b, with a S/N of about 7. The C III feature displays a wind profile, implying the presence of giant and supergiant O-type stars. Models at Z⊙ do not reproduce the stellar line depth. The models at 0.1 Z⊙ give a good fit for a 4.00.2 Myr stellar population and an IMF slope flatter than 2.35. A good correspondence is also obtained with 0.4 Z⊙ models at 3.30.2 Myr, still with 2.35. A multiwavelength study from Rosa & Benvenuti (1994) suggests an age between 3.0 and 4.5 Myr, compatible with FUV line profiles. Luridiana & Peimbert (2001) deduced an age between 2.5 and 3.5 Myr based on EW(H), also in general agreement with FUV line profiles. While the age determination method using EW(H) is not a recommended diagnostic (Terlevich et al., 2004), it appears that it still gives good results at a such very young age. More recently, Chen, Chu & Johnson (2005) identified about 12 candidate stellar clusters within NGC 5461 of which half of them are less than 5 Myr old. The other clusters are probably older and do not seem to contribute much to the FUV flux. Abundances ranging from 8.4 to 8.6 in 12+log[O/H] are found in the literature (Torres-Peimbert et al., 1989; Scowen et al., 1992; Rosa & Benvenuti, 1994; Luridiana & Peimbert, 2001). Their observations favor the FUV synthesis models at 0.4 Z⊙.
Comparing with the modeled population of 3.3 Myr at 0.4 Z⊙ and =1.5, the FUV continuum slope needs no extinction correction. The stellar mass is then (1.50.4)104 M⊙. Using a standard IMF slope of 2.35, the calculated stellar mass is then (51)104 M⊙. According to Rosa & Benvenuti (1994), the extinction from the Balmer decrement is 0.23, and using an extinction law especially designed for M 101, they find a stellar mass of 1105 M⊙. According to LavalSB, the FUV stellar population should produce an H flux of (52)10-13 ergs s-1 cm-2 Å-1, while H image data give 6.5 and 3.210-12 ergs s-1 cm-2 Å-1 (Bosch et al., 2002; Kennicutt, 1979, respectively). For this population, the unreddened EW(H) should be about 1200Å. Torres-Peimbert et al. (1989) obtained an unreddened value of 1175Å, in good agreement with LavalSB predictions. The differences between the predicted and observed extinction, nebular flux and stellar mass will be discussed in more details in §5.3.
4.8. NGC 5471
NGC 5471 is another GEHR in M 101 more compact than NGC 5461 and NGC 5447 and may contain about 19 star clusters according to Chen, Chu & Johnson (2005). Most of the H emission of this H II region would have been included within the LWRS aperture of FUSE. Unfortunately, this H II region has been observed using the MDRS aperture (4.020′′), which implies that some OB stars are not included in the FUV spectrogram presented here (see Fig. 1). Also, in the FUSE data, no flux has been obtained in detector 2, which affects the quality of the synthesis since the LiF2A segment (which falls on the missing detector) is important for the S/N of P V and C III lines (see Sahnow et al., 2000). The FUSE spectrogram is shown in Figure 3c with S/N=9. The C III line profile displays no obvious wind feature. The best-fit model is obtained for a stellar population of 4.50.5 Myr at 0.4 Z⊙. At 0.1 Z⊙, a modeled stellar population of 3.5-4.0 Myr can also reproduce the observed line profiles. Because of the noise, a standard IMF as been assumed. Mas-Hesse & Kunth (1999) deduced an age of 2.9 Myr for NGC 5471, which is too young to explain the faint P Cygni profiles observed in the FUV diagnostic lines. Oxygen abundances ranging from 8.0 to 8.2 (0.2-0.3Z⊙ Torres-Peimbert et al., 1989; Rosa & Benvenuti, 1994; Mas-Hesse & Kunth, 1999; Bosch et al., 2002) are found in the literature, which is in good agreement with FUV synthesis.
Adopting the 0.4 Z⊙ best-fit model, the comparison between the observed and modeled continuum slopes indicate a low extinction, smaller than the uncertainties of 0.02. The FUV flux level suggests a stellar mass of (71)104 M⊙ for NGC 5471. Mas-Hesse & Kunth (1999) obtained an extinction of 0.07 in the UV range, which is slightly higher than the FUV extinction. The FUV stellar mass deduced is consistent with the mass of 1.2105 M⊙ from Mas-Hesse & Kunth (1999), considering the smaller aperture used with FUSE. Predictions reported in Table 3 are difficult to compare with the literature because of large differences between apertures. However, the FUV flux prediction is always below the values given from larger apertures (e.g. Kennicutt, 1979; Bosch et al., 2002). Torres-Peimbert et al. (1989) measured a dereddened EW of 575Å for H, consistent with the predictions.
4.9. NGC 5458
NGC 5458 is an H II region smaller and fainter than the previous ones in M 101 and not much studied except for its X-ray source (Wang et al., 1999; Pence et al., 2001; Colbert et al., 2004). The FUSE spectrogram is presented in Figure 3d, and shows a S/N10. The spectrogram displays photospheric profiles without evident signs of winds in both P V and C III features. Sub-solar metallicity models produce stellar line depths too weak compared to the observations. The best-fit model is obtained for a 5.5-6.0 Myr old stellar population at Z⊙. A standard IMF has been assumed since the line profiles are less sensitive to the IMF when evolved O stars have disappeared. The continuum slope indicates a low extinction, below the uncertainties of 0.02. The flux level leads to a stellar mass of (1.10.4)105 M⊙. Other predicted observable parameters for NGC 5458 are reported in Table 3.
5. Discussion
The massive stellar contents of several GEHR have been studied in detail using the FUV spectral synthesis. The section below focuses on the global characteristics of the whole sample to better understand the physics of GEHR in general as well as the synthesis technique in the FUV.
5.1. FUV Synthesis of Small Stellar Populations
Spectral synthesis is a powerful technique to obtain a good estimate of the general characteristics of young integrated stellar populations. However, this technique usually assumes that the stars follow an analytical IMF, and that the stars properly fill each bin of the mass function. But how high does the mass of the population must be in order to be accurately described by an analytical IMF? The FUV is a good wavelength range to estimate this minimal mass for young systems. The FUV is especially sensitive to IMF statistical fluctuations at high masses since only O and B stars produce many photons below 1200 Å. Also, GEHR are very young systems and the disappearance of the most massive stars does not significantly affect the total stellar mass of the system.
From FUV synthesis of GEHR in M 33 and M 101 (§4), it appears that a stellar mass greater than 1103 M⊙ is needed to properly fulfill the IMF bins. As shown by NGC 592, NGC 604 (LWRS), and GEHR in M 101, a stellar mass of 1104 M⊙ does not seem to suffer much of a statistical bias. However, the FUV synthesis of NGC 604 (MDRS), NGC 595, and NGC 588-NW reveals that a stellar mass closer to 1103 M⊙ becomes too low to obtain reliable values of the age and mass of the star cluster because the stellar line profiles are not those of a standard modeled population, but those of a mix of a limited number of bright stars. Note that the mass limit needs to be higher for younger systems, where the dominant stars are of earlier spectral types than those found in a slightly older population. This is because a younger population needs to better fill the IMF higher mass bins and a more massive total stellar population is thus required.
Cerviño & Luridiana (2004) studied this problem from a theoretical point of view. The lower mass limit of a few 103 M⊙ found here for a synthesized population is fully consistent with their results, which suggest that the minimal initial cluster mass needed for synthesis modeling in the U-band is about 8103 M⊙ for a 5 Myr population at 0.4 Z⊙. Following their calculation, this minimal mass can be slightly lower at shorter wavelengths like the FUV range. Using HST images where the stars of NGC 588 were resolved, Jamet et al. (2004) obtained a standard IMF slope of 2.370.16 for NGC 588 by using a star counting technique and estimated a stellar mass of (5.80.5)103 M⊙, consistent with Cerviño & Luridiana (2004) and FUV synthesis. FUSE spectral synthesis of GEHR has clearly shown that their calculation not only applies to color bands, but also to stellar line profiles.
5.2. The Flat IMF slope of GEHR
The stellar IMF is a matter of debate since the work of Salpeter (1955). The generally accepted slope666A slope of 2.35 is traditionally called a Salpeter slope. However, this terminology is not appropriate for stellar masses covered by FUSE since the work of Salpeter (1955) applies to a lower mass range. for the massive OB star regime at all metallicities in every kind of environment (starbursts as well as star clusters), is =2.35 (e.g. Massey, 1998; Schaerer et al., 2000; Grebel & Gallagher, 2004; Piskunov et al., 2004). However, the IMFs of GEHR derived from FUV line profiles seem to favor a relatively flat slope (see Table 2). Since FUV stellar flux is produced only by O and B stars, a small change in their relative numbers can affect the derived IMF slope. This result cannot be associated to a bias due to the FUV synthesis since several, and bigger, young populations have been studied with the same technique and did not show such a flat slope (Pellerin, 2004).
Some hypotheses could physically explain a flat IMF in the FUV range. One hypothesis is that B-type stars could still be more extinguished by dust than earlier type stars. If so, it would then be more difficult to see them in the FUV, producing an artificially flatter IMF. However, the extinction values of individual stars in NGC 604 obtained by Bruhweiler et al. (2003) do not show a significant correlation with the spectral type, suggesting that B stars are not systematically more extinguished than O stars.
Another more plausible possibility is that the massive stars fill the IMF high mass bins relatively well, but not perfectly. If some spectral types have slightly deviant numbers from the analytical IMF, it will slightly change the integrated stellar line profiles in the same direction as NGC 595 or NGC 604-MDRS, i.e. by accentuating the integrated wind profiles. Since a flatter IMF also produces more pronounced P Cygni profiles, it would be hard to differentiate the two cases. Consequently, even if the population synthesis gives reliable and precise results on most physical parameters of the population (age, mass, metallicity, colors, fluxes) for a 1103 M⊙ population (§5.1), it appears that the stellar IMF slope derived from the FUV line profiles is a sign of a non-perfect filling of the IMF high mass bins. This last possibility is supported by the IMF obtained from the star counting technique of Jamet et al. (2004) on NGC 588. They derived a standard IMF slope, but their IMF histogram clearly shows that some mass bins, especially at higher masses, are clearly deviant from the analytical slope.
5.3. A second generation of stars in NGC 5461
The spectral synthesis of FUSE data on NGC 5461 has predicted much lower values for the H flux (factor of 10), the stellar mass (factor of 2 to 10), and the extinction than has been reported in the literature. These discrepancies are hard to explain since most of the H emission is included within the FUSE aperture. One plausible explanation is the presence of a second generation of stars in NGC 5461, like the one observed in the LMC Cluster N11 (Walborn & Parker, 1992). In the case of the star-forming region N11, the central region is composed of a 3.5 Myr stellar population which dominates the UV flux. A surrounding nebulae is excited by a younger generation of stars which is not observed at short wavelengths because it is heavily reddened (Walborn & Parker, 1992).
The presence of a second generation of stars in NGC 5461, younger and consequently more extinguished than the first one, could explain the larger extinction deduced at longer wavelengths, the stellar mass discrepancy as well as the excess in nebular emission. The second generation cluster must then be relatively massive to explain the large differences in flux and mass. It is not excluded that younger stars from different clusters are present rather than a single second generation. Although there is no proof of such a population within NGC 5461, this H II region is a good candidate to host very massive stars, younger than those actually detected with FUSE.
It is also possible that younger stars are present within other GEHR studied here. Unfortunately, because the FUSE aperture does not always include the whole system, it is impossible to confirm here if the difference between the predicted and observed H fluxes comes from a second generation or not, as it is the case for NGC 604 for example. Considering the detailed work of Maíz-Apellániz et al. (2004) on the attenuation maps of NGC 604, the differences in H fluxes and stellar masses in GEHR, including NGC 5461, might also be due, at least partly, to the complexity of the gas and dust spatial distribution.
6. Summary
The evolutionary spectral synthesis technique in the FUV has been used to study the massive stellar content of nine GEHR in M 33 and M 101. Stellar masses, internal extinctions, and ages have been obtained for most of them. The comparison of the FUV synthesis results with values obtained from previous available works in various wavelength ranges has shown that the technique is reliable in most cases. The comparison of the GEHR with each other has confirmed observationally that the synthesis technique must be applied to stellar populations of at least a few 103 M⊙ in the FUV to avoid statistical fluctuations of the high mass end of the stellar IMF. It has also revealed that a flat IMF slope is apparently favored for GEHR in the FUV, which is likely the first apparent effect of statistical fluctuations of the IMF for low mass populations. FUV data suggests that giant H II regions reach their maximum nebular luminosity around 3.0-3.5 Myr, coincident with the WR phase. Finally, the H II region NGC 5461 in M101 is a good candidate to host a second generation of stars more extinguished than, and formed after the cluster actually detected with FUSE.
References
- Allende Prieto et al. (2001) Allende Prieto, C., Lambert, D. L. & Asplund, M. 2001, ApJ, 556, L63
- Bosch et al. (2002) Bosch, G., Terlevich, E., & Terlevich, R. 2002, MNRAS, 329, 481
- Boulesteix et al. (1974) Boulesteix, J., Courtes, G., Laval, A., Monnet, G., & Petit, H. 1974, A&A, 37, 33
- Bruhweiler et al. (2003) Bruhweiler, F. C., Miskey, C. L., & Smith Neubig, M. 2003, AJ, 125, 3082
- Bruzual & Charlot (2003) Bruzual, G. & Charlot, S. 2003, MNRAS, 344, 1000
- Calzetti et al. (2004) Calzetti, D., Harris, J., Gallagher, J. S., Smith, D. A., Conselice, C. J., Homeier, N., Kewley, L. 2004, AJ, 127, 1405
- Cerviño & Luridiana (2004) Cerviño, M. & Luridiana, V. 2004, A&A, 413, 145
- Chandar et al. (2003) Chandar, R., Leitherer, C., Tremonti, C., & Calzetti, D. 2003, ApJ, 586, 939
- Chandar et al. (2005) Chandar, R., Leitherer, C., Tremonti, C. A., Calzetti, D., Aloisi, A., Meurer, G. R., & De Mello, D. 2005, ApJ, in press
- Charbonnel et al. (1993) Charbonnel, C., Meynet, G., Maeder, A., Schaller, G., & Schaerer, D., 1993, A&AS, 101, 415
- Chen, Chu & Johnson (2005) Chen, C.-H. R., Chu, Y.-H., & Jonhson, K. E. 2005, ApJ, 619, 779
- Colbert et al. (2004) Colbert, E. J. M., Heckman, T. M., Ptak, A. F., Strickland, D. K., & Weaver, K. A. 2004, ApJ, 602, 231
- Courtès et al. (1987) Courtès, G., Petit, H., Petit, M., Sivan, J.-P., & Dodonov, S. 1987, A&A, 174, 28
- Drissen et al. (1993) Drissen, L., Moffat, A. F. J., & Shara, M. M. 1993, AJ, 105, 1400
- González Delgado, Leitherer, & Heckman (1997) Gonzalez Delgado, R. M., Leitherer, C., & Heckman, T. M. 1997, ApJ, 489, 601
- González Delgado et al. (1999) González Delgado, R. M., García-Vargas, M. L., Goldader, J., Leitherer, C., & Pasquali, A. 1999, ApJ, 513, 707
- González Delgado & Pérez (2000) González Delgado, R. M. & Pérez, E. 2000, MNRAS, 317, 64
- Grebel & Gallagher (2004) Grebel, E. K. & Gallagher, J. S. 2004, in ASP Conf. Ser. 322, The Formation and Evolution of Massive Young Star Clusters, ed. H. J. G. L. M. Lamers, L. J. Smith, & A. Nota (San Francisco: ASP), 101
- Heckman et al. (1990) Heckman, T. M., Armus, L., & Miley, G. K. 1990, ApJS, 74, 833
- Hunter et al. (1996) Hunter, D. A., Baum, W. A., O’Neil, E. J., & Lynds, R. 1996, ApJ, 456, 174
- Jamet et al. (2004) Jamet, L., Pérez, E., Cerviño, M., Stasińska, G., González Delgado, R. M., & Vílchez, J. M. 2004, A&A, 426, 399
- Keel et al. (2004) Keel, W. C., Holberg, J. B., & Treuthardt, P. M. 2004, AJ, 128, 211
- Kennicutt (1979) Kennicutt, R. C. 1979, ApJ, 228, 394
- Kurucz (1992) Kurucz, R. L. 1992, in IAU Sym. 149, Stellar Populations of Galaxies, ed. B. Barbuy, & A. Renzini (New York: Kluwer), 225 IAU Sym. 149
- Lebouteiller et al. (2005) Lebouteiller, V., Kunth, D., Lequeux, J., Aloisi, A., Désert, J.-M., Hébrard, G., Lecavalier des Étangs, A., & Vidal-Madjar, A. 2005, A&A, submitted
- Leitherer et al. (1999) Leitherer, C. et al., 1999, ApJS, 123, 3
- Leitherer et al. (2001) Leitherer, C., Leão, J. R. S., Heckman, T. M., Lennon, D. J., Pettini, M., & Robert, C. 2001, ApJ, 550, 724
- Luridiana & Peimbert (2001) Luridiana, V. & Peimbert, M. 2001, ApJ, 553, 633
- Maíz-Apellániz (2001) Maíz-Apellániz, J. 2001, ApJ, 563, 151
- Maíz-Apellániz et al. (2004) Maíz-Apellániz, J., Pérez, E.,& Mas-Hesse, J. M. 2004, AJ, 128, 1196
- Malumuth et al. (1996) Malumuth, E. M., Waller, W. H., & Parker, J. W. 1996, AJ, 111, 1128
- Martin et al. (2002) Martin, C. L., Kobulnicky, H. A., & Heckman, T. M. 2002, ApJ, 574, 663
- Mas-Hesse & Kunth (1991) Mas-Hesse, J. M. & Kunth, D. 1991, in IAU Symp. 143, Wolf-Rayet Stars and Interrelations with Other Massive Stars in Galaxies, eds. K. A. van der Hucht & B. Hidayat (Dordrecht: Kluwer), 613
- Mas-Hesse & Kunth (1999) Mas-Hesse, J. M. & Kunth, D. 1999, A&A, 349, 765
- Massey (1998) Massey, P. 1998, in ASP. Conf. Ser. 142, The Stellar Initial Mass Function, ed. G. Gilmore & D. Howell (San Francisco: ASP), 17
- Meurer et al. (1995) Meurer, G. R., Heckman, T. M., Leitherer, C., Kinney, A., Robert, C., & Garnett, D. R. 1995, AJ, 110, 2665
- Meynet et al. (1994) Meynet, G., Maeder, A., Schaller, G., Schaerer, D., Charbonnel, C., 1994, A&AS, 103, 97
- Moos et al. (2000) Moos, H. W. et al. 2000, ApJ, 538, L1
- Pellerin (2004) Pellerin, A. 2004, PhD Thesis, Université Laval
- Pellerin et al. (2002) Pellerin, A., Fullerton, A. W., Robert, C., Howk, J. C., Hutchings, J. B., Walborn, N. R., Bianchi, L., Crowther, P. A., & Sonneborn, G. 2002, ApJS, 143, 159
- Pence et al. (2001) Pence, W. D., Snowden, S. L., Mukai, K., & Kuntz, K. D. 2001, ApJ, 561, 189
- Piskunov et al. (2004) Piskunov, A. E., Belikov, A. N., Kharchenko, N. V., Sagar, R., & Subramaniam, A. 2004, MNRAS, 349, 1449
- Robert et al. (2003) Robert, C., Pellerin, A., Aloisi, A. Leitherer, C., Hoopes, C. G., & Heckman, T. M., 2003, ApJS, 144, 21
- Rosa & Benvenuti (1994) Rosa, M. R. & Benvenuti, P. 1994, A&A, 291, 1
- Russell & Dopita (1992) Russell, S. C.; Dopita, M. A. 1992, ApJ, 384, 508
- Salpeter (1955) Salpeter, E. E. 1955, ApJ, 121, 161
- Sahnow et al. (2000) Sahnow, D. J. et al. 2000, ApJ, 538, L7
- Schaerer et al. (1993a) Schaerer, D., Meynet, G., & Schaller, G., 1993a, A&AS, 98, 523
- (49) Schaerer, D., Charbonnel, C., Meynet, G., Maeder, A., & Schaller, G. 1993b, A&AS, 102. 339
- Schaerer et al. (1999) Schaerer, D., Contini, T., & Kunth, D. 1999, A&A, 341, 399
- Schaerer et al. (2000) Schaerer, D., Guseva, N. G., Izotov, Yu. I., & Thuan, T. X. 2000, A&A, 362, 53
- Schaller et al. (1992) Schaller, G., Schaerer, D., Meynet, G., & Maeder, A., 1992, A&AS, 96, 269
- Schmidt-Kaler (1982) Schmidt-Kaler, T., 1982, in Landolt-Börnstein IV: Numerical Data and Functional Relation Ships in Science and Technology, ed. K. Schaifers & H. H. Voigt (Berlin: Springer-Verlag), 1
- Schmutz et al. (1992) Schmutz, W., Leitherer, C. & Gruenwald, R. 1992, PASP, 104, 1164
- Scowen et al. (1992) Scowen, P. A., Dufour, R. J., & Hester, J. J. 1992, AJ, 104, 92
- Seaton (1979) Seaton, M. J. 1979, MNRAS, 187, 73
- Smith (1975) Smith, H. E. 1975, ApJ, 199, 591
- Stasińska & Schaerer (1999) Stasińska, G. & Schaerer, D. 1999, A&A, 351, 72
- Tan (2005) Tan, J. C. 2005, preprint (astro-ph/0504256)
- Terlevich et al. (2004) Terlevich, R., Silich, S., Rosa-González, D., & Terlevich, E. 2004, MNRAS, 348, 1191
- Torres-Peimbert et al. (1989) Torres-Peimbert, S., Peimbert, M., & Fierro, J. 1989, ApJ, 345, 186
- Tremonti et al. (2004) Tremonti. C. A. et al. 2004, ApJ, 613, 898
- Vilchez et al. (1988) Vilchez, J. M., Pagel, B. E. J., Díaz, A. I., Terlevich, E., & Edmunds, M. G. 1988, MNRAS, 235, 633
- Walborn & Parker (1992) Walborn, N. R. & Parker, J. W. 1992, ApJ, 399, L87
- Wang et al. (1999) Wang, Q. D., Immler, S., Pietsch, W. 1999, ApJ, 523, 121
- Willis et al. (2004) Willis, A. J., Crowther, P. A., Fullerton, A. W., Hutchings, J. B., Sonneborn, G., Brownsberger, K., Massa, D. L., & Walborn, N. R. 2004, ApJS, 154, 651
- Witt & Gordon (2000) Witt, A. N. & Gordon, K. D. 2000, ApJ, 528, 799
- Worthey et al. (1994) Worthey, G., Faber, S. M, González, J. J., & Burstein, D. 1994, ApJS, 94, 687


| Hii Region | (J2000) | (J2000) | FUSE | Apertureaa The LWRS aperture is 3030′′ and MDRS aperture is 420′′. | vhel | F(1150)bb Not corrected for extinction. |
|---|---|---|---|---|---|---|
| h m s | ∘ ′ ′′ | Program | [km s-1] | [ergs s-1 cm-2 Å-1] | ||
| NGC 588 | 01 32 45.5 | +30 38 55 | A08604 | LWRS | 174 | (101)10-14 |
| NGC 588-NW | 01 32 37.7 | +30 40 06 | A06105 | LWRS | (5.10.5)10-14 | |
| NGC 592 | 01 33 12.3 | +30 38 49 | A08602 | LWRS | 162 | (101)10-14 |
| NGC 595 | 01 33 33.6 | +30 41 32 | A08603 | LWRS | 174 | (9.20.9)10-14 |
| 01 33 33.6 | +30 41 32 | B01801 | LWRS | (101)10-14 | ||
| NGC 604 | 01 34 32.5 | +30 47 04 | A08601 | LWRS | 226 | (10010)10-14 |
| 01 34 32.4 | +30 47 04 | B01802 | MDRS | (162)10-14 | ||
| NGC 5447 | 14 02 28.6 | +54 16 11 | B01803 | LWRS | 152 | (8.40.8)10-14 |
| NGC 5458 | 14 03 12.6 | +54 17 55 | C07001 | LWRS | 241 | (3.80.5)10-14 |
| NGC 5461 | 14 03 41.3 | +54 19 05 | A08605 | LWRS | 298 | (6.30.7)10-14 |
| NGC 5471 | 14 04 28.7 | +54 23 49 | B01805 | MDRS | 297 | (4.20.6)10-14 |
| Hii Region | Age | Zsyn | (IMF) | E(B-V)i | Stellar Mass |
|---|---|---|---|---|---|
| [Myr] | 0.02 | [M⊙] | |||
| Best-Fit Parameters | |||||
| NGC 588 | 3.50.5 | 0.4 | 2.35 | 0.06 | (1.30.6)103 |
| NGC 588-NW | 5-6 | 0.4 | - | 0 | 1103 |
| NGC 592 | 4.00.5 | 1 | 2.35 | 0.07 | (1.00.3)104 |
| NGC 595 | 3.50.5 | 0.4 | - | 0.02 | 1103 |
| NGC 604-LWRS | 3.30.1 | 0.4 | 1.50 | 0.03 | (72)103 |
| NGC 604-MDRS | 3.30.2 | 0.4 | 1.50 | 0.03 | (1.00.3)103 |
| NGC 5447 | 4.50.5 | 0.4 | 2.35 | 0 | (1.20.2)105 |
| NGC 5458 | 5.50.5 | 1 | 2.35 | 0 | (1.10.4)105 |
| NGC 5461 | 3.30.2 | 0.4 | 1.50 | 0 | (1.50.4)104 |
| NGC 5471 | 4.50.5 | 0.4 | 2.35 | 0 | (71)104 |
| Other Good-Fit Parameters | |||||
| NGC 588 | 4.51.0 | 0.1 | 2.35 | ||
| NGC 604-LWRS | 3.90.1 | 0.1 | 1.50 | 0.03 | (1.10.2)104 |
| NGC 604-LWRS | 3.50.3 | 0.1 | 2.35 | 0.03 | (2.50.3)104 |
| NGC 604-LWRS | 3.00.3 | 0.4 | 2.35 | 0.03 | (2.20.5)104 |
| NGC 5461 | 4.00.5 | 0.1 | 1.50 | 0 | (2.20.6)104 |
| NGC 5471 | 3.5-4.0 | 0.1 | 2.35 | 0 | |
| Hii Region | #O | #WR | F(H)aaUnreddened fluxes in ergs s-1 cm-2 Å-1. | F(5500)aaUnreddened fluxes in ergs s-1 cm-2 Å-1. | F(H)aaUnreddened fluxes in ergs s-1 cm-2 Å-1. | Ref |
|---|---|---|---|---|---|---|
| Predicted | Observed | |||||
| NGC 588 | 15 | 2 | 2.810-12 | 410-15 | 2-310-12 | 1, 2 |
| NGC 588-NW | 4 | 0 | 210-13 | 110-15 | ||
| NGC 592 | 40 | 4 | 2.710-12 | 110-14 | 2.710-12 | 2 |
| NGC 595 | 10 | 1 | 1.310-12 | 210-15 | 8.8-1110-12 | 2, 1 |
| NGC 604-LWRS | 90 | 9 | 210-11 | 310-12 | 3.3-4.010-11 | 3, 2 |
| NGC 604-MDRS | 12 | 2 | 210-12 | 310-13 | ||
| NGC 5447 | 460 | 34 | 5.710-13 | 9.210-15 | 1.6-4.710-12 | 1, 2 |
| NGC 5458 | 150 | 46 | 1.710-13 | 610-16 | ||
| NGC 5461 | 175 | 18 | 510-13 | 710-16 | 3.2-6.510-12 | 1, 2 |
| NGC 5471 | 290 | 20 | 3.510-13 | 610-16 | 3.5-6.210-12 | 1, 2 |