Narrow-band Survey of the GOODS Fields: Search for LYMAN Emitters at 111Based in part on data collected at Subaru Telescope and obtained from the SMOKA science archive at Astronomical Data Analysis Center, which are operated by the National Astronomical Observatory of Japan.
Abstract
We present results from optical narrow-band ( Å and Å) observations of the Great Observatories Origins Deep Survey (GOODS) fields, using Suprime-Cam on the Subaru Telescope. Using these narrow-band data, we then perform a survey of Lyman Emitters (LAEs) at . The LAE survey covers an area of arcmin2 and a co-moving volume of Mpc3. We found a total of 10 (GOODS-N) and 4 (GOODS-S) LAE candidates at . We perform a study of the spatial distribution, space density, and star formation properties of the LAEs at .
1 INTRODUCTION
With the installation of the Advanced Camera for Surveys (ACS), the efficiency of the Hubble Space Telescope (HST) in performing wide-area and deep surveys has increased ten-fold. Such data are required to study formation and evolution of galaxies and are essential in identifying high-redshift galaxies. Significant progress has been made in recent years in performing multi-waveband deep surveys, greatly extending the range of accessible redshifts and enhancing our knowledge of properties of galaxies out to the re-ionization epoch (Beckwith et al. 2004; Giavalisco et al. 2004a; Rix et al. 2004; Scoville et al. 2006 in preparation).
One of the general methods to select galaxies at high redshift is drop-out technique (e.g., Steidel et al. 1996), monitoring the Lyman break (912 Å) feature in galaxies as it moves with redshift to longer wavelengths and progressively out of the observed (shorter) passbands. Such high-z galaxies have been found in large numbers in the Great Observatories Origins Deep Survey fields (GOODS; Giavalisco et al. 2004b; Dickinson et al. 2004; Stanway et al. 2004; Bouwens et al. 2004) and are used to investigate the origin of cosmic re-ionization at (e.g., Barkana & Loeb 2001). Another technique to identify high- objects is narrow-band search for strong Lyman emitters (LAEs) (e.g., Hu, Cowie & McMahon 1998; Cowie & Hu 1998; Rhoads & Malhotra 2001; Hu et al. 2002; Ajiki et al. 2003; Kodaira et al. 2003, Taniguchi et al. 2005). Such narrow-band surveys, conducted at selected wavelengths to avoid atmospheric emission, target emission line galaxies at certain redshifts. Combined with broad-band data to subtract the continuum, we can estimate the narrow-band flux for the respective lines observed.
In this paper, we present results from a narrow-band survey in the GOODS fields, searching for LAEs at . The area coverage and depth of the GOODS, combined with its multi-wavelength imaging data, allows unbiased selection of a population of LAEs at high redshifts. Furthermore, availability of deep Spitzer and Chandra data, high resolution ACS images and ground-based optical-IR data in the GOODS fields allow a study of the nature of LAEs, their morphology and star formation rate at and provides an unbiased sample of LAEs to compare with homogeneously selected LBGs at a similar redshift. We adopt a flat universe with , , and 70 km s-1 Mpc-1. Throughout this paper, magnitudes are given in the AB system.
2 OBSERVATIONS AND DATA REDUCTION
2.1 Narrow-band Observations and Source Detection
Deep narrow-band surveys of the GOODS fields are performed using the Suprime-Cam (Miyazaki et al. 2002) on the 8.2 m Subaru Telescope. We use a narrowband filter, NB816, centered on 8150 Å with a width Å(Ajiki et al. 2003). This filter samples Lyman emission lines in the redshift range .
The NB816 observations of GOODS-S were made during 20–22 February 2004 (UT) while, for the GOODS-N field, we used Subaru archival data which were taken in April 2002 and 2003. All the NB816 observations were done under photometric conditions with a seeing between 07 and 09. The narrowband imaging data were reduced with the software package SDFRED (Yagi et al. 2002; Ouchi et al. 2004). The FWHM of stellar objects in the final NB816 images of the two fields are 09. The limiting NB816 magnitude in both fields is for a 5 detection over a diameter aperture. Deep broad-band images taken by the ACS (, , , and ) and ground-based near-IR data, taken as a part of the GOODS (Giavalisco et al. 2004a) are also available for these fields.
The NB816 survey covers a total of 160 arcmin2 area in each field, corresponding to the full GOODS-ACS area (a total of 320 arcmin2 area). The transverse co-moving area of the LAE survey at is 1.8 Mpc2. Combined with the FWHM of the filter, which has a Gaussian-like shape, this corresponds to a co-moving depth of 45 Mpc ( to ) and a combine volume of Mpc3.
Source detection was performed using SExtractor version 2.3 (Bertin & Arnouts 1996). A source is defined as 9-pixel contiguous area above the 3 noise level on the NB816 image. Photometry was performed using IRAF – APPHOT with a diameter aperture. To the magnitude limit of our survey, ( in the both fields), a total of 9,600 and 8,700 sources are found in the GOODS-N and -S fields respectively.
2.2 Selection of LAE Candidates
The LAE candidates at are identified by combining the GOODS ACS images (, , , and ) (Giavalisco et al. 2004a) and narrow-band catalog with . The LAEs are selected to satisfy the following criteria:
| (1) | |||||
| (2) | |||||
| (3) |
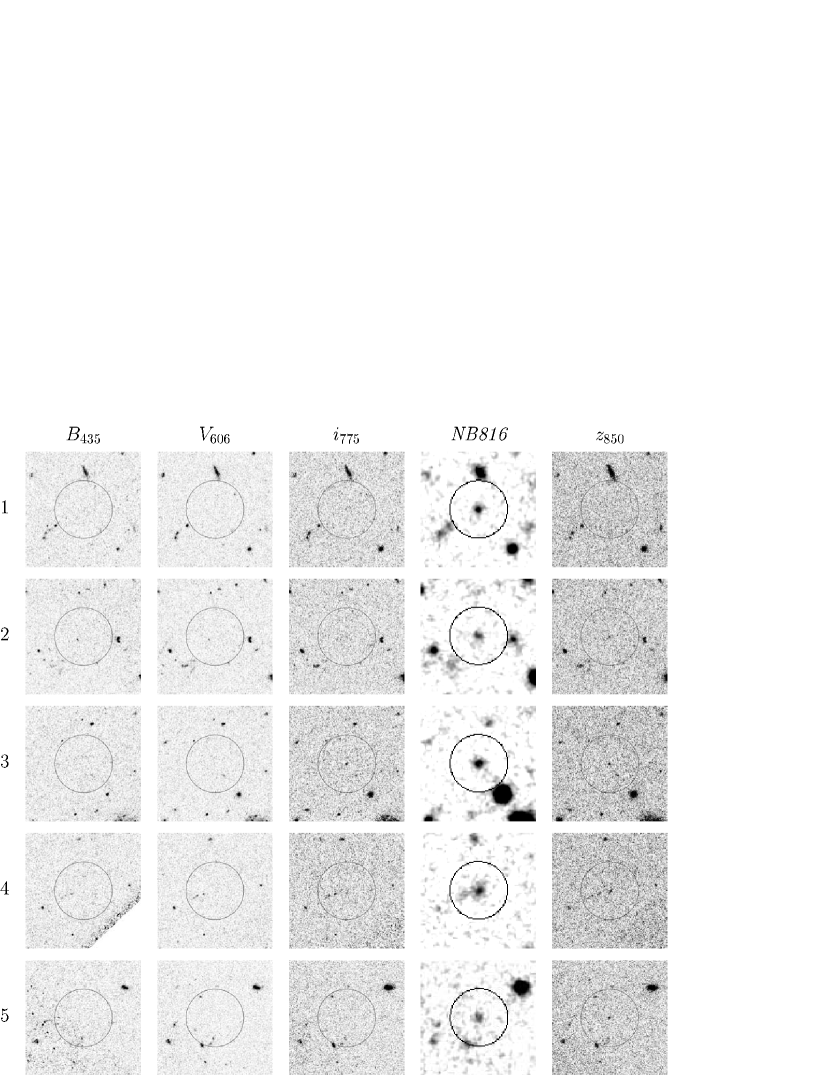
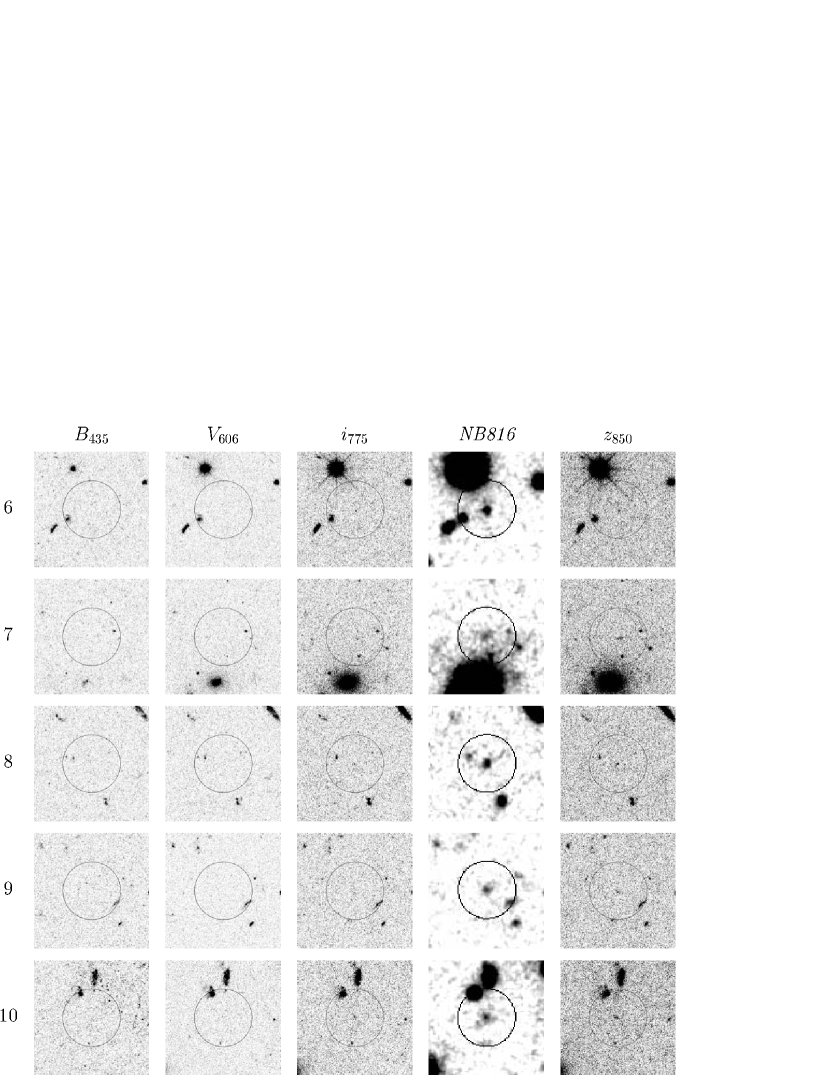
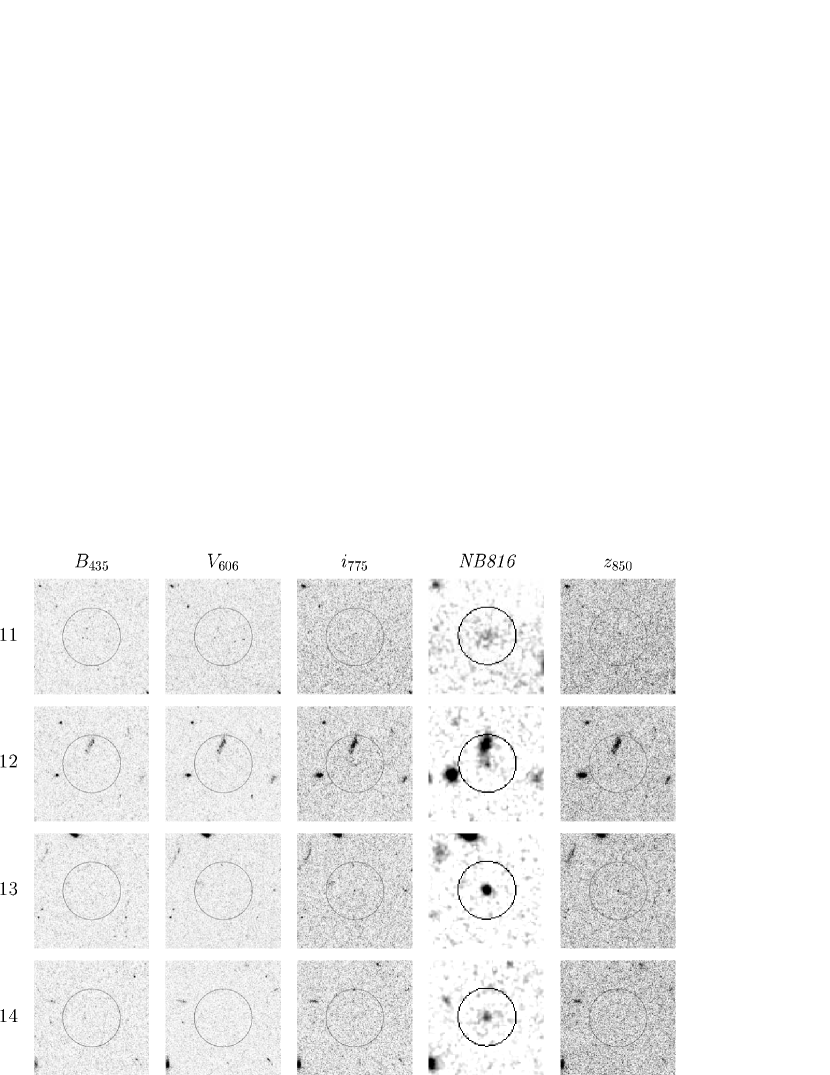
where is the continuum magnitude at Å , estimated by linear interpolation between and flux densities (). The first two criteria ensure that the objects at are undetected (at 2 noise level) in and while, the third condition allows selection of LAEs with a rest-frame Lyman equivalent width Å. This is illustrated in Figure 1 where the LAE candidates are identified on vs. NB816. color-magnitude diagram. A total of 10 (GOODS-N) and 4 (GOODS-S) LAEs at a targeted redshift of are found to satisfy the above criteria. Their NB816 and broad-band ACS images are shown in Figure 2 (GOODS-N) and 4 (GOODS-S). Their coordinates and photometric properties are summarized in Table 1.
It is important to estimate the fraction of contaminants in our LAE survey. From spectroscopic observations of a sample of 23 LAE candidates at , identified in a narrow-band survey, Hu et al. (2004) found that 4 are interlopers [two are [O ii] and H emitters, one is a red star () and one a source with no discernible spectral features]111 Hu et al. (2004) used the following criteria for selecting their LAE candidates; (a) , (b) , (c) undetected in the and images, and (d) . . Since none of our LAE candidates have red colors, similar to what expected for stars, our LAE survey is expected to be free from contamination by red stars. This, combined with the fact that the - and -band data here are deeper than those of Hu et al. (2004) by magnitude, we expect a contamination rate of 14% for our sample of LAEs here.
3 Results
3.1 Number Density and Lyman Luminosities of LAE Candidates
Using the estimated survey volume for each field, Mpc3, and the number of LAE candidates found at , we estimate the LAE space density of LAEMpc-3 and Mpc-3 for GOODS-N and GOODS-S respectively. The total space density in the combined GOODS fields is then LAEMpc-3. The space density of LAEs in the GOODS-S is lower by a factor of 2.5 than that in GOODS-N. Spatial distribution of the LAE candidates are shown in Figure 5.
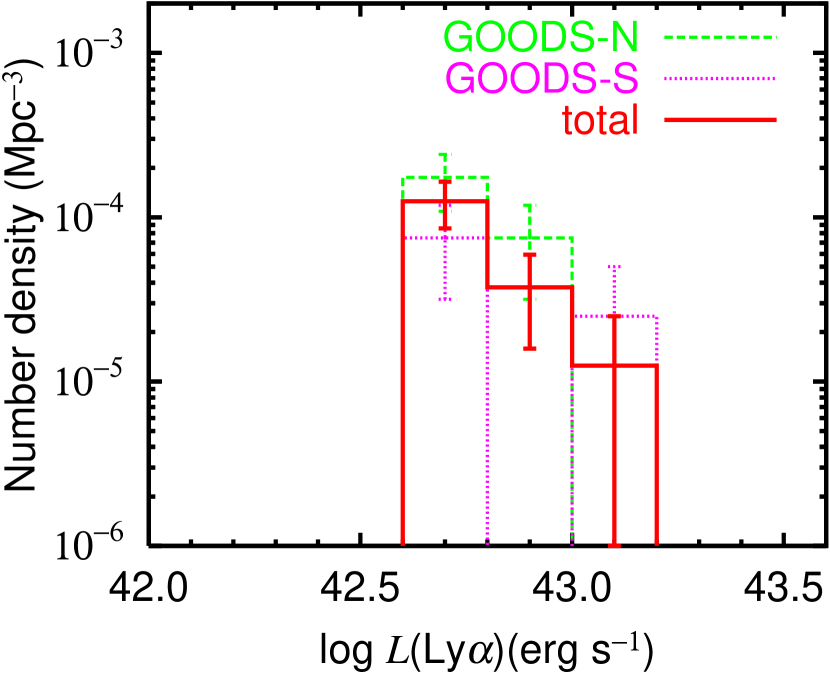
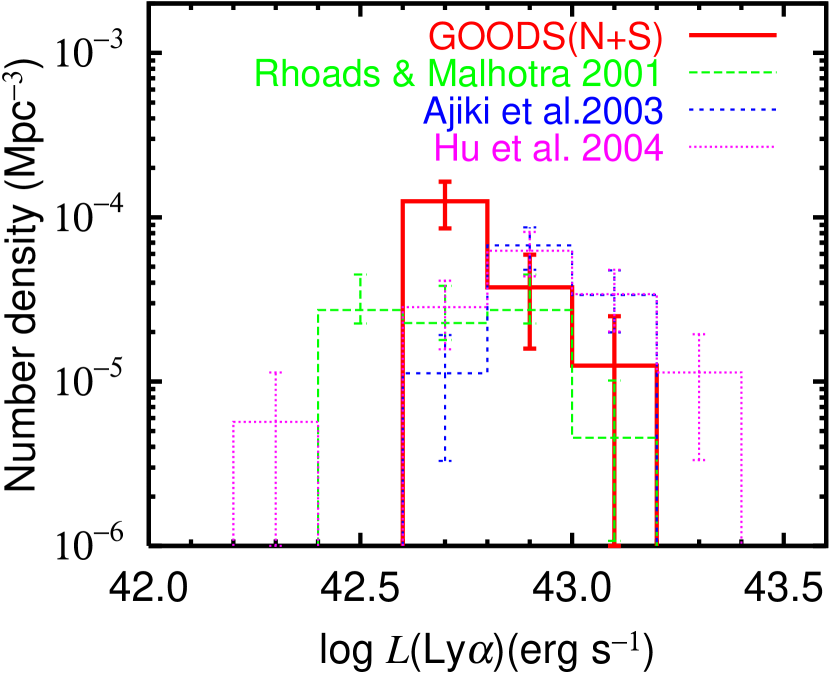
In Table 2, we list the Lyman luminosities for our sample of LAE candidates, assuming them to be at , with the Lyman shifted to the central wavelength of the NB816 filter. The Lyman luminosities range from ergs s-1 to ergs s-1. These values correspond to – of the Ly luminosity function by Ajiki et al. (2003; ergs s-1). In Figure 6, we show the distribution of Lyman luminosities for our 14 LAE candidates (upper panel). We compare our results with those of the previous LAE surveys at (Rhoads & Malhotra 2001; Ajiki et al. 2003; Hu et al. 2004) (lower panel in Figure 6). It is clear that the number density of our sample of LAEs with Lyman luminosities of ergs s-1, is higher (by a factor of ) than those of the other surveys. This seems attributed to the relatively deeper completeness limit for our survey [(Ly) ergs s-1 corresponding to ] compared to the previous studies, including; Rhoads & Malhotra [2001; (Ly) ergs s-1], Ajiki et al. [2003; (Ly) ergs s-1], and Hu et al. [2004; (Ly) ergs s-1]. The extra depth enables our survey to include more LAEs with the Lyman luminosities ergs s-1 than the previous surveys. We also note that, for luminosity [(Ly) ergs s-1], the number density of our combined (GOODS-N and -S) sample is higher than that of Rhoads & Malhotra (2001) by a factor of while lower than those of Ajiki et al.(2003) and Hu et al. (2004) by a similar factor.
3.2 Star Formation Rates
Using the LAE luminosities, we now estimate their corresponding star formation rates (SFRs), using the relation
| (4) |
(Kennicutt 1998; Brocklehurst 1971). Here Ly is in units of ergs s-1 and we assume a Salpeter initial mass function with (, ) = (0.1 , 100 ). The results are given in the third column of Table 2. We note that the SFR derived here can be underestimated due to the effect of absorption by H i gas both in the host galaxies and in the intergalactic space. The SFRs range from 4 to 11 yr-1 with a median of 5.2 yr-1. The estimated SFRs here are comparable to those of LAEs at 5.7 – 6.6 (e.g., Ajiki et al. 2003; Taniguchi et al. 2005).
It is instructive to examine whether the SFRs derived from Lyman luminosities here are consistent with those derived from the UV continuum luminosity from the broad-band data in the GOODS. We convert the observed magnitudes to UV continuum luminosities at Å. Using the relation (Kennicutt 1998; see also Madau et al. 1998),
| (5) |
where is in units of ergs s-1 Hz-1. The estimated SFRs are summarized in Table 2. Comparison between the SFRs for individual sources, estimated from (Ly) and (UV) (see Figure 7), shows that, on average, (UV) is relatively higher than (Ly) for most of the LAE candidates. We also measure the average SFR ratios, (Ly) / (UV), where (Ly) and (UV) are, respectively, the sum of (Ly) and (UV) of all our LAE candidates. This ratio is close to that obtained by Ajiki et al. (2003) for their sample of LAEs at . The lower value of (Ly) can be attributed to the effect of the dust extinction and scattering by the intergalactic medium. However, some of our LAE candidates have (Ly) / (UV) . These are likely to be in a very early phase ( yr) of star formation activity, in which, (UV) values are underestimated (Schaerer 2000; see also Nagao et al. 2004, 2005). As illustrated in the right panel of Figure 7, objects with small (UV) have higher (Ly) / (UV) ratios. This, in part, is explained by selection effects in the NB816-limited sample (i.e., our survey cannot find objects below the dotted curve in the right panel of Figure 7). However, all objects with (Ly) / (UV) (i.e., the age of yr) have (UV) . This implies that the UV continuum emission of very young star-forming galaxies are too faint to be found in typical LBG surveys. The narrow-band survey provides a very efficient method to investigate such very young star-forming galaxies.
4 Summary
We present results from a NB816 survey in the two GOODS fields, aiming for LAE galaxies in the redshift range . We find a total of 14 LAE candidates satisfying our selection criteria. The space density of LAEs with (Ly) ergs s-1, found here ( Mpc-3), is a factor of higher than other similar surveys (Rhoads & Malhotra 2001; Ajiki et al. 2003; Hu et al. 2004), due to relatively deeper flux limit in the present survey. Using the Ly luminosities, we estimate the SFRs for LAEs, (Ly) to be in the range M⊙ yr-1. Overall, this is smaller than the SFR estimated from rest-frame light [(Ly)/(UV)], due to extinction in Ly flux. We interpret a larger (Ly) value [i.e. (Ly) / (UV)], observed for a few LAEs as due to a very early phase of star formation ( yr).
We would like to thank both the Subaru and HST staff for their invaluable help. Data reduction/analysis was in part carried out on ”sb” computer system operated by the Astronomical Data Analysis Center (ADAC) and Subaru Telescope of the National Astronomical Observatory of Japan. We also thank an anonymous referee for his/her useful comments and suggestions. This work was financially supported in part by the Ministry of Education, Culture, Sports, Science, and Technology (Nos. 10044052 and 10304013), and by JSPS (15340059 and 17253001). MA, SSS, and TN are JSPS fellows.
References
- (1) Ajiki, M., et al. 2003, AJ, 126, 2091
- (2) Barkana, R., & Loeb, A. 2001, Phys. Rep., 349, 125
- (3) Beckwith, S. V. W., et al. 2003, AAS, 202, 1705
- (4) Bertin, E., & Arnouts, S. 1996, A&AS, 117, 393
- (5) Bouwens, R. J., et al. 2004, ApJ, 606, L25
- (6) Brocklehurst, M. 1971, MNRAS, 153, 471
- (7) Cowie, L. L., & Hu, E. M. 1998, AJ, 115, 1319
- (8) Dickinson, M., et al. 2004, ApJ, 600, L99
- (9) Giavalisco, M., et al. 2004a, ApJ, 600, L93
- (10) Giavalisco, M., et al. 2004b, ApJ, 600, L103
- (11) Hu, E. M., Cowie, L. L., & McMahon, R. G. 1998, ApJ, 502, L99
- (12) Hu, E. M., Cowie, L. L., McMahon, R. G., Capak, R., Iwamuro, F., Kneib, J. -P., Maihara, T., & Motohara, K. 2002, ApJ, 568, L75
- (13) Hu, E. M., Cowie, L. L., Capak, P., McMahon, R. G., Hayashino, T., & Komiyama, Y. 2004, AJ, 127, 563
- (14)
- (15) Kaifu, N., et al. 2000, PASJ, 52, 1
- (16) Kennicutt, R. C., Jr. 1998, ARA&A, 36, 189
- (17) Madau, P., Pozzetti, L., & Dickinson, M. 1998, ApJ, 498, 106
- (18) Miyazaki, S. et al. 2002, PASJ, 54, 833
- (19)
- (20) Nagao, T., et al. 2004, ApJ, 613, L9
- (21) Nagao, T., et al. 2005, ApJ, in press (astro-ph/0508179)
- (22)
- (23) Ouchi, M., et al. 2004, ApJ, 611, 660
- (24) Rix, H., et al. 2004, ApJS, 152, 163
- (25) Rhoads, J. E., & Malhotra, S. 2001, ApJ, 563, L5
- (26)
- (27) Schaerer, D. 2000, in Building the Galaxies: From the Primordial Universe to the Present, eds. F. Hammer, et al. (Gif-sur-Yvette: Editions Frontières), 389
- (28)
- (29) Stanway, E. R., Bunker, A. J., McMahon, R. G., Ellis, R. S., Treu, T., and McCarthy, P. J., 2004, ApJ, 607, 704
- (30) Steidel, C. C., Giavalisco, M., Dickinson, M., & Adelberger, K. L. 1996, AJ, 112, 352
- (31) Taniguchi, Y., et al. 2005, PASJ, 57, 165
- (32) Yagi M., Kashikawa, N., Sekiguchi, M., Doi, M., Yasuda, N., Shimasaku, K., & Okamura, S., 2002, AJ, 123, 66
| No. | (J2000) | (J2000) | aaAB magnitude in a diameter. An entry of “99” indicates that no excess flux was measured | aaAB magnitude in a diameter. An entry of “99” indicates that no excess flux was measured | aaAB magnitude in a diameter. An entry of “99” indicates that no excess flux was measured | aaAB magnitude in a diameter. An entry of “99” indicates that no excess flux was measured | NB816aaAB magnitude in a diameter. An entry of “99” indicates that no excess flux was measured |
|---|---|---|---|---|---|---|---|
| h m s | ∘ ′ ′′ | ||||||
| GOODS-N | |||||||
| 1 | 12 35 46.4 | +62 12 19 | 29.26 | 99 | 26.91 | 26.91 | 25.12 |
| 2 | 12 35 58.9 | +62 10 18 | 27.27 | 27.87 | 26.65 | 26.81 | 25.37 |
| 3 | 12 36 07.9 | +62 08 39 | 27.56 | 28.48 | 26.17 | 28.09 | 24.79 |
| 4 | 12 36 13.4 | +62 07 48 | 29.51 | 34.20 | 26.30 | 25.44 | 24.75 |
| 5 | 12 36 45.4 | +62 18 03 | 29.07 | 99 | 28.35 | 26.92 | 25.40 |
| 6 | 12 36 51.6 | +62 19 37 | 99 | 28.53 | 26.82 | 25.76 | 24.56 |
| 7 | 12 37 01.0 | +62 21 15 | 99 | 29.13 | 26.10 | 25.54 | 25.03 |
| 8 | 12 37 17.9 | +62 17 59 | 27.61 | 31.58 | 26.74 | 26.17 | 24.97 |
| 9 | 12 37 27.8 | +62 11 47 | 99 | 99 | 27.43 | 99 | 25.23 |
| 10 | 12 37 35.9 | +62 14 22 | 27.27 | 29.08 | 26.22 | 25.45 | 25.01 |
| GOODS-S | |||||||
| 11 | 03 32 22.3 | -27 56 59 | 27.34 | 27.92 | 28.40 | 26.16 | 25.26 |
| 12 | 03 32 29.4 | -27 40 29 | 27.65 | 27.24 | 25.89 | 26.48 | 25.05 |
| 13 | 03 32 37.5 | -27 40 57 | 30.36 | 28.93 | 26.90 | 26.87 | 24.39 |
| 14 | 03 32 52.0 | -27 53 31 | 28.14 | 29.06 | 26.99 | 99 | 25.17 |
| No. | aa ergs s-1. | (Ly)bb yr-1. | ccThe UV continuum luminosity at Å. ergs s-1 Hz-1. | (UV)dd yr-1. | |
|---|---|---|---|---|---|
| ( ergs s-1) | ( yr-1) | ( ergs s-1 Hz-1) | ( yr-1) | ||
| 1 | 5.6 | 5.0 | 3.3 | 4.6 | 1.09 |
| 2 | 4.3 | 3.9 | 3.6 | 5.1 | 0.76 |
| 3 | 8.2 | 7.4 | 2.0 | 2.8 | 2.65 |
| 4 | 6.5 | 5.8 | 12.7 | 17.8 | 0.33 |
| 5 | 4.2 | 3.8 | 3.3 | 4.6 | 0.83 |
| 6 | 8.7 | 7.9 | 9.6 | 13.4 | 0.59 |
| 7 | 4.7 | 4.2 | 11.7 | 16.4 | 0.26 |
| 8 | 6.0 | 5.4 | 6.5 | 9.2 | 0.59 |
| 9 | 5.6 | 5.1 | 2.0 | 2.8 | 1.81 |
| 10 | 4.6 | 4.2 | 12.6 | 17.7 | 0.24 |
| 11 | 4.3 | 3.9 | 6.6 | 9.2 | 0.42 |
| 12 | 5.8 | 5.2 | 4.9 | 6.9 | 0.75 |
| 13 | 11.6 | 10.5 | 3.4 | 4.8 | 2.17 |
| 14 | 6.0 | 5.4 | 2.0 | 2.8 | 1.92 |