Dynamical properties of Ultraluminous Infrared Galaxies I: Mass ratio conditions for ULIRG activity in interacting pairs
Abstract
We present first results from our Very Large Telescope large program to study the dynamical evolution of Ultraluminous Infrared Galaxies (ULIRGs), which are the products of mergers of gas-rich galaxies. The full data set consists of high resolution, long-slit, H- and K-band spectra of 38 ULIRGs and 12 QSOs (between 0.0420.268). In this paper, we present the sources that have not fully coalesced, and therefore have two distinct nuclei. This sub-sample consists of 21 ULIRGs, the nuclear separation of which varies between 1.6 and 23.3 kpc. From the CO bandheads that appear in our spectra, we extract the stellar velocity dispersion, , and the rotational velocity, . The stellar dispersion equals 142 km s-1 on average, while is often of the same order. We combine our spectroscopic results with high-resolution infrared (IR) imaging data to study the conditions for ULIRG activity in interacting pairs. We find that the majority of ULIRGs are triggered by almost equal-mass major mergers of 1.5:1 average ratio. Less frequently, 3:1 encounters are also observed in our sample. However, less violent mergers of mass ratio 3:1 typically do not force enough gas into the center to generate ULIRG luminosities.
1 Introduction
In hierarchical cold dark matter models of galaxy formation and evolution, galaxy merging may lead to the formation of elliptical galaxies, trigger major starbursts, and account for the formation of supermassive black holes and quasars (e.g. Efstathiou & Rees 1988; Kauffmann & Haehnelt 2000; Haehnelt 2004). Despite the importance and prevalence of galaxy mergers in driving galaxy evolution, the physical details of the merging process are not yet well-understood even in the local Universe.
Mergers are responsible for producing some of the most luminous objects of the local Universe, the ultraluminous infrared galaxies (ULIRGs). The bolometric luminosities of ULIRGs are greater than and emerge mainly in the far-infrared (FIR). ULIRGs are mergers of gas-rich, disk galaxies and have large molecular gas concentrations in their central kpc regions (e.g. Downes & Solomon 1998; Bryant & Scoville 1999) with gas-mass densities comparable to stellar densities in ellipticals.
The ULIRG phase occurs in mergers after the first peri-passage (e.g. Sanders & Mirabel 1996, Veilleux, Kim & Sanders 2002) to post-coalescence. The nuclear separation, the presence of tidal tails and the high IR luminosities of these sources are all indications that ULIRG mergers are in a phase beyond the first approach of the halos (e.g. Veilleux, Kim & Sanders, 2002). These observations are consistent with the results from a plethora of numerical models in the literature (e.g. Mihos 1999; Mihos & Hernquist 1996; Springel et al. 2005), which indicate that starbursts intense enough to drive a ULIRG phase occur only after the first encounter and can be present after the nuclear coalescence, before complete relaxation sets in.
A quantitative observational technique to investigate galaxy merger evolution is to determine the kinematic and structural properties of their hosts at different merger timescales. With that goal in mind we have conducted a European Southern Observatory (ESO) large program111171.B-0442 (PI Tacconi), where we performed high-resolution near-infrared (NIR) spectroscopy of a large sample of ULIRGs spanning a wide range of merger phase and infrared luminosity. This work expands on the previous spectroscopic studies of Genzel et al. (2001) and Tacconi et al. (2002).
In this paper we focus on binary ULIRG sources; these systems are between the first and final encounter phases of a merger, thus they still have (at least) two well-separated nuclei. We investigate the mass ratios of the galaxies that, when merging, produce ULIRG-like luminosities. The results from the remnants, the sources which have coalesced and show a single nucleus in the NIR images, will be presented in a forthcoming paper, together with the evolution of the host dynamics and the black hole mass during the merger.
This paper is arranged as follows. After summarizing the observations and describing the data reduction method in § 2, we extract structural parameters of our sources in § 3. The stellar kinematics of the merging hosts, as derived from our long-slit spectra are presented in § 4. Using the kinematics, we calculate the progenitor mass ratio of the merging galaxies in § 5. To ensure that the observed mass ratio is not severely affected by the dynamical heating of the system or projection effects, we perform simulations that predict the time evolution of the mass ratio in § 6. An overview of our results is presented in § 7.
2 Observations and Data Reduction
We present near-infrared Very Large Telescope (VLT) spectroscopic data of local mergers. In the current study, 21 ULIRGs are presented, 20 of which are binary systems and 1 of which, IRAS 00199-7426, may be a multiple merger (Duc et al. 1997; also see Appendix A). To these sources, we add 3 binary ULIRGs that have already been presented in Genzel et al. (2001). With the presentation of the spectroscopy of 23 binary sources in total, we complete the part of our sample that deals with sources in a merger state prior to the coalescence of the individual nuclei.
The entire sample consists of 38 sources and it is largely drawn from the combined 1 Jy catalog (Kim & Sanders 1998), and the southern-ULIRG (SULIRG) sample of the Duc et al. (1997) study. One source, IRAS 02364-4751, is from Rigopoulou et al. (1999). The sample size increases to 54 ULIRGs when the sources studied in Genzel et al. (2001) and Tacconi et al. (2002) are included. The 1 Jy catalog comprises a complete flux-limited (at 60 m) sample of 118 ULIRGs compiled from a redshift survey of IRAS Faint Source Catalog version 2 objects (Moshir et al. 1990). Veilleux et al. (2002) have completed and analyzed an R- and K-band survey of the entire catalog, such that photometric and structural data (absolute magnitudes, surface brightnesses, half-light radii) are readily available. We have observed those sources with dec , and with redshifts where the strong rest frame H-band stellar absorption lines lie in parts of the H- and K-band with high atmospheric transmission (z0.11 and z0.20).
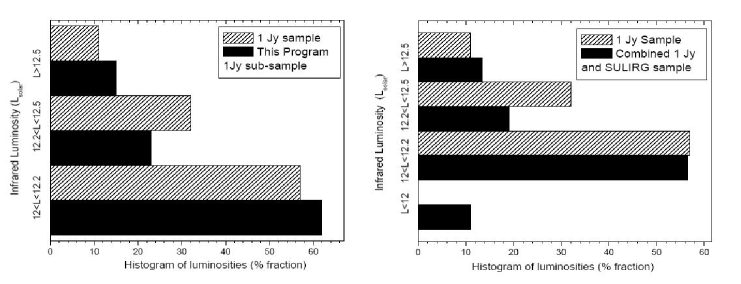
The left-panel histogram of Fig. 1 shows that the sources we selected from the 1 Jy catalog follow a similar luminosity distribution as the entire catalog. Given that the latter is solely compiled according to the 60 µm flux, it does not favor any particular pre-merger initial conditions. When adding sources from the Duc et al. (1997) catalog, which contains less luminous sources than the 1 Jy sample (see right panel of Fig. 1), the average IR luminosity of our sample is reduced, but remains luminosity-selected. For the sources of the Duc et al. (1997) sample, we do not adopt the values of the authors, but we use the Sanders & Mirabel (1996) expression and the Faint Source Catalog version 2 mid-infrared (MIR) and FIR fluxes to calculate . Two of the sources in our large program sample are less luminous than , however we also treat them as ULIRGs given that the classification often depends on the accuracy of the mid- and far-infrared flux measurements.
Our data were taken with the VLT ANTU telescope on Cerro Paranal, Chile. We used the ISAAC spectrometer (Moorwood et al. 1998) in mid-resolution mode in the H band (), and in the K band (), with a slit width of 0.6″. The on-chip integration was 600 s per frame with typical total integration times of 1 hr per slit position angle (see Table 1). For most of the binary sources we observed along three slits, with the first slit going through both nuclei. The other two slits are (usually) perpendicular to the first one and go through the brighter and the fainter nucleus respectively.
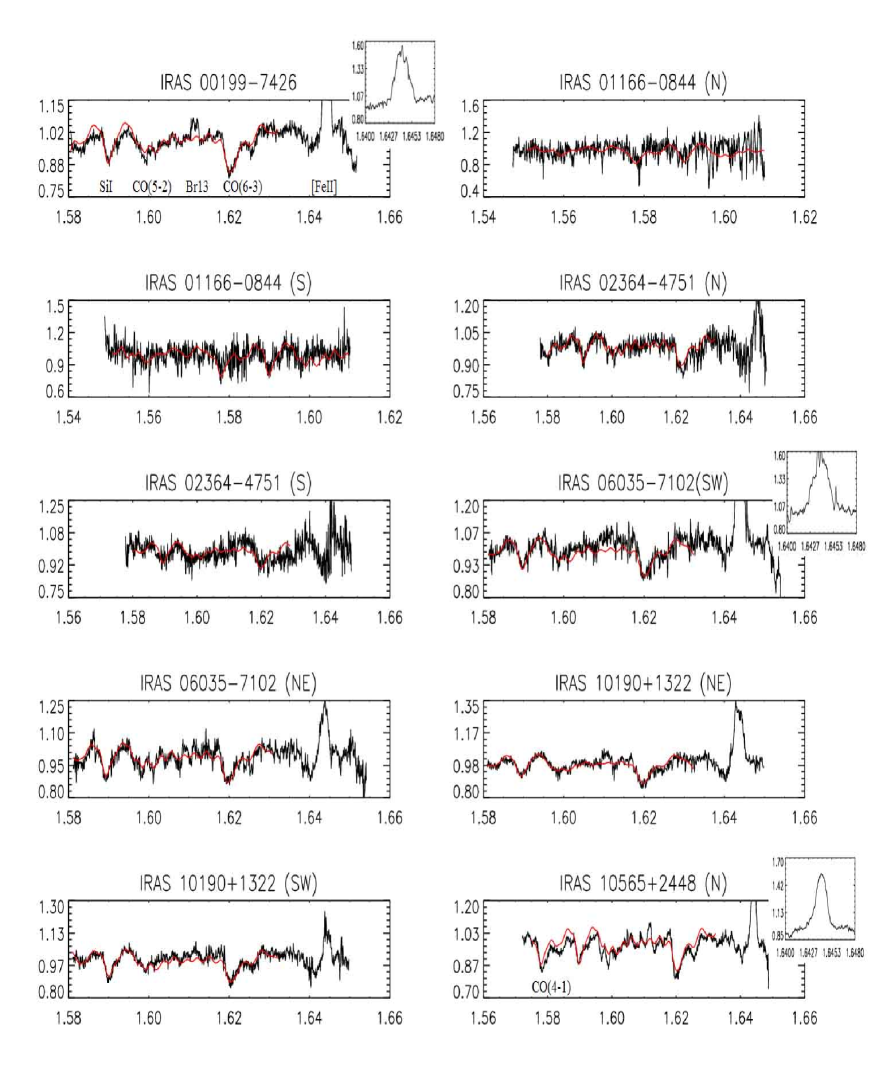
We have selected the central wavelength in a way such that most of the CO(3-0), CO(4-1), SiI, CO(5-2), and CO(6-3) H-band bandheads (at 1.558, 1.578, 1.589, 1.598, and 1.619 µm respectively), as well as the forbidden [FeII] emission line (at 1.645 µm), appear in our spectra. For the sources with redshift we use (some of) the CO(8-5), CO(9-6), and CO(10-7) absorption bandheads (at 1.661, 1.684, and 1.706 µm respectively), which are then shifted to the K band. The CO and SiI absorption features trace the stellar, while the Fe emission line traces the warm gas kinematics. The observed central wavelength range varied from 1.68 to 2.08 µm, depending on the redshift of each source (Table 1). The most nearby of the objects presented in this study is at redshift while the most distant at .
For the data reduction we used standard IRAF routines. We first subtracted the frames of positive from the frames of negative chop throw (offset from the telescope pointing position) for the sky background removal, and flat-fielded the result. Then, we performed a bad-pixel and cosmic-ray removal, and corrected for detector deformations. For the spatial direction, we combined several spectroscopic frames of a point-like source (star) at a different chop throw and nod (random offset, smaller than the chop throw). By fitting all the stellar traces, we found the low-order polynomial that best corrects for deformations of the spatial axis. For the spectral axis we used a ”sky” frame, which simply was a randomly selected, dark-subtracted frame of our exposures. We found the best wavelength correction matrix by identifying the sky-lines in that frame, and, again, by fitting a polynomial to them. After rectifying the images in both the spatial and wavelength directions, we spatially shifted the frames so that their traces overlap and, then, we combined them. The spectral extraction from the final frame was followed by an atmospheric correction with the aid of a telluric (usually B dwarf or solar type) star. The spectral extraction procedure was repeated for several apertures along each slit, and for two different slit position angles, so that the two dimensional image of the stellar kinematics could be reconstructed. The final spectra were shifted to restframe.
To extract the velocity dispersion and rotational velocity we correlated the source spectra with that of an appropriate template star. Due to the starburst nature of a ULIRG, the stellar population that dominates the near infrared (NIR) light is either a giant or a supergiant (or a combination of the two). For this purpose we selected either HD 25472 or HD 99817 (M0III giant and M1I supergiant respectively). We used the Fourier correlation quotient (FCQ) technique described in Bender (1990) with a Wiener filter to suppress the high-frequency noise; for this we used a code written by one of us. The FCQ technique is based on the deconvolution of the correlation function peaks of the source and the stellar template to the autocorrelation function peaks of the template. It provides the broadening function along the line-of-sight (LOS) of the observations. We fit a high-order Gaussian (linear combination of Gaussian and second order polynomial) to the broadening function in order to derive the stellar dispersion and the recession velocity, . For this purpose, we use all of the above-mentioned H-band bandheads that exist in our spectra, as long as the signal-to-noise allows us to do so, and we average the results. From the difference in the recession velocity along several apertures of the slit, we calculate the rotational velocity on the plane defined by the line-of-sight and the position angle of the slit.
We follow the above procedure to extract the spectra for each source (or nucleus). The central aperture spectra, combined over the slits and shifted to the restframe, are displayed in Fig. 2. In each panel, the stellar template is overplotted with a solid line, after being convolved with the Gaussian that best fits the respective LOS broadening function.
3 Structural parameters
The conversion of our dynamical measurements into masses requires complementary data that trace the structure of our sources, namely the half-light-radius and the inclination to the line of sight, .
Given that ULIRGs originate from the merger of gas-rich disk galaxies, we use the (dynamically perturbed) progenitor disks to estimate the inclination. The rotational velocity of a disk is connected to its line of sight dependent value, as follows
| (1) |
The parameter is the angle between the slit position angle and the major axis of the inclined disk (which is an ellipsoid when projected in 2 dimensions).
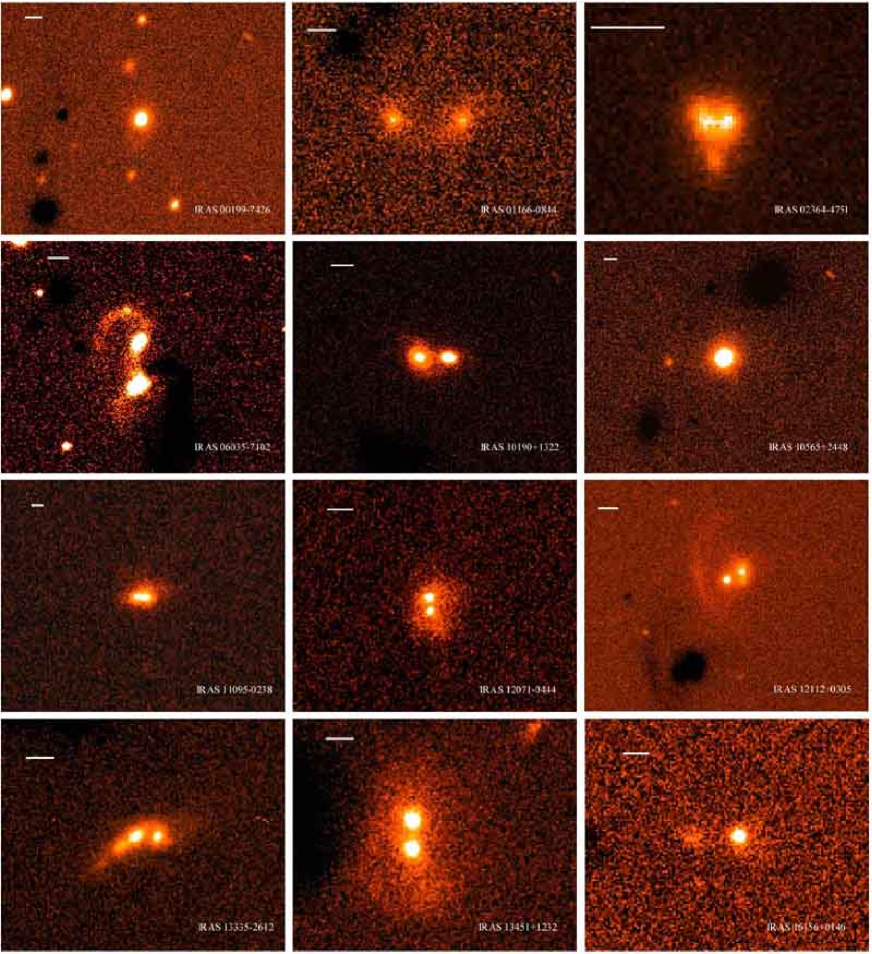
We derive the structural parameters and for the stellar disk of each ULIRG by fitting ellipses to the H-band acquisition images (see Fig. 3). The fit is performed with the aid of the SExtractor package (Bertin & Arnouts 1996), made available by the Institut d’Astrophysique de Paris. We first detect the center and the radial extent of each source by setting a threshold that separates the sky background from any real detection. We then deblend sources that spatially overlap to obtain the apparent ellipticity , the angle (which appear in Table 2), and the enclosed counts of each ellipsoid.
The apparent ellipticity is related with the inclination of the heated stellar disk as
| (2) |
(Binney & Tremaine 1987; Chapter 4.3). The quantity is the (true) ellipticity of the heated disk when seen edge-on. We assume that the ratio of the thickness to the truncation radius is 0.3 for the binary ULIRGs, which is the average value between field spirals and disky ellipticals (Binney & de Vaucouleurs 1981). In this case equals 0.7. The inclinations calculated with this method are presented in Table 2 and have a mean value of 43∘. We note that when using the flat disk approximation () the mean inclination of this sample is 40∘. Solving and differentiating Eq. [2] for shows that the smaller the inclination, the greater the error on its measured value for a given . The systems that are close to face-on are, therefore, those with the most uncertain inclination estimates.
We use the half-light radius as the fiducial aperture in which to calculate masses and luminosities for the progenitor nuclei. However, the half-light radii for most of the individual nuclei of our binary ULIRGs are not readily available in the literature; several binary systems have been treated as a single object (e.g. Veilleux et al. 2002; Scoville et al. 2000), often due to low angular resolution. When available, the effective radii are not usually measured from NIR data but, from optical bands where the light extinction is significant. Due to the extremely dusty environment of ULIRGS and to inclination effects, average extinction corrections are not always reliable for individual sources. For these reasons, we measure new half-light radii from our H-band acquisition images by fitting ellipsoids to the individual nuclei and finding the radius at which the ellipsoid contains half of the total counts. We tabulate the measured H-band in Table 2, after converting angular distances into linear sizes. All distances in this paper are for a H0=70 km s-1 Mpc-1, =0.3, =1 cosmology.
Our results are consistent with those of NIR imaging available in the literature, despite the fact that the acquisition images have short exposure times (10 s) and could be tracing only the most luminous parts of the sources, leading to underestimates of the true half-light radius. To check this possible bias, we compare the effective radii for the sources we have in common with Scoville et al. (2000). We find that the effective radii for IRAS 12112+0305 (sw), IRAS 13451+1232 (w), and IRAS 22491-1808 (e) are 0.81, 4.14, and 1.99 kpc while the half-light radii for flux within 3 kpc given by Scoville et al. (2000) (at 1.6 µm) were 0.79, 1.07, and 1.66 kpc respectively. The results for two of the cases are very similar and the disagreement in the case of IRAS 13451+1232(w) is due to aperture effects. IRAS 13451+1232 is one of the most extended sources of the Scoville et al. (2000) sample with a radial extent kpc. Furthermore, Veilleux et al. (2006, in preparation) have recently acquired HST NICMOS H-band imaging for several ULIRGs of the 1 Jy catalog and have performed a two-dimensional decomposition of the AGN point spread function (PSF) and the host. The effective radii measured from our acquisition images are in good agreement with those of the PSF-subtracted hosts of Veilleux et al. (2006, in preparation).
The structure of a merger, and in particular the nuclear separation, can be used to trace the timescales of each merging system (e.g. Barnes 2001). The majority of the pre-merged ULIRGs have intrinsic nuclear separation smaller than 10 kpc (see Table 2), a fact that classifies them as pre-merger close binaries according to the Surace et al. (1998) scheme. Only five of our galaxies, IRAS 01166-0844, IRAS 06035-7102, IRAS 10565+2448, IRAS 19254-7245, and IRAS 21208-0519 are considered wide binaries in the same classification scheme. The mean projected nuclear separation of our sample is 7.3 kpc (and the median 5.4 kpc).
4 ULIRG stellar velocities and black hole masses
The stellar dispersions extracted (according to the prescriptions of § 2) by the Fourier quotient technique from the central-aperture spectrum of each source are listed in Table 3. In the fainter sources, may be somewhat overestimated (at most by 20%) due to low signal-to-noise ratio, which can mimic broader dispersions. The stellar velocity dispersion may vary when measured from different bandheads (typically by 15%). This is both due to a possible template mismatch and to the sky-line contamination of our spectra. The velocity error bars are equal to the standard deviation of the measurements performed at the individual bandheads.
The mean observed dispersion of our binary ULIRG sample, combined with the sources in Genzel et al. (2001), is 142 km s-1 (with a standard deviation of 21 km s-1). Sources of intrinsic nuclear separation close to or less than 1 kpc (Arp 220 and NGC 6240, see Genzel et al. 2001, Tecza et al. 2000 ) were removed from the above statistics. By the time the nuclei of two merging galaxies are separated by 1 kpc, the stellar velocities have almost reached their final relaxation values (Genzel et al. 2001, Mihos 2000, Bendo & Barnes 2000). As a consequence, these systems have dispersions very close to their (common) equilibrium value and resemble more the coalesced ULIRGs, despite the fact that their nuclei can still be resolved.
We measure the rotational velocity along each slit and we correct it for the angular deviation from the major axis of rotation as discussed in § 2. After averaging the results over the slits, we obtain the observed rotational velocity, , which we display in Table 3 together with its error bar (calculated similarly to that of ). In the same Table we also present the final, inclination corrected rotational velocity .
The ratio of the observed stellar rotational velocity to the dispersion, , is given in Table 3 for each source. The mean ratio for the sample presented in this study is 0.42, while when using the inclination corrected velocity, the ratio increases to 0.77. Both values are low compared to those of spiral galaxies. We now investigate whether this result is due to the violent relaxation process or due to systematics, such as beam-smearing effects. To check for beam smearing we calculate the ratio for the sources for which we have been able to derive rotation curves (due to their large radial extent). These are the sources with z0.07 as well as IRAS 20046-0623. We find that the ratio for these sources is similar to that of our entire sample: 0.58 and 1.16 when using the inclined-disk and inclination-corrected velocities, respectively. We conclude that the low rotational velocitites observed in the binary ULIRGs is due to the actual dynamical heating of the merging systems. Similar conclusions are drawn from the work of Mihos (2000), who presents simulations of the velocity moments during the merger process. The ratio implied from Mihos (2000) for our median nuclear separation (5 kpc) and for the radius containing 50% of the stellar mass (or the for constant M/L within the galaxy) is also 0.4.
Using the stellar dispersions listed in Table 3, we estimate a BH mass, , with the aid of the relation (e.g. Gebhardt et al. 2001; Ferrarese & Merritt 2001). The published estimates for the slope of the M relation span a significant range (see Tremaine et al. 2002; Gebhardt et al. 2001; Merritt & Ferrarese 2001). We use the Tremaine et al. (2002) expression M⊙ which lies between those of Gebhardt et al. (2001) and Merritt & Ferrarese (2001). We present the BH mass calculated for each source in Table 3. The mean black hole mass of the binary ULIRG sample is an order of magnitude greater than that of the Milky Way and equals M⊙ (for each nucleus). Converting the stellar dispersions into black hole masses carries the uncertainty of applying the M relation to systems that are not in dynamical equilibrium. The errors introduced by this conversion and the conditions under which the M relation may provide an accurate estimate of MBH during a merger will be presented in a forthcoming paper (Dasyra et al. 2006, in preparation).
In Table 3 we present the (minimum) black hole mass that each source would have, if it were accreting at the Eddington rate (). We assign to the Eddington luminosity half of that emitted in the IR (Genzel et al. 1998; Sanders & Mirabel 1996). This is a statistically plausible assumption based on the fact that some ULIRGs are largely AGN- while others are starburst- powered (see Genzel et al. 1998; Duc et al. 1997; Lutz et al. 1999). However, for individual sources, the numbers given in Table 3 may be higher up to a factor 2 or much lower. We assign the luminosity to each nucleus according to the K-band luminosity ratios (Kim et al. 2002; Duc et al. 1997), under the assumption that both progenitors have a BH. To distribute the luminosity between the two nuclei of IRAS 12071-0444 and IRAS 21329-2346 we used the H-band count ratios (1.23 and 2.17 respectively; also see the Appendix) since no photometric information on individual nuclei was available in the literature. For the sources of apparent nuclear separation 0.7′′ we distributed 50% of the luminosity to each nucleus, since we used pixel masking (that affects the number counts) to deblend the progenitors. The ratio of the Eddington to the dynamical BH mass, the Eddington efficiency , is given in the last column of Table 3. On average, it is 0.34 for the individual nuclei, which implies that at the pre-merger phase the accretion onto the BH is lower than the Eddington limit.
5 Progenitor mass ratios
For the binary ULIRGs presented in this study, the stellar kinematics allow us to find the progenitor mass ratios, , using the virial theorem. We assume a King model to relate the observed (LOS) dispersion to the total bulge dispersion. The disk and gas mass are accounted for by adding the contribution of the (inclination corrected) rotational velocity (for the cases where the measurement of is possible). The dynamical mass enclosed within an effective radius is then proportional to
| (3) |
Further factors that take into account the galactic structure are not important here since we are only interested in the mass ratio of the merging systems. We use the values of , and of Table 3, and the half-light radius of Table 2.
We present the bulge mass ratio (calculated only using the dispersion velocity) and the total baryonic mass ratio (calculated using both and ) in the first two columns of Table 4. For both ratios, the mass enclosed within the effective radius of each progenitor was used. The convention we use in this Table is that the total mass ratio is greater than unity. As a consequence, a value means that the more massive galaxy of the pair has the less massive bulge.
For the sources that have a measurement, the mean mass ratio equals to 1.40 when only the bulge is considered, and 1.35 when the stellar disk is added. As a consequence, the difference between using the bulge and the total baryonic ratio is so small that it allows us to safely use the former for the cases where we were not able to extract .
The mean progenitor mass ratio derived from Table 4 is 1.54, and shows that the majority of the sources we studied are major mergers of 1:1 to 2:1 progenitor mass ratios. As major mergers we denote systems of progenitor mass ratio as high as 3:1; mergers of 4:1 or greater mass ratio are considered minor. Progenitors of apparent nuclear separation less than 0.7′′ overlap on the detector (even though their nuclei are resolved), because they are spatially extended (with an average sample FWHM of 5 pixels). Their measured kinematics depend on the kinematics of their counterparts and, thus, we have decided not to include them in our statistics (IRAS 02364-4751, IRAS 11095-0238). Our result is in agreement with several merger models in the literature (e.g. Mihos & Hernquist 1994; Naab & Burkert 2003) that attribute the ultra-luminous phase to major mergers.
Another indication of the progenitor mass ratio can be drawn from the remnant ratio. Naab & Burkert (2003) performed gas-free, N-body simulations of binary mergers of several mass ratios and orientations, and found that the major mergers were those that led to slowly rotating remnants. They suggested that the ratio is for 1:1 and for 2:1 merger remnants, while it reaches higher values (0.8) for minor merger remnants. The ratio for the merged ULIRGs of this study, which will be presented in a future paper (Dasyra et al. 2006, in preparation), is in good agreement with the results of Naab & Burkert (2003) and the more recent simulations of Burkert & Naab (2005).
Further observational evidence for the mass ratio of sources with luminosity cutoff comes from the work of Ishida (2004), who calculated the optical (B-band) luminosity ratio of Luminous Infrared Galaxies (LIRGs), sources of . Ishida (2004) found a trend of decreasing luminosity ratio with increasing luminosity cutoff. Interacting sources of were characterized by a wide spread in the optical luminosity ratio. However, the majority (%) of sources of were strongly interacting (wide binaries with disturbed morphologies, tidal tails or internuclei bridges) or merging pairs with luminosity ratios 4:1. Since at least a sub-sample of the high-luminosity LIRGs will likely evolve into ULIRGs, the ULIRG luminosity ratios should be expected to have similar (or smaller) luminosity ratios.
On the other hand, we do not exclude the possibility of a minor merger evolving into a ULIRG. IRAS 20046-0623 does show a second nucleus in both the H- and R-band images, which is however too faint to be deblended from the bright source or to be spectroscopically reduced. IRAS 10565+2448, has an H-band luminosity ratio (calculated from the acquisition image) which is consistent with a 5:1 merger. Due to extinction effects, imaging results are not as reliable as spectroscopic ones in the tracing of the system mass, so this 5:1 ratio is only an indication that, even rarely, minor mergers may appear in our sample.
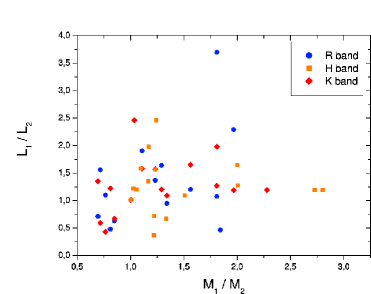
To address whether the luminosity can actually trace the mass of these dusty systems, we compare the luminosity ratio to the mass ratio of our ULIRGs. In the literature, the luminosity ratio is calculated within a specific aperture, equal for both nuclei. To be consistent in our comparison we also need to calculate the baryonic mass ratio inside a given aperture, which we name . We present the latter ratio and the size of the selected aperture in Table 4. The use of a common aperture for both progenitors instead of their effective radii can make the intrinsically fainter nucleus appear brighter than its counterpart (IRAS 06035-7102, IRAS 10190+1322, IRAS 11095-0238, IRAS 21130-4446, IRAS 12112+0305). The area that is used for the calculation of the mass ratio may also significantly change the results.
The R- and K-band luminosity ratios derived from the literature (Kim et al. 2002; Scoville et al. 2000; Duc et al 1997) are given in the same Table. The correlation inferred from Fig. 4 is rather weak, implying that tracing the mass content of each individual merger by its luminosity can be misleading, due to extinction and population effects. Further support for this argument comes from the fact that, in several cases, the brightest nucleus in the NIR seems to be the faintest in the optical and vice-versa (see the luminosity ratios in Table 4). We conclude that the stellar kinematics are the most robust way to determine the mass ratios of merging galaxies.
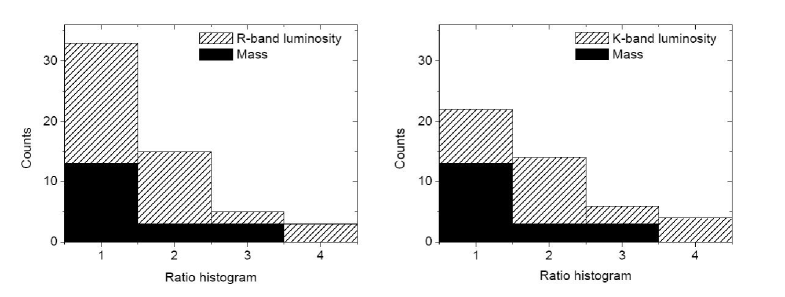
In Fig. 5, we place the binary systems (of luminosity ratio up to 4:1) of the combined samples of Kim et al. (2002) and Duc et al. (1997) in four luminosity ratio bins, for both the R-band (left panel) and the K-band (right panel). The luminosity ratio distribution is different for the two bands due to extinction and population effects. We overplot our sample’s mass ratio histogram in filled bars and we find that the distributions are consistent, even though there are deviations in individual cases. This result implies that when the merging galaxies are nearly equal mass (i.e. the 1.5:1 ratio that we find for this sample), individual deviations do not affect the statistical mean.
6 A model for the evolution of the mass ratio
We have run simulations of 1:1 and 3:1 mass ratio mergers of disk galaxies containing 10% gas to test whether the mass ratio inferred from observations traces the intrinsic mass ratio of the galaxies and to quantify the influence of tidal effects and disk orientation. The disk galaxies and their orbits were set up in exactly the same way as in Naab & Burkert (2003) (see their Section 2 and Table 1). To include the effects of a dissipative component we replaced 10% of the stellar mass in the initial disks with isothermal gas at a temperature of approximately 10000 K. The initial scale length of the stellar disk was equal to that of the gas disk. Each galaxy had a stellar bulge with 1/3 of the disk mass and was embedded in a pseudo-isothermal halo to guarantee a flat rotation curve at large radii. The gas disks were represented by 20000 SPH particles (6666 for the low mass disks) other particle numbers are as in Naab & Burkert (2003). All galaxies approached each other on a nearly parabolic orbit with a pericenter distance of two disk scale lengths. The evolution of the stellar and the gas kinematics was computed with the N-body/SPH code VINE using an isothermal equation of state for the gas.
In this paper we analyzed mergers with 16 different initial disk orientations and mass ratios 1:1 and 3:1 (geometries 1-16 in Naab & Burkert 2003, geometries 17-32 for the 3:1 mergers did not change the results presented here). We followed every merger by analyzing snapshots in the orbital plane approximately every half-mass rotation period of the more massive disk. To avoid unrealistic values for when the galaxies overlap, we computed the effective radius of every galaxy as the projected spherical half-mass radius of the stellar particles within 5 scale lengths, taking into account only particles of the galaxy itself. In addition, we computed the projected central stellar velocity dispersion for each galaxy within taking all stellar particles into account. For each merger we have computed the time evolution of the apparent mass ratio as , where the indices 1 and 2 declare the most and the least massive progenitor respectively. In Fig. 6 we show the apparent mass ratios as a function of distance (in units of disc scale lenghts) for all 1:1 and 3:1 merger remnants.
Equal-mass mergers show apparent mass ratios in the range of which are very similar to the true mass ratio, independent of separation. For 3:1 remnants, however, the scatter is larger and the apparent mass ratio is in the range for distances greater than 10 scale lengths. In particular, there is a trend for to decrease with decreasing distance which is mainly due to tidal heating of the low mass companion and not to a change in . At distances below 5 scale lengths, a merger with an intrinsic mass ratio of 3:1 can easily be misclassified as 2:1. Given that the average half-light radius of this ULIRG sample is 2.2 kpc (and that ), 5 disk scale lengths equal 6.6 kpc. More than half of the mergers we observed have a nuclear separation 6.6 kpc. Thus, the number of unequal-mass mergers that are able to lead to ultraluminous activity may be higher than what is measured. However, given that the majority ( 60%) of the sources are almost equal mass mergers, we do not expect the dynamical heating to drastically change our conclusions.
7 Conclusions
We have acquired spectroscopic H-band, long-slit data of 21 ULIRGs at a variety of prior to coalescence merger phases to study the mass ratios of the interacting objects that typically trigger ultraluminous activity. Analysis of the kinematics indicates that the mean dispersion of these ULIRGs is 142 km s-1. The dynamical heating that occurs during the merger leads to a low rotational component of the velocity compared to that of spirals, as the simulations of Mihos (2000) predicted. The mean inclination-corrected / ratio of this sample is 0.77. The mean mass ratio of the ULIRG progenitors is 1.5:1, which indicates that ULIRGs are mainly the products of almost equal mass mergers. Less frequently, 3:1 mergers appear in our sample. However, our simulations show that the unequal-mass merger categories may be undersampled due to dynamical heating and projection effects. We do not find significant evidence for minor mergers of progenitor mass ratio greater than 4:1; only one source, IRAS 10565+2448, appears as a minor merger in NIR images. However, the luminosity ratio of individual sources may significantly deviate from the actual mass ratio due to extinction and population effects. Using the stellar dynamics is the most robust way to determine the mass content of a ULIRG. On a statistical basis, the mass ratios implied by our kinematical analysis agree with the 1 Jy sample (R-band) luminosity ratios. The major mergers are typically those that are violent enough to drive an adequate amount of gas to the center of the system and trigger ultraluminous infrared bursts.
Appendix A APPENDIX: Notes on individual sources
IRAS 00199-0738: This object may be a multiple merger according to Duc et al. (1997). Our spectroscopy shows that the nucleus to the north of the brightest nucleus is probably not at the same redshift, and does not belong to the same system. The radial distribution of the sources to the west and south-east also matches better that of a point-like (rather an extended) source which is broadened due to seeing. It is thus possible that none of these sources belongs to the particular merger.
IRAS 02364-4751: The spectroscopic results for this source indicate that the difference in the dispersion of the two nuclei is 51 km s-1. Given the phase of the merger (nuclear separation of 1.5 kpc), one would expect smaller deviations in the progenitor dispersions which should be closer to their common equilibrium value. However, the spectroscopic results show that the south nucleus has a large recession velocity with respect to its counterpart. This fact, combined with the proximity of the sources (that leads to a spatial overlap of the spectra of the two nuclei) gives rise to an unrealistic increase of the southern nucleus dispersion.
IRAS 10565+2448: A dwarf galaxy is seen at 6.5 kpc south-east of the bright nucleus, while the second nucleus of the merging system is at the north-east of the bright nucleus (see Murphy et al. 1996). The value of this source is more likely between the inclination corrected and non-corrected one, because it is in an early merger stage (nuclear separation of 21.7 kpc), thus its and ratio will probably be closer to those of a spiral.
IRAS 11095-0238: Recent H-band imaging obtained with the NICMOS camera at the HST confirms that this is a close binary system (Veilleux et al. 2006, in preparation).
IRAS 12071-0444: This source was presented in Tacconi et al. (2002) as a merged system. The data presented here (taken under better seeing conditions) show the presence of two separate nuclei. HST NICMOS observations have also indicated the presence of two nuclei (Veilleux et al. 2006, in preparation).
IRAS 20046-0623: While two nuclei appear in the H-band images of this source, IRAS 20046-0623 has often been treated as a single object in the literature due to the faintness of the eastern nucleus and the phase of the merger. We have been able to extract the structural parameters and the spectroscopic results of the west, bright nucleus only.
IRAS 21329-2346: When deriving the H-band luminosity ratio of this system from the (non-PSF subtracted) NICMOS images of Veilleux et al. (2006, in preparation), we find a luminosity ratio of 2.53, in good agreement with our results.
References
- Barnes (2001) Barnes, J. E. 2001, ASP Conference Series 245: Astrophysical Ages and Timescales, eds. T. von Hippel, C. Simpson, N. Manset (San Fransisco: ASP), 382
- Bender (1990) Bender, R. 1990, A&A, 229, 441
- Bendo & Barnes (2000) Bendo, G. J., & Barnes, J. E. 2000, MNRAS, 316, 315
- Bertin & Arnouts (1996) Bertin, E., & Arnouts, S. 1996, A&AS, 117, 393
- Binney & de Vaucouleurs (1981) Binney, J., & de Vaucouleurs, G. 1981, MNRAS, 194, 679
- Binney & Tremaine (1987) Binney J., & Tremaine S. 1987, Galactic Dynamics, Princeton Series in Astrophysics, Third printing with corrections (1994)
- Bryant & Scoville (1999) Bryant, P. M., & Scoville, N. Z. 1999, AJ, 117, 2632
- Burkert & Naab (2005) Burkert, A. & Naab, T. 2005, MNRAS, in press (astro-ph/0504595)
- Dasyra et al. (2006) Dasyra, K. M., et al. 2006, in preparation
- Duc et al. (1997) Duc P.-A., Mirabel, I.F., & Maza, J. 1997, A&AS, 124, 533
- Downes & Solomon (1998) Downes, D., & Solomon, P.M. 1998, ApJ, 507, 615
- Efstathiou & Rees (1988) Efstathiou, G., & Rees, M. J. 1988, MNRAS, 230P, 5
- Gebhardt et al. (2001) Gebhardt, K., Bender, R., Bower, G., Dressler, A., Faber, S. M., Filippenko, A. V., Green, R., Grillmair, C., Ho, L. C., Kormendy, J., Lauer, T. R., Magorrian, J., Pinkney, J., Richstone, D., & Tremaine, S. 2001, ApJ, 555L, 75
- Genzel et al. (1998) Genzel, R., Lutz, D., Sturm, E., Egami, E., Kunze, D., Moorwood, A. F. M., Rigopoulou, D., Spoon, H. W. W., Sternberg, A., Tacconi-Garman, L. E., Tacconi, L., & Thatte, N. 1998, ApJ, 498, 579
- Genzel et al. (2001) Genzel, R., Tacconi, L. J., Rigopoulou, D., Lutz, D., & Tecza, M. 2001, ApJ, 563, 527
- Haehnelt (2004) Haehnelt, M. G. 2004, in Carnegie Observatories Astrophysics Series, Vol. 1: Coevolution of Black Holes and Galaxies, ed. L.C. Ho (Cambridge: Cambridge Univ. Press), 406; (astro-ph/0307378)
- Ishida (2004) Ishida, C. M. 2004, Ph. D. Thesis, University of Hawaii
- Kauffmann & Haehnelt (2000) Kauffmann, G., & Haehnelt, M. 2000, MNRAS, 311, 576
- Kim & Sanders (1998) Kim, D.-C., & Sanders, D. B. 1998, ApJS, 119, 41
- Kim et al. (2002) Kim, D.-C., Veilleux, S., & Sanders, D. B. 2002, ApJS, 143, 277
- Lutz et al. (1999) Lutz, D., Veilleux, S., & Genzel, R. 1999, ApJ, 517L, 13
- Merritt & Ferrarese (2001) Merritt, D., Ferrarese, L. 2001, ApJ, 547, 140
- Mihos & Hernquist (1994) Mihos, J. C., & Hernquist, L. 1994, ApJ, 431, L9
- Mihos & Hernquist (1996) Mihos, J. C., & Hernquist, L. 1996, ApJ, 464, 641
- Mihos (1999) Mihos, J. C. 1999, Ap&SS, 266, 195
- Mihos (2000) Mihos, J. C. 2000, ASPC, 197, 275
- Moorwood et al. (1998) Moorwood, A. F. M., et al. 1998, Messenger, 94, 7
- Moshir et al. (1990) Moshir, M., et al. 1990., IRAS Faint Source Catalogue, version 2.0., 1990IRASF,C, 0
- Murphy et al. (1996) Murphy, T. W., Jr., Armus, L., Matthews, K., Soifer, B. T., Mazzarella, J. M., Shupe, D. L., Strauss, M. A., & Neugebauer, G. 1996, AJ, 111,1025
- Naab & Burkert (2003) Naab, T., & Burkert, A. 2003, ApJ, 597, 893
- Rigopoulou et al. (1999) Rigopoulou, D., Spoon, H. W. W., Genzel, R., Lutz, D., Moorwood, A. F. M., & Tran, Q. D. 1999, AJ, 118, 2625
- Sanders & Mirabel (1996) Sanders, D. B., & Mirabel, I. F. 1996, ARA&A,34,749
- Scoville et al. (2000) Scoville, N. Z., Evans, A. S., Thompson, R., Rieke, M., Hines, D. C., Low, F. J., Dinshaw, N., Surace, J. A., & Armus, L. 2000 AJ, 119, 991
- Springel et al. (2005) Springel, V., di Matteo, T., & Hernquist, L. 2005, MNRAS, 361, 776
- Surace et al. (1998) Surace, J. A.. Sanders, D. B., Vacca, W. D., Veilleux, S., & Mazzarella, J. M. 1998 ApJ, 492, 116
- Tacconi et al. (2002) Tacconi, L. J., Genzel, R., Lutz, D., Rigopoulou, D., Baker, A. J., Iserlohe, C., & Tecza, M. 2002, ApJ, 580, 73
- Tecza et al. (2000) Tecza, M., Genzel, R., Tacconi, L. J., Anders, S., Tacconi-Garman, L. E., & Thatte, N. 2000, ApJ, 537, 178
- Tremaine et al. (2002) Tremaine, S., Gebhardt, K., Bender, R., Bower, G., Dressler, A., Faber, S. M., Filippenko, A. V., Green, R., Grillmair, C., Ho, L. C., Kormendy, J., Lauer, T. R., Maggorian, J., Pinkney, J., & Richstone, D. 2002 ApJ, 574, 740
- Veilleux et al. (2002) Veilleux, S., Kim, D.-C., & Sanders, D. B. 2002, ApJS, 143, 315
- Veilleux et al. (2006) Veilleux, S., et al. 2006, in preparation
| Galaxy | RA | Dec | log(L⊙) | slit P.A. | ||
|---|---|---|---|---|---|---|
| (IRAS) | (2000) | (2000) | (∘) | (mins) | ||
| 00199-7426 aaThis source may be a multiple merger (see the Appendix). | 00:22:07.0 | -74:09:42 | 0.096 | 12.23 | -15,75,74 | 60,60,60 |
| 01166-0844 | 01:19:07.6 | -08:29:10 | 0.118 | 12.03 | -60,29,29 | 60,60,60 |
| 02364-4751 | 02:38:13.1 | -47:38:11 | 0.098 | 12.10 | 0,90 | 60,50 |
| 06035-7102 | 06:02:54.0 | -71:03:10 | 0.0795 | 12.12 | 65,153,153 | 60,50,60 |
| 10190+1322 | 10:21:42 | 13:07:01 | 0.077 | 12.00 | 64,149,149 | 40,40,40 |
| 10565+2448 | 10:59:18.1 | 24:32:34 | 0.0431 | 12.02 | -66,24 | 40,40 |
| 11095-0238 | 11:12:03 | -02:54:18 | 0.106 | 12.20 | 39,129 | 120,120 |
| 12071-0444 | 12:09:45.1 | -05:01:14 | 0.128 | 12.35 | -1,89 | 60,60 |
| 12112+0305 | 12:13:47 | 02:48:34 | 0.073 | 12.28 | 37,99 | 60,60,40 |
| 13335-2612 | 13:36:22 | -26:27:31 | 0.125 | 12.06 | -5 | 100 |
| 13451+1232 | 13:47:33 | 12:17:23 | 0.122 | 12.28 | 104,13 | 80,120 |
| 16156+0146 | 16:18:08 | 01:39:21 | 0.132 | 12.04 | -50,-51,40,40 | 60,60,60,60 |
| 16300+1558 | 16:32:20 | 15:51:49 | 0.242 | 12.63 | -1,89 | 150,90 |
| 19254-7245 | 19:31:21.4 | -72:39:18 | 0.0617 | 12.00 | -13,77 | 60,60 |
| 20046-0623 | 20:07:19.3 | -06:14:26 | 0.0844 | 11.97 | 69,159 | 60,60 |
| 21130-4446 | 21:16:18.5 | -44:33:38 | 0.0926 | 12.02 | 33 | 40 |
| 21208-0519 | 21:23:29 | -05:06:59 | 0.13 | 12.01 | -164,109,109 | 60,60,60 |
| 21329-2346 | 21:35:45 | -23:32:36 | 0.125 | 12.09 | 31 | 60 |
| 22491-1808 | 22:51:49.2 | -17:52:23 | 0.0778 | 12.09 | -76,13,13 | 60,60,60 |
| 23128-5919 | 23:15:46.8 | -59:03:15 | 0.045 | 11.96 | -5,84,84 | 40,40,40 |
| 23234+0946 | 23:25:56.2 | 10:02:50 | 0.128 | 12.05 | -64,25 | 60,60 |
Note. — The coordinates, the redshift, the bolometric luminosity, as well as the slit positions and the respective integration time for our source list are presented in this Table.
| Galaxy | ellipticity | inclination | nuclear separation | ||
|---|---|---|---|---|---|
| (IRAS) | (kpc) | (∘) | (∘) | (kpc) | |
| 00199-7426 | 0.88 () | 0.115 | 29 | 18 | |
| 01166-0844(s) | 1.72 () | 0.177 | 37 | -10 | 12.2 (0.3) |
| 01166-0844(n) | 1.55 () | 0.178 | 37 | 61 | |
| 02364-4751(s) | 1.45 () | 0.250 | 44 | 52 | 1.6 (0.3) |
| 02364-4751(n) | 1.18 () | 0.217 | 41 | -78 | |
| 06035-7102(sw) | 1.79 () | 0.331 | 51 | 39 | 10.4 (0.2) |
| 06035-7102(ne) | 1.41 () | 0.398 | 57 | 34 | |
| 10190+1322(ne) | 1.43 () | 0.298 | 48 | 6 | 6.5 (0.2) |
| 10190+1322(sw) | 2.40 () | 0.223 | 41 | 37 | |
| 10565+2448(s) | 0.79 () | 0.042 | 17 | -84 | 23.3 (0.1) |
| 10565+2448(n) | 0.73 () | 0.125 | 30 | 72 | |
| 11095-0238(ne) | 2.07 () | 0.151 | 34 | 27 | 3.8 (0.3) |
| 11095-0238(sw) | 3.04 () | 0.398 | 57 | -22 | |
| 12071-0444(s) | 2.32 () | 0.095 | 26 | -68 | 2.8 (0.4) |
| 12071-0444(n) | 2.09 () | 0.083 | 25 | 71 | |
| 12112+0305(sw) | 0.81 () | 0.048 | 19 | 53 | 4.5 (0.2) |
| 12112+0305(ne) | 1.67 () | 0.413 | 58 | 12 | |
| 13335-2612(s) | 2.88 () | 0.598 | 74 | -34 | 3.9 (0.4) |
| 13335-2612(n) | 2.25 () | 0.098 | 27 | -55 | |
| 13451+1232(w) | 2.59 () | 0.094 | 26 | -1 | 5.3 (0.3) |
| 13451+1232(e) | 4.14 () | 0.168 | 36 | -3 | |
| 16156+0146(n) | 0.90 () | 0.128 | 31 | 89 | 8.8 (1.2) |
| 16156+0146(s) | 2.01 () | 0.626 | 76 | 1 | |
| 16300+1558(s) | 2.76 () | 0.227 | 42 | -67 | 5.6 (0.8) |
| 16300+1558(n) | 4.83 () | 0.351 | 53 | -14 | |
| 19254-7245(s) | 0.97 () | 0.288 | 47 | -21 | 10.2 (0.2) |
| 19254-7245(n) | 0.70 () | 0.091 | 26 | 12 | |
| 20046-0623(w) | 2.67 () | 0.673 | 82 | 6 | 4.4 |
| 20046-0623(e) | |||||
| 21130-4446(ne) | 1.71 () | 0.398 | 57 | 8 | 5.4 0.3) |
| 21130-4446(sw) | 2.69 () | 0.584 | 72 | 32 | |
| 21208-0519(s) | 3.66 () | 0.139 | 32 | 21 | 17.9 (0.4) |
| 21208-0519(n) | 2.34 () | 0.257 | 45 | -33 | |
| 21329-2346(n) | 1.70 () | 0.312 | 50 | -46 | 3.1 (0.4) |
| 21329-2346(s) | 1.42 () | 0.128 | 31 | -88 | |
| 22491-1808(e) | 1.99 () | 0.370 | 54 | -62 | 3.3 (0.2) |
| 22491-1808(w) | 1.77 () | 0.088 | 25 | 44 | |
| 23128-5919(n) | 4.20 () | 0.244 | 43 | -11 | 4.3 (0.1) |
| 23128-5919(s) | 4.16 () | 0.296 | 48 | -7 | |
| 23234+0946(n) | 2.12 () | 0.154 | 34 | -32 | 9.4 (0.4) |
| 23234+0946(s) | 3.28 () | 0.116 | 29 | -58 |
Note. — The ULIRG structural parameters are derived from the acquisition images. For each system, the nuclear separation is given once and the nucleus with the most massive bulge appears first.
| Source | (obs) aaVelocity corrected for deviations from the major axis of rotation. | bbObserved velocity corrected for inclination effects. | (Edd.) | ||||
|---|---|---|---|---|---|---|---|
| (IRAS) | (km s-1) | (km s-1) | (km s-1) | ( M⊙) | ( M⊙) | ||
| 00199-7426 | 137 ( 55) | 30 ( 13) | 76 | 0.22 | 0.76 | ||
| 01166-0844(s) | 156 ( 61) | 0.48 | |||||
| 01166-0844(n) | 116 ( 58) | 0.14 | |||||
| 02364-4751(s) | 151 ( 32) | 0.19 | |||||
| 02364-4751(n) | 100 ( 32) | 0.96 | |||||
| 06035-7102(sw) | 136 ( 24) | 41 ( 13) | 52 | 0.30 | 0.20 | ||
| 06035-7102(ne) | 125 ( 16) | 14 ( 15) | 17 | 0.11 | 0.57 | ||
| 10190+1322(ne) | 169 ( 35) | 107 ( 17) | 143 | 0.63 | 0.11 | ||
| 10190+1322(sw) | 127 ( 12) | 105 ( 42) | 159 | 0.83 | 0.25 | ||
| 10565+2448(s) | 125 ( 31) | 134 ( 23) | 446 | 1.07 | 0.68 | ||
| 10565+2448(n) | |||||||
| 11095-0238(ne) | 147 ( 32) | 0.27 | |||||
| 11095-0238(sw) | 137 ( 38) | 0.35 | |||||
| 12071-0444(s) | 143 ( 36) | 0.38 | |||||
| 12071-0444(n) | 130 ( 29) | 0.68 | |||||
| 12112+0305(sw) | 133 ( 10) | 34 ( 19) | 107 | 0.26 | 0.58 | ||
| 12112+0305(ne) | 124 ( 23) | 5 ( 18) | 6 | 0.04 | 0.50 | ||
| 13335-2612(s) | 175 ( 43) | 0.10 | |||||
| 13335-2612(n) | 140 ( 27) | 0.21 | |||||
| 13451+1232(w) | 167 ( 48) | 0.27 | |||||
| 13451+1232(e) | 146 ( 28) | 0.20 | |||||
| 16156+0146(n) | 189 ( 27) | 0.09 | |||||
| 16156+0146(s) | |||||||
| 16300+1558(s) | 141 ( 47) | 0.85 | |||||
| 16300+1558(n) | |||||||
| 19254-7245(s) | 175 ( 24) | 99 ( 22) | 135 | 0.57 | 0.12 | ||
| 19254-7245(n) | 120 ( 19) | 47 ( 34) | 113 | 0.39 | 0.23 | ||
| 20046-0623(w) | 145 ( 14) | 103 ( 13) | 104 | 0.71 | 0.33 | ||
| 20046-0623(e) | |||||||
| 21130-4446(ne) | 165 ( 37) | 0.14 | |||||
| 21130-4446(sw) | 152 ( 28) | 0.12 | |||||
| 21208-0519(s) | 171 ( 22) | 0.06 | |||||
| 21208-0519(n) | 126 ( 21) | 0.44 | |||||
| 21329-2346(n) | 115 ( 21) | 0.78 | |||||
| 21329-2346(s) | 113 ( 22) | 0.36 | |||||
| 22491-1808(e) | 146 ( 20) | 16 ( 31) | 20 | 0.11 | 0.18 | ||
| 22491-1808(w) | 121 ( 34) | 27 ( 50) | 64 | 0.23 | 0.51 | ||
| 23128-5919(n) | 151 ( 21) | 29 ( 16) | 43 | 0.20 | 0.09 | ||
| 23128-5919(s) | 148 ( 18) | 82 ( 12) | 110 | 0.56 | 0.20 | ||
| 23234+0946(n) | 152 ( 23) | 0.26 | |||||
| 23234+0946(s) | 113 ( 40) | 0.23 |
| Galaxy | (bulge) aaBulge mass ratio calculated using the stellar dispersion and the effective radius of each progenitor. | bbTotal mass ratio calculated using the stellar dispersion, rotational velocity (whenever possible), and effective radius of each progenitor. | (aperture) ccTotal mass ratio calculated within a constant aperture, common for both progenitors. | apert. (”) | (R band) | (K band) |
|---|---|---|---|---|---|---|
| IRAS 01166-0844 | 2.01 | 2.01 | 1.81 | 1.18 | 0.70 | 1.08 |
| IRAS 02364-4751 | 2.80 | 2.80 | 2.28 | 1.18 | ||
| IRAS 06035-7102 | 1.07 | 1.03 | 0.81 | 1.47 | 1.21 | 0.48 |
| IRAS 10190+1322 | 0.95 | 1.16 | 0.69 | 1.47 | 1.74 | 0.71 |
| IRAS 11095-0238 | 1.28 | 1.28 | 0.87 | 0.88 | ||
| IRAS 12071-0444 | 1.34 | 1.34 | 1.21 | 1.03 | ||
| IRAS 12112+0305 | 1.48 | 1.22 | 0.72 | 1.47 | 1.56 | 0.59 |
| IRAS 13335-2612 | 2.00 | 2.00 | 1.56 | 1.47 | 1.03 | 1.20 |
| IRAS 13451+1232 | 1.22 | 1.22 | 0.76 | 1.76 | 1.10 | 0.43 |
| IRAS 14348-1447 | 1.05 | 1.06 | 1.29 | 1.26 | 1.64 | |
| IRAS 19254-7245 | 2.94 | 2.73 | 1.97 | 1.18 | 1.45 | 2.29 |
| IRAS 21130-4446 | 1.33 | 1.33 | 0.84 | 1.32 | 0.76 | 0.63 |
| IRAS 21208-0519 | 2.88 | 2.88 | 1.84 | 1.47 | 1.32 | 0.47 |
| IRAS 21329-2346 | 1.24 | 1.24 | 1.04 | 0.88 | ||
| IRAS 22491-1808 | 1.64 | 1.51 | 1.34 | 1.04 | 1.10 | 0.95 |
| IRAS 23128-5919 | 0.95 | 1.10 | 1.11 | 2.35 | 1.20 | 1.91 |
| IRAS 23234+0946 | 1.17 | 1.17 | 1.81 | 1.76 | 2.38 | 3.70 |
| arp 220 | 1.23 | 1.37 | ||||
| NGC 6240 | 1.00 | 1.01 |
Note. — The total baryonic mass ratio at the half-light-radius, and at a specific aperture (given in the fourth column), the bulge mass ratio and the R and K luminosity ratios of the progenitors can be found in this Table.
![[Uncaptioned image]](/html/astro-ph/0510670/assets/x3.png)
Fig. 2 continued.
![[Uncaptioned image]](/html/astro-ph/0510670/assets/x4.png)
Fig. 2 continued.
![[Uncaptioned image]](/html/astro-ph/0510670/assets/x5.png)
Fig. 2 continued.
![[Uncaptioned image]](/html/astro-ph/0510670/assets/x7.png)
Fig. 3 continued.