1]Department of Physics and Astronomy, University of California Irvine 2]UCO/Lick Observatory, Board of Studies in Astronomy and Astrophysics, University of California Santa Cruz 3]Dipartimento di Astronomia, Università di Bologna
Temperature and Dark Matter Profiles of Galaxy Groups
Abstract
The Chandra and XMM data for a sample of 19 relaxed groups/poor clusters,
covering the temperature range 1-3 keV and selected to have the best available
data, reveal a remarkable similarity in their temperature profile: cool cores
outside of which the temperatures reach a peak for radii less than 0.1 and then decline.
We fitted the derived mass profiles using an NFW model, which provides
a good fit to the data when accounting for the central galaxy in the inner region.
The concentration parameters and virial masses are in the range = 5-22 and =
, in general agreement with the concentrations found in numerical simulations.
keywords:
X-rays: galaxies: clusters; galaxies: halos; dark matter1 Introduction
The nature of Dark Matter (DM) in the universe is one of the fundamental problems in astrophysics and cosmology. Crucial is the comparison of observation with N-body simulations in the currently favored CDM cosmology, which predicts a universal NFW profile for DM halos (Navarro et al., 1997). This prediction has been tested for the scale of hot, massive clusters (Pointecouteau et al., 2005; Vikhlinin et al., 2005) but few constraints exist on the group scale, where predictions for the statistical properties of DM halos are more accurate because a large number of objects can be simulated at once (e.g. Bullock et al., 2001). The distribution of concentration parameters () is expected to vary significantly as a function of the cosmological parameters (e.g. Kuhlen et al., 2005). A measure of the mean and scatter of at the group scale is a crucial test of the CDM model.
The inner halo profiles also reveal vital information about the interplay between the DM and baryons during group formation. It is expected that in the central region of group halos the pure NFW profile will be modified by adiabatic compression as a response to baryonic dissipation (Blumenthal et al., 1986). This raises the question whether the DM profile at the center of groups should be represented by a pure or modified (adiabatically compressed, AC) NFW profile. DM properties can strongly constrain the galaxy formation process.
2 Data analysis
2.1 Sample selection
The sample has been selected to cover the range in the temperature from 1 to 3 keV, the temperatures expected for groups/poor clusters, with as much as possible regular X-ray morphology and with a dominant elliptical galaxy at the center (the only exception being RGH80, with two ellipticals of comparable size at the center), to ensure dynamical relaxation.
2.2 Background subtraction
A correct background subtraction is a critical element of our analysis. We describe here the procedure adopted for XMM. Soft proton flares cleaning have been performed on a region free of the luminous core of the objects and point sources and using both a hard and 0.5-10 keV light curve. The background has been then entirely modeled with a procedure similar to Lumb et al. (2002). This method is particularly effective in studying groups because the source component (mainly characterized by the Fe-L blend) is clearly spectrally separated from all the other background components. The model has been applied to a simultaneous fit of source+background in the outer annuli to correctly determine the normalizations of the various background components.
2.3 From temperature and density profiles to mass profiles
Spectra were extracted in concentric circular annuli located at the X-ray centroid and fitted with an APEC modified by Galactic absorption. We projected parameterized 3D models for gas density and temperature to fit the results obtained from our spectral analysis (the projected gas mass density is derived from the APEC normalization). Using the best fit parameterized function we derive the total gravitating mass under the assumption of spherical symmetry and hydrostatic equilibrium. The virial quantities quoted in the poster are for an over-density of appropriate for the CDM model.
3 Temperature profiles
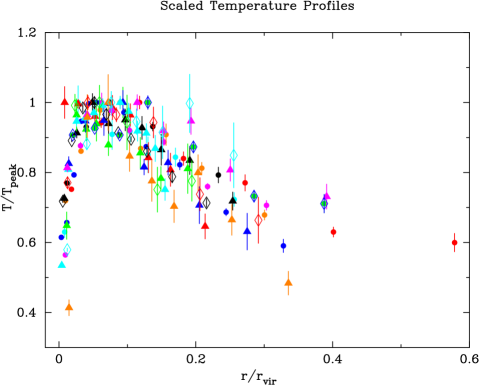
The temperature profiles for the systems, scaled by the virial radius obtained in the NFW fit, show a remarkable similarity. The shape resembles the one obtained for hotter, more massive clusters (e.g. Vikhlinin et al., 2005) but with the peak of the temperature profile occurring at smaller radii (see Fig.1). The central cooling region is smaller and can be extremely affected by non-gravitational processes like radiative cooling and AGN heating (as it is probably the case for AWM 7 which has an interesting isothermal central profile, O’Sullivan et al., 2005).
4 A case study: NGC 1550
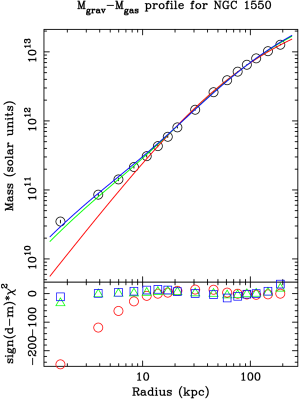
As an example of the procedure adopted for each object in the sample we show here the case of NGC 1550. We analyzed the two ACIS-I and XMM observations and fitted jointly the temperature and density profiles. The derived gravitating mass profile has been fitted by an NFW profile. The DM+stars profile (obtained by subtracting the gas mass from the gravitating mass) has been fitted by a pure NFW, an NFW + stellar component for the central galaxy, with the latter modeled by an Hernquist profile (Hernquist, 1990) or an AC model (Gnedin et al., 2004), as shown in Fig.2.
5 Variation of concentration with mass
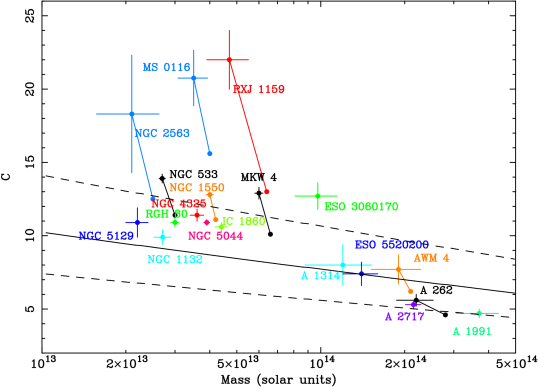
The resulting relation between and group mass is shown in Fig.3. An NFW profile is a good representation of the mass profiles observed; for 8 objects an excess compared to the NFW fit is present in the inner regions (as in NGC 1550): when fitted with an NFW+Hernquist or AC model, with the stellar mass free to vary, the returned stellar for the central galaxy are in the range 2-7. We can not discriminate between these two latter models. The inferred are considerably lower than the ones measured using stellar kinematics (e.g. Gerhard et al., 2001). The inclusion of the stellar component in these objects has the effect of lowering and increasing the mass. The typical values and scatter of concentrations are in general agreement with the simulation results, as shown in Fig.3. Even after the inclusion of adiabatic contraction the results tend to be higher than predicted: a possible explanation is that we are looking at a biased population of groups (relaxed, with some objects in our sample being classified as fossil groups, which should show an higher being formed at earlier epochs, Zentner et al., 2005).
Acknowledgments
We thank O. Gnedin for kindly providing his AC code.
References
- (1)
- Blumenthal et al. (1986) Blumenthal, G.R. et al. 1986, ApJ, 301, 27
- Bullock et al. (2001) Bullock, J. et al. 2001, MNRAS, 321, 559
- Gerhard et al. (2001) Gerhard, O. et al. 2001, ApJ, 121, 1936
- Gnedin et al. (2004) Gnedin, O. Y. et al. 2004, ApJ, 616, 16
- Hernquist (1990) Hernquist, L. 1990, ApJ, 356, 339
- Kuhlen et al. (2005) Kuhlen, M. et al. 2005, MNRAS, 357, 387
- Lumb et al. (2002) Lumb, D. et al. 2002, A&A, 389, 93
- Navarro et al. (1997) Navarro, J. et al. 1997, ApJ, 490, 493
- O’Sullivan et al. (2005) O’Sullivan, E. et al. 2005, MNRAS, 357, 1134
- Pointecouteau et al. (2005) Pointecouteau, E. et al. 2005, A&A, 435, 1
- Vikhlinin et al. (2005) Vikhlinin, A. et al. 2005, astro-ph 0507902
- Zentner et al. (2005) Zentner, A.R. et al. 2005, ApJ, 624, 505