The Cosmic Infrared Background Experiment
Abstract
The extragalactic background, based on absolute measurements reported by DIRBE and IRTS at 1.2 and 2.2 , exceeds the brightness derived from galaxy counts by up to a factor 5. Furthermore, both DIRBE and the IRTS report fluctuations in the near-infrared sky brightness that appear to have an extra-galactic origin, but are larger than expected from local (z = 1-3) galaxies. These observations have led to speculation that a new class of high-mass stars or mini-quasars may dominate primordial star formation at high-redshift , which, in order to explain the excess in the near-infrared background, must be highly luminous but produce a limited amount of metals and X-ray photons. Regardless of the nature of the sources, if a significant component of the near-infrared background comes from first-light galaxies, theoretical models generically predict a prominent near-infrared spectral feature from the redshifted Lyman cutoff, and a distinctive fluctuation power spectrum.
We are developing a rocket-borne instrument (the Cosmic Infrared Background ExpeRiment, or CIBER) to search for signatures of primordial galaxy formation in the cosmic near-infrared extra-galactic background. CIBER consists of a wide-field two-color camera, a low-resolution absolute spectrometer, and a high-resolution narrow-band imaging spectrometer.
The cameras will search for spatial fluctuations in the background on angular scales from to , where a first-light galaxy signature is expected to peak, over a range of angular scales poorly covered by previous experiments. CIBER will determine if the fluctuations reported by the IRTS arise from first-light galaxies or have a local origin. In a short rocket flight CIBER has sensitivity to probe fluctuations fainter than IRTS/DIRBE, with sufficient resolution to remove local-galaxy correlations. By jointly observing regions of the sky studied by Spitzer and ASTRO-F, CIBER will build a multi-color view of the near-infrared background, accurately assessing the contribution of local (z = 1-3) galaxies to the observed background fluctuations, allowing a deep and comprehensive survey for first-light galaxy background fluctuations.
The low-resolution spectrometer will search for a redshifted Lyman cutoff feature between 0.8 - 2.0 . The high-resolution spectrometer will trace zodiacal light using the intensity of scattered Fraunhofer lines, providing an independent measurement of the zodiacal emission and a new check of DIRBE zodiacal dust models. The combination will systematically search for the infrared excess background light reported in near-infrared DIRBE/IRTS data, compared with the small excess reported at optical wavelengths.
keywords:
extragalactic background , primordial galaxies , infrared1 The Infrared Background
Is the infrared background (IRB) entirely produced by discrete local galaxies, or is there an unaccounted component? Integrated individual galaxy counts appear to fall short of the IRB measured with absolute photometry at near-infrared wavelengths. The cause is either unaccounted systematic errors, or a tantalizing clue to new cosmology: a diffuse IRB component from the early universe. A new population of energetic sources at high redshift Wyithe03 , Cooray04b , Madau05 would be needed to explain the intensity of the near-infrared background as reported by several authors. Because the infrared background may have profound implications for cosmology, these measurements must be confirmed by independent means.
The IRB may be studied with absolute photometry or integrated number counts of galaxies. Both methods are confronted with systematic errors. With absolute photometry, one must account for instrument emission and baselines, and remove local foregrounds, namely stars, interstellar dust, interplanetary dust emission, at mid-infrared and far-infrared wavelengths, and sunlight scattered by interplanetary dust (’zodiacal light’), at optical and near-infrared wavelengths Hauser01 . Galaxy counts could possibly under-count flux from diffuse components or miss objects with low surface brightness, especially in ground-based infrared surveys using spatial chopping (see Totani01 for a quantitative assessment).
We compile recent measurements of the extragalactic near-infrared/optical background in Figure 1 based on DIRBE Wright01 , Cambresy01 , Xu02 , Gorjian00 , Dwek98 , Hauser98 , IRTS Matsumoto05 , HST Bernstein02a , and optical measurements Dube79 , Toller83 for absolute photometery, and integrated galaxy number counts Totani01 , Madau00 , Fazio04 .
In the near-infrared and optical bands, the dominant foreground contaminant is zodiacal light. The IRTS and many DIRBE-based results use a model of IPD scattering and emission Kelsall98 . Wright 2001 and Gorjian et al. (2000) use a different model based on the principle that the zodiacal residual be zero at 25 at high ecliptic latitude Wright97 . The optical measurement of Bernstein et al. 2002 subtracts zodiacal emission based on the observed strength of scattered Fraunhofer lines from a ground-based measurement Bernstein02b . Unfortunately, zodiacal dust models are not unique and represent a leading source of systematic error.
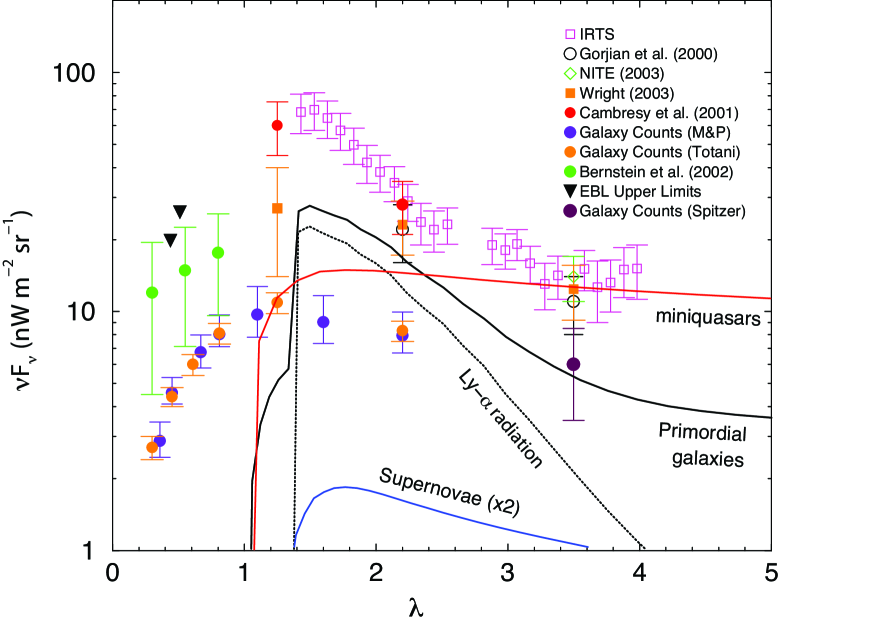
Nevertheless, Figure 1 shows an intriguing trend: the integrated galaxy counts appear to fall well short of the IRB measured with absolute photometry in the near-infrared (particularly in the 1.2 and 2.2 DIRBE bands), but are marginally consistent with the HST data at optical wavelengths, and with Spitzer at 3.6 . Furthermore, the absolute photometry measurements appear to show a broad maximum at 1-2 . This peak is either pronounced (the IRTS spectrum), or modest (the Wright data points). Clearly one must be duly cautious of systematic errors. However, the data may be hinting at the existence of a low-surface brightness component with a spectrum peaked at 1-2 , which is the generic Ly-cutoff signature one expects from first-light galaxies at high redshift.
2 The Cosmic Infrared Background ExpeRiment
DIRBE and the IRTS have carried out a comprehensive measurement of the infrared sky brightness with absolute photometry, in the case of DIRBE involving highly redundant all-sky measurements. Nevertheless, key attributes of the IRB remain unexplored, and can be addressed in a short sounding rocket experiment, needed to escape strong airglow emission Ramsay92 , airglow . CIBER will search for a first-light component to the IRB by studying the spatial anisotropy of the IRB on angular scales from to . A fluctuations experiment has to potential to probe for a first-light galaxy (FLG) IRB component to a level roughly an order of magnitude fainter Cooray04a , Kashlinsky04 than has been realized with absolute photometry. CIBER will study the absolute spectrum of the IRB in the uncovered region between HST at 0.8 and IRTS and DIRBE at 1.2 . Finally, CIBER will measure the intensity of the zodiacal foreground using near-infrared Fraunhofer lines, allowing an independent check of the Kelsall et al. zodiacal dust model.
Wide-Field Imagers
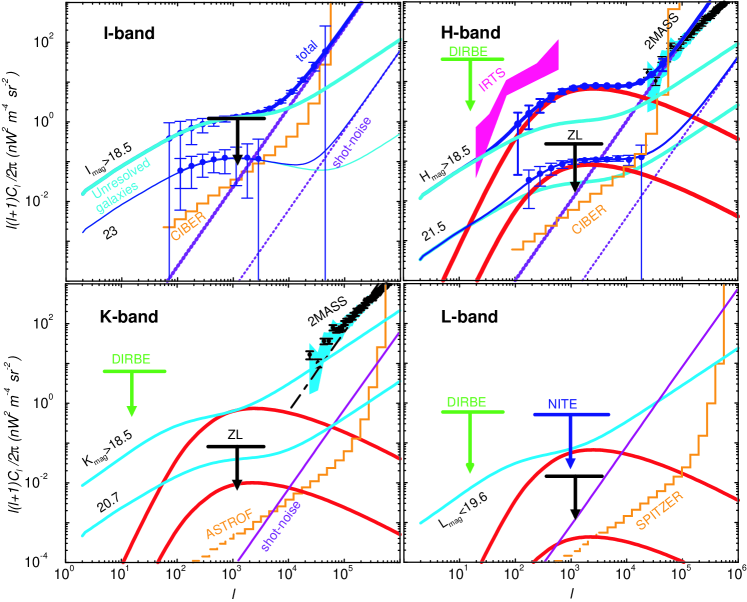
CIBER’s imager optics are designed to detect FLG-IRB fluctuations from high redshift by producing deep, wide-field images on spatial scales from to . Fluctuations from foregrounds (e.g. zodiacal light, galaxies) can be discriminated by using spatial spectra from the two bands (see Figure 2). The imager data will be combined with shallow Spitzer and ASTRO-F survey fields to allow us to detect and remove galaxies to a deeper level than possible with CIBER alone. Spitzer and ASTRO-F will make significant contributions in this field (see Kashlinsky05 ); however, CIBER images at shorter wavelengths, which is especially important if the fluctuating component shows a redshift-integrated Ly-cutoff signature. Furthermore, CIBER is a wide-field instrument optimized to detect FLG-IRB fluctuations on large angular scales, with the wide multipole coverage needed to discriminate local-galaxy fluctuations. By observing the same fields as ASTRO-F and Spitzer, CIBER provides a powerful check of systematic artifacts (e.g. flat fielding and mosaicing) between instruments, and the combination gives comprehensive multi-color information.
The wide-field camera is a 10-cm refracting telescope cooled to 77 K, imaging onto a HgCdTe focal plane array and providing pixels and a field of view. The detector array, sampled every 1.7 s with a 25 s reset interval, provides background-limited performance. A cold shutter allows us to record dark frames prior to launch, and on descent after observations have completed. In the limited observation time available on a sounding rocket flight, the cameras provide high sensitivity to diffuse emission, with fidelity to signals on large angular scales. Note that the sensitivity shown in Table 1 and Figure 2 is for only a single 50 s field, and we will have six such fields in a flight.
Table 1: Imager Specifications Aperture 11 cm Pixel size arcsec FOV degrees 0.95(I) 1.6(H) 0.5 0.5 Array QE 0.65 0.75 Optics QE 0.85 0.85 Photo current 12 11 Dark current Read noise (CDS) 15 15 (inst) 39 19 CIBER source cut 18.6 () 18.0 () vega mag 2.2e3 4.5e3 sources sq degree Deep galaxy cut 23.0 21.4 vega mag 6e4 6e4 sources sq degree sensitivities quoted for a 50 s observation
CIBER reaches a limiting point source sensitivity of I = 18.5 and H = 17.8 mag (), somewhat deeper than the 2MASS all-sky survey. Source confusion Madau00 is 2-3 times fainter than the instrument noise level, assuming that pixels are clipped at . In order to remove the local-galaxy clustering foreground more completely, deeper removal of point sources will be necessary. The pixel size of is chosen to give us a sufficient density of pixels to remove sources down to I = 23, H = 21.5 using ancillary ground-based data. CIBER pixels may be simply masked down to these cutoff magnitudes with acceptable () data loss.
CIBER has the sensitivity to detect even the fluctuations from the pessimistic first-light galaxy model. We note that the optimistic first-light galaxy model assumes highly biased formation and contributes to the IRB; the pessimistic model assumes moderately biased formation and contributes . Thus a comprehensive fluctuations measurement can probe for a first-light galaxy component to very low levels, well below the current state of controversy in the IRB measurements (and see Aharonian05 ).
Low-Resolution Spectrometer
The low-resolution spectrometer is designed to measure the absolute spectrum of the near-infrared background in the 0.8-2.0 spectral region, in a search for a redshifted Ly-cutoff feature from first-light galaxies. As shown in Figure 1, the IRB may peak at 1-2 , and fall in brightness in the optical. The transition from the near-infrared to the optical, if present, would have a much different spectral shape than either zodiacal light or the integrated counts of galaxies, and could be detected without precise removal of the zodiacal foreground.
The spectrometer is a 7.3 cm refracting telescope with re-imaging optics. A prism inserted in the collimated beam produces low-resolution spectra (, ). We use a HgCdTe array with a pixel size of 40 , producing pixels and total field of view of . Four slits located at the field stop produce strips on the sky, which the prism disperses into separate spectra on the array. As a result, 256 spectra are available for each slit, and a total of 1024 spectra are obtained.
Table 2: Low-Resolution Spectrometer Specifications Aperture 7.3 cm Pixel size arcmin FOV degrees Wavelength range 0.8 - 2.0 Resolution = 21-23 Slit size arcmin Optics QE 0.8 Array QE 0.5 Photo current Dark current Read noise (CDS)
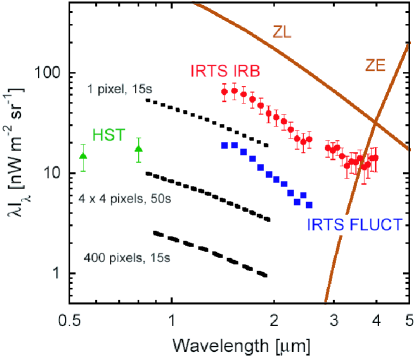
The expected sensitivity of the spectrometer, which achieves background-limited performance, is shown in Figure 3 together with the zodiacal sky brightness, and the IRB residual brightness and fluctuation spectra reported by the IRTS. The specifications of the spectrometer are summarized in Table 2. In order to obtain an accurate spectrum of the sky, we may co-add independent spectra. After rejecting spectra that include point sources brighter than mag using the imager data, 400 such spectra can be co-added. The resulting sensitivity allows us to detect the absolute sky brightness with S/N 100 in only 15 s of integration time. By co-adding four spatial and four spectral pixels, we can detect IRTS/DIRBE fluctuations with , and we anticipate having 300 such spatially independent pixels to this sensitivity.
High-Resolution Spectrometer
Uncertainties in zodiacal foreground removal play a leading role in the systematic errors in determining the IRB, as evident by the large dispersion of data points at 1.2 in Figure 1, which are the result of using different zodiacal dust models based on DIRBE observations.
Prominent features in the solar spectrum can be used to trace the zodiacal light since it is dominated by scattered sunlight at these wavelengths. Narrow-band spectroscopy, centered on and just off a Fraunhofer line, has been used to estimate and remove the zodiacal light for optical extragalactic background measurements Bernstein02a , Dube79 , and to study the dynamics of the zodiacal dust cloud Reynolds04 . While simple in concept, this technique is prone to its own set of systematic errors Mattila03 , most notably absolute calibration, atmospheric extinction, atmospheric scattering of zodiacal light and Galactic starlight, and even atmospheric scattering of reflections off the ground. Airglow emission greatly complicates measurements at from the ground.
With a small cooled spectrometer on a sounding rocket, we can measure near-IR Fraunhofer features for direct comparison to the DIRBE zodiacal model, avoiding the systematic errors associated with atmospheric scattering, and can absolutely calibrate the instrument with a beam-filling source in the lab.
The narrow-band spectrometer is a 7.5 cm imaging refractor with a narrow-band filter placed as the first optical element. Rays passing through such a dielectric etalon experience a wavelength shift , where is the angle of the ray inside the dielectric. Thus the wavelength response of the spectrometer varies over the array, by an amount depending of the field of view. This can be tailored so that the response at the array center is tuned on the absorption feature, and shifts entirely off the feature at the edge of the array.
Table 3: High-Resolution Spectrometer Specifications Aperture 7.5 cm Pixel size arcmin FOV degrees Resolution 1000 Filter QE 0.7 Optics QE 0.9 Array QE 0.65 Photo current 1.5 Dark current Read noise (CDS) 20 Wavelength 0.8542 1.069 Line strength 0.27 0.07 nm Contrast 25 6 (sky at NEP) 550 450 55 60 SN zodi 170 40 pix (zodiacal zero point) 3 12 sensitivities quoted for a 50 s observation
As shown in Table 3, the spectrometer can infer the zodiacal intensity with observing a collection of lines at 1.07 , or observing the 0.85 CaII line, at the north ecliptic pole in a 50 s observation (and with higher S/N at lower ecliptic latitudes). The photon level, signal contrast, and the per pixel are low, so careful attention must be paid to dark current, stray light, and out-of-band blocking. We will accurately measure the dark current in flight using a cold shutter.
To compare with the Kelsall et al. zodiacal dust model, we must use the measured zodiacal color from the low-resolution spectrometer to extrapolate the zodiacal signal to the 1.2 and 2.2 DIRBE bands. The low-resolution spectrometer data are essential because the zodiacal spectrum departs from the solar spectrum around , and has not been accurately measured at .
Finally we note the Fraunhofer line measurements provide an absolute tracer of the zodiacal foreground, and combined with the low-resolution spectrometer, allow a determination of the absolute infrared background from 0.8 - 2.0 .
3 Summary
Because CIBER has multiple capabilities, we summarize the measurement objectives. CIBER will:
-
•
Probe the IRTS fluctuations in several fields with higher signal-to-noise, using spatial and color information to determine if the IRTS fluctuations arise from zodiacal, Galactic, local-galaxy clustering, or first-light galaxy origins.
-
•
Use CIBER’s higher sensitivity, higher angular resolution, and deeper point source removal than IRTS to probe the spectrum of IRB fluctuations for a FLG-IRB component at a level fainter than the IRTS fluctuations. Combine CIBER data with ASTRO-F and Spitzer surveys for the definitive data set for IRB fluctuations in 4 bands from 0.9 to 3.6 .
-
•
Search for the Lyman cutoff signature of reionization in the IRB between the optical and near-infrared IRB measurements.
-
•
Measure the zodiacal foreground in several fields using a narrow-band spectrometer to trace scattered near-infrared Fraunhofer absorption features. Current zodiacal model discrepancies based on DIRBE are at the level, producing large discrepancies in the derived IRB.
-
•
Combine the low-resolution and narrow-band spectrometer data to probe the IRB from 0.8 - 2.0 down to the narrow-band spectrometer’s zodiacal subtraction limit.
The authors wish to acknowledge the support of NASA grant NNG05WC18G.
References
- (1) S. Wyithe & A. Loeb, Ap. J. 588, L69 (2003).
- (2) A. Cooray & N. Yoshida, MNRAS 51, L71 (2004) [astro-ph/0404109]
- (3) P. Madau & J. Silk, MNRAS 359, 37 (2005).
- (4) M. G. Hauser & E. Dwek, ARAA 39, 249 (2001).
- (5) T. Totani et al., Ap. J. 550, L137 (2001).
- (6) E. L. Wright, Ap. J. 553, 538 (2001).
- (7) L. Cambresy et al., Ap. J. 555, 563 (2001).
- (8) J. Xu et al., Ap. J. 580, 653 (2002).
- (9) V. Gorjian, E. L. Wright & R. R. Chary, Ap. J. 536, 550 (2000).
- (10) E. Dwek & R. G. Arendt, Ap. J. 508, 9 (1998).
- (11) M. G. Hauser et al., Ap. J. 508, 25 (1998).
- (12) T. Matsumoto et al., Ap. J. 626, 31 (2005).
- (13) R. A. Bernstein, W. L. Freedman & B. F. Madore, Ap. J. 571, 56 (2002).
- (14) R. R. Dube, W. C. Wickes and D. T. Wilkinson, Ap. J. 232, 333 (1979).
- (15) G. N. Toller, Ap. J. 266, L79 (1983).
- (16) P. Madau & L. Pozzetti, MNRAS 312, L9 (2000) and references therein.
- (17) G. G. Fazio et al., Ap. J. Supp. 154, 39 (2004).
- (18) T. Kelsall et al., Ap. J. 508, 44 (1998).
- (19) E. L. Wright, MNRAS 29, 1354 (1997).
- (20) R. A. Bernstein, W. L. Freedman & B. F. Madore, Ap. J. 571, 85 (2002).
- (21) S. K. Ramsay, C. M. Mountain & T. R. Geballe, MNRAS 259, 751 (1992).
- (22) www.pegasus.phast.umass.edu/2mass/teaminfo/airglow.html
- (23) A. Cooray et al., Ap. J. 606, 611 (2004) [astro-ph/0308407]
- (24) A. Kashlinsky et al., Ap. J. 608, 1 (2004).
- (25) A. Kashlinsky et al., these proceedings (2005).
- (26) F. Aharonian et al., astro-ph 0508073 (2005).
- (27) A. Kashlinsky & S. Odenwald, Ap. J. 528, 74 (2000).
- (28) A. Kashlinsky et al., Ap. J. 579, 53 (2002).
- (29) P. Abraham, C. Leinert & D. Lemke, A. & A. 328, 702 (1997).
- (30) R. J. Reynolds, G. J. Madsen & S. H. Moseley, Ap. J. 612, 1206 (2004).
- (31) K. Mattila, Ap. J. 591, 119 (2003).