Swift and optical observations of GRB 050401
Abstract
We present the results of the analysis of -ray and X-ray data of GRB 050401 taken with the Swift satellite, together with a series of ground-based follow-up optical observations. The Swift X-ray light curve shows a clear break at about 4900 s after the GRB. The decay indices before and after the break are consistent with a scenario of continuous injection of radiation from the ‘central engine’ of the GRB to the fireball. Alternatively, this behaviour could result if ejecta are released with a range of Lorentz factors with the slower shells catching up the faster at the afterglow shock position. The two scenarios are observationally indistinguishable.
The GRB 050401 afterglow is quite bright in the X-ray band, but weak in the optical, with an optical to X-ray flux ratio similar to those of ‘dark bursts’. We detect a significant amount of absorption in the X-ray spectrum, with N cm-2 at a redshift of , which is typical of a dense circumburst medium. Such high column density implies an unrealistic optical extinction of 30 magnitudes if we adopt a Galactic extinction law, which would not be consistent with the optical detection of the afterglow. This suggests that the extinction law is different from the Galactic one.
keywords:
Gamma-Ray Bursts1 INTRODUCTION
Observations of Gamma-Ray Bursts (GRBs) have shown that they are followed by fading X-ray, optical and radio afterglows. These are thought to arise when the burst ejecta interact with the surrounding medium and produce a shock, which propagates in the medium and heats the electrons. The latter, cooling by synchrotron emission, produce the observed radiation. Studies of afterglows can provide invaluable information on the central engine of GRBs and on the circumburst medium, and can possibly distinguish different subclasses in the GRBs population.
Some authors (see e.g. Lazzati et al. 2002 and
references therein; Berger et al. 2005 and Lamb et al. 2005 for recent
results) have pointed out the existence of a subclass of GRB,
whose optical emission is at least magnitude
below that of the average of the optically detected bursts. Different
models have been proposed to explain these “dark bursts”, ranging
from a cosmological origin (Bromm & Loeb 2002; Fruchter 1999) to scenarios where
they go off in relatively dense and highly absorbed regions (Lazzati
et al. 2002). It is also possible that many dark bursts may be intrinsically
weak sources, the faint tail of the GRBs luminosity distribution
(De Pasquale et al. 2003), or sources with a very rapid decay
(Groot et al. 1998) in the optical band.
The afterglow emission is seen to decay over time. In some bursts, a clear light curve steepening is observed after an interval of order days. The break is achromatic and typically attributed to the fact that the energy release is collimated in a jet. Other irregular temporal features are sometimes seen in bursts (see Zhang & Meszaros 2002, Zhang et al. 2005, Burrows 2005 and references therein): examples include a rebrightening in GRB 970508, wiggles in GRB 020104 and step-like features in GRB 030329. Also, “bump” features have been observed in several cases (e.g. GRB 970228, GRB 970508, GRB 980326, GRB 000203C) and various interpretations have been proposed, e.g., “refreshed shocks” (Panaitescu et al. 1998), supernova components (Bloom et al. 1999, Reichart 1999, Galama et al. 2000), dust echoes (Esin & Blandford 2002) or microlensing (Garnavich et al. 2000). On the other hand, signatures in the GRB lightcurve detected at earlier times may provide diagnostic information about the nature of the injection and eventually probe whether the energy is released impulsively during the event or more continuously during the immediate post-burst epoch (see e.g. Zhang & Meszaros 2002).
Until recently, most follow-up observations did not start until a few hours after the GRB, when the afterglow had already faded significantly. This situation has changed with the launch of the Swift mission, which provides both a rapid alert of GRB triggers to ground-based observers, and rapid X-ray and optical/UV follow-up observations of the burst afterglow. The Swift observatory (Gehrels et al. 2005) carries three science instruments: the Burst Alert Telescope (BAT; Barthelmy et al. 2005), which locates GRBs with 3’ accuracy, the X-ray telescope (XRT, Burrows et al. 2005) and the Ultra-Violet Optical Telescope (UVOT, Roming et al. 2005a). When BAT detects a GRB trigger, Swift slews towards the source position within a few tens of seconds. Therefore, observations with the Swift instruments yield high quality data and cover the poorly investigated epoch occurring minutes after the burst. Interestingly, many GRBs localized and observed by Swift have shown no optical counterpart, even when optical observation started 100-200 s after the GRB onset. This provides evidence for a population of “intrinsically” dark GRBs (Roming et al. 2005b).
In this paper, we report the properties of the optically faint Swift GRB 050401, and discuss them in the light of the current models and scenarios of GRBs.
2 Analysis of the -ray and X-ray data.
GRB 050401 triggered the BAT instrument at 14:20:15 UT on April 1, 2005 (Barbier et al. 2005, Angelini et al. 2005). The refined BAT position is RA=, Dec= with a position uncertainty of 3’ (95% C.L., Sakamoto et al. 2005). The -ray band lightcurve started 9 s before the BAT trigger time and it shows 4 main peaks (see Figure 1). The peak count rate was 5000 counts/s (Barbier et al. 2005).
Analysis of the BAT data (15-350 keV energy band) yields a GRB duration t s.
We use the mask-weighted technique to subtract the background in the BAT for spectral analysis, which is only effective up to 150 keV. Swift began to slew towards the source about 25 sec after the trigger, while the prompt emission was still active. We created separated BAT spectra and response matrices for the pre-slew and slew phases, and we fitted them jointly (see figure 2) with a simple powerlaw model. No significant improvement in is found with a cutoff power-law model. Results are reported in the first entry of Table 1.111Throughout this paper, we report errors at 1, unless otherwise indicated.
The fluence detected by BAT in the keV range is erg cm-2. Assuming a redshift of (see later) and a spherically symmetric emission, this corresponds to a -energy release of erg between 15 and 150 keV in the cosmological rest frame of the burst (derived by means of the ’k-correction’ of Bloom et al. 2001). This result differs from that obtained by Chincarini et al. (2005), who reported an energy spectral index (using the 20-150 keV data) and a -energy release ( erg) in the 15-350 keV band. However, we note that GRB 050401 prompt emission was also detected by Konus-Wind (Golenetskii et al. 2005). The Konus data (see below) suggest a steepening of the spectral index above E 150 keV, which might explain the large difference between the two analyses.
As observed by the Konus-Wind instrument, GRB 050401 had a duration of s and a fluence of erg cm-2 in the 0.02-20 MeV band. Golenetskii et al. (2005) analyzed the spectrum gathered in the first 3 peaks (0-17 s after the trigger, first segment) and last peak (24.8-32 s after the trigger, second segment) separately (see again Table 1). We note that, if we adopt a cutoff powerlaw-model and fix the break energy keV (as inferred from the Konus data), the spectral index obtained by Swift, which is averaged over the whole gamma-ray emission phase, is consistent with that obtained by Konus.
Observations were not possible with the Swift UVOT telescope because of the presence of a 4th magnitude star in the field of view, while XRT started observations about 130 s after the trigger. An unknown bright X-ray source was detected at R.A. = , Dec = 02∘ 11’ 14”, within 42 arcseconds of the initial BAT position (Angelini et al. 2005); the coordinates were later confirmed by ground processing. This source subsequently faded, indicating that it was the X-ray counterpart of GRB 050401.
The first data were taken with the XRT (Hill et al. 2005) in its Imaging Mode (IM), then followed by a segment of data in the PhotoDiode mode (PD). After that, because of the bright star near the edge of the XRT field of view, the detector continuously switched between Windowed Timing (WT) and Photon Counting (PC) mode. The initial PC mode data were piled-up and we did not include them in the analysis. In the first day of observation, Swift observed the X-ray afterglow until 5.6 hours after the trigger. More follow-up observations were performed 4.43-6.38 and 6.48-12.33 days after the trigger. The total exposure time is about 48 ks, divided into 21 ks in WT mode and 27 ks of PC mode (including piled-up data).
Analysis of XRT data was performed using the XRT pipeline software. The accumulated DN in the IM data were converted to a count-rate following the method of Hill et al. 2005. The PD mode data points have been obtained by subtracting the contribution of the corner calibration sources. As for the WT mode data, the extraction regions for the source and for the background consist of boxes of 60x40 pixels. The source and background extraction regions for the PC data are circles of 20 pixel and 60 pixel radius, respectively. We considered the 0-2 grade events for the WT mode and 0-12 for the PC mode, which cover events up to 4 pixels in size. For the spectral analysis, we generated the physical ancillary response matrices with the task xrtmkarf, while the response matrices (RMs) were retrieved from the latest Swift calibration database, CALDB 20050601 (http://heasarc.gsfc.nasa.gov/docs/heasarc/caldb/swift/). At the time of writing, these RMs are considered as the most reliable, basing on comparison with spectra of calibration sources. We only considered data taken with CCD detector temperature T C.
We restricted both the spectral and temporal analysis to counts within the 0.4-10 keV band since, at the time of writing, a good calibration of both WT and PC data is available in this band. Data were rebinned in energy by requiring a minimum of 15 counts per bin.
The X-ray lightcurve is shown in Figure 3. The presence of a break is clearly evident: if we try to fit the whole lightcurve with a single powerlaw, we get an unsatisfactory result (), while the use of a broken powerlaw model ( for ; for ) gives a statistically significant improvement (. In this case, the best fit parameters are: decay indices and (before and after the break, respectively) and break time s222We note that at the time of the slope change Swift was not observing the GRB.. The break time is consistent with that reported by Chincarini et al. (2005), who report s corrected for cosmological time dilation, i.e. their break time has been divided by . We also tried to fit the lightcurve with a smoothly joined broken power law model (Beurmann et al. 1999), to determine the ”sharpness” of the X-ray lightcurve break. However, we found that data do not allow us to discriminate between a smooth and a sharp transition.
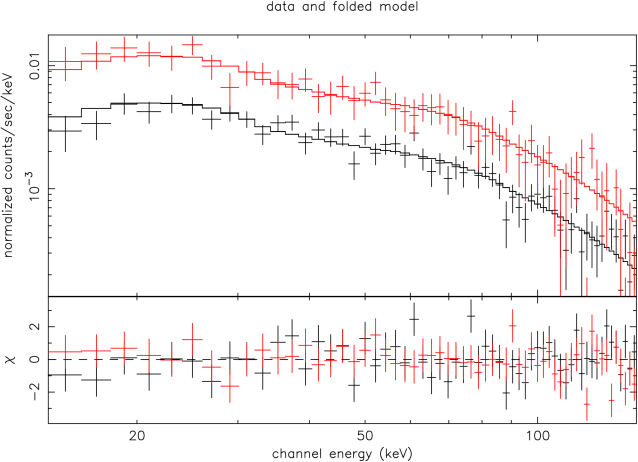
A fit of the WT spectral data taken before the lightcurve break time with an absorbed power-law model reveals a considerable amount of absorption, N cm-2, clearly in excess of the Galactic value reported by Dickey & Lockman (1990), cm-2, and the value inferred from the Galactic extinction map of Schlegel et al. (1998), N cm-2 (in this case the extinction, A has been converted to N using results by Predehl and & Schimtt 1995).
In order to better estimate the column density corresponding to the circumburst medium only, we repeated the fit by accounting separately for the Galactic and extragalactic absorption columns, the latter rescaled at . We fixed the Galactic absorption to the Dickey & Lockman (1990) value. This gives an extragalactic column density of N cm-2 (see Table 1; spectrum and best fit model are shown in Figure 4). To assess the robustness of this detection, we then repeated the fit without adding the extragalactic component, obtaining a . This means that accounting for the extra absorption NH produces a statistically significant improvement. The F-test has also been widely used to test the significance of a spectral component, although, when applied to parameters such as NH (which is bounded to be ) this may be inappropriate in a strict sense (see Protassov et al. 2002). For completeness, we report that we checked the F-test statistic, obtaining a value of 117 with a probability that the improvement is due to chance of .
We find no evidence for spectral evolution: parameters consistent with those given above are obtained when fitting the spectra taken before and after the s break. An analysis of the PC spectrum with the same spectral model also does not show any significant difference in the spectral parameters (see Table 1). When compared to the X-ray afterglows detected by other observatories, like BeppoSAX, Chandra and XMM-Newton, the afterglow of GRB 050401 appears to be a moderately bright source: the 1.6-10 keV X-ray flux normalized at 11 hours after the burst is erg cm-2s-1 (see Berger et al. 2003, Roming et al. 2005b, De Pasquale et al. 2005).
3 Follow-up observations in different energy bands
Although the Swift UVOT could not observe at the GRB position, a series of ground-based optical follow up observations was performed, triggered by the prompt Swift localization.
The afterglow was first identified by Rykoff et al. (2005), who detected it in images taken shortly after the GRB. Later, following the distribution of the BAT trigger, the BAT error circle was imaged with the 40-inch telescope at Siding Spring Observatory. These observations consisted of two unfiltered 120 s exposures, followed by 41 -band 240 s exposures. Data showed a faint fading source, at coordinates RA=16:31:28.81, Dec=+02:11:14.2 (J2000), i.e. within the XRT error circle. This object was not present on the Digitised Sky Survey plates (McNaught et al. 2005).
The rapid distribution of the afterglow position, along with a finding chart, enabled other follow-up observations including some spectroscopic ones. Fynbo et al. (2005) reported the detection of a system of absorption lines in the optical spectrum detected with FORS2 at the Very Large Telescope, indicating a redshift of . Other observations followed, up to days after the GRB onset. The full list is summarized in Table 2 and the optical light curve is shown in Figure 3. We found that the optical decay law is not consistent with a single powerlaw ( for 13 d.o.f.). We caution that the optical light curve has been obtained by observations performed by different facilities, which used diverse calibrations. In particular, the photometry of all exposures taken with the Siding Spring Observatory is relative to the first -band image, which was then calibrated to match the USNO-A2.0 catalogue red magnitude. Because of this, although the relative magnitudes are accurate, the overall normalization can only be considered to be accurate at the mag level. ARIES measurements also refer to USNO-A2.0 stars, while the Maidanak estimate is based on stars of the similar USNO-B2.0 catalogue, and D’Avanzo et al. 2005, and Greco et al. 2005 data used the Landolt catalogue. Therefore some systematic bias may well be present. However, taken at face value the combined data suggest a non-monotonic decaying behaviour. We note that the decay slope in the first 10000 s (first part of the Siding Spring data), is , consistent with the first X-ray decay. The Siding Spring data are not consistent with being constant. A powerlaw fit to these data in isolation gives . The case can be rejected at the 2.5 confidence level.
4 Discussion.
4.1 The break in the X-ray light curve.
As we have seen, the X-ray light curve of GRB 050401 registered with XRT shows an initial decay slope of , which steepens at s. After this time, the source fades with a slope of .
In principle, there are several physical mechanisms that can dictate the physical behavior of the afterglow during its initial decline and can produce a break at these early times. For instance, as described by Sari et al. (1999) and Rhoads et al. (1999), a break in the light curve is expected if the fireball outflow is not spherically symmetric but collimated within a jet. Such an effect has been invoked to explain breaks in Gamma-Ray Burst afterglow light curves in several cases (see, for example, Sari et al. 1999, Panaitescu & Kumar 2002, Frail et al. 2003). However, we suggest that this explanation is not applicable to the case at hand, for at least two reasons. First, according to the fireball model of GRB afterglows, the observed temporal decay index and spectral slope should be linked through the so-called closure relation (see e.g. Price et al. 2002). This relation depends on the kind of expansion (spherical or jet), on the density profile of the medium (uniform or wind) and on the cooling state of the electrons responsible for the synchrotron emission. In particular, for jet-like emission it should be or depending on whether the cooling frequency is above or below the X-ray frequency (see Sari et al. 1999). In the case at hand, we find (the spectral index is not supposed to change after the beginning of the jet expansion phase) and (decay index after the break), so none of the above closure relations is satisfied. Second, if interpreted within the jet break scenario the observed parameters are not compatible with the relation between the peak energy and the (collimation corrected) -ray energy release proposed by Ghirlanda et al. (2004). In fact, by using erg (as inferred from Konus data) and s we obtain a jet opening angle (see expression 1 in Ghirlanda et al. 2004). In turn, this corresponds to a collimation corrected energy erg and to a peak energy in the cosmological rest frame of keV, in clear disagreement with the value inferred by Konus data ( keV).
Another potential reason for a break in the light curve is that the energy release is spherically symmetric, but the X-ray observation occurs while passes through the X-ray band, causing the light curve to steepen by 0.25 (see Sari et al. 1999). However, in this case we should also observe a steepening of in the spectral slope while there is no evidence for that across the break of GRB 050401. Moreover, a change of 0.25 is not sufficient to account for the steepening in the light curve.
On the other hand, we find that both the initial shallow decay and the break can be explained by a model in which the central engine continues to inject radiative energy into the fireball for several thousands of seconds. This scenario has been investigated by Zhang & Meszaros (2001) and Zhang & Meszaros (2002). By assuming a source luminosity law of the kind , where is the intrinsic time of the central engine (or the observer’s time after the cosmological time dilation correction), these authors found that continuous injection of energy influences the fireball and the observed light curves as long as . In this case, the spectral and decay slopes are linked through the relation:
| (1) |
which holds if the observed X-ray frequency is between the synchrotron peak frequency and the cooling frequency (see later). By using the observed values of and , we obtain and before and after the break time, respectively. The latter is consistent with no injection (since does not influence the fireball dynamics), while before the time break the central engine injects energy with a luminosity law . The change in the decay slope occurs at the point when the central engine ceases to inject significant amounts of energy. We note that the decay slope of the optical and the X-ray flux before the breaks are consistent within the errors. This is in agreement with the continuous injection model, as long as the optical and the X-ray band belong to the same spectral segment.
There is variant to this scenario, which is observationally undistinguishable, i.e. a model in which the central engine activity is as brief as the prompt emission itself but, at the end of the prompt phase, the ejecta are released with different velocities (Lorentz factors, see Panaitescu et al. 2005). The fastest shells initiate the forward shock, decelerate, and are successively caught by the slowest shells. The consequent addition of energy in the blast-wave mitigates the deceleration and the afterglow decay rate. Assuming that the mass of the ejecta follows the law
| (2) |
where is the Lorentz factor, one can find an effective value that mimics the effect of non vanishing index in the luminosity law. By following Zhang et al. (2005), this is:
| (3) |
therefore, the value inferred above is equivalent to an -index of . This explanation has been proposed, for example, to explain the initial mild decline of the optical light curve of GRB 010222, which shows a decay slope of (Stanek et al. 2001, Bjornsson et al. 2002) for hours after the trigger, followed by a break and a steeper decay. Bjornsson et al. (2004) also proposed that injection of energy by slow shells could explain the wiggles in the light curve of GRB 021004.
In the case of GRB 050401, it is noteworthy that a possible optical rebrightening seems to take place shortly after the change of the slope of the X-ray. In the framework of the continuous energy injection model, this could be explained by the onset of a ”reverse shock”. The basic idea is that, after the end of the injection phase, a reverse shock wave crosses the whole ejecta, heating them and causing a peak in the emission. After that, the shocked ejecta start to cool adiabatically once again. However, in order to assess this issue a more detailed model investigation is required, which is beyond the scope of this work.
As previously discussed, the analysis of the X-ray data taken after the break is consistent with a scenario in which a ”standard” fireball expands in a constant density medium, provided that the observed X-ray band lies between the synchrotron peak frequency and the cooling frequency. Following Sari et al. (1999), the closure relation should in this case read , which is satisfied within . One possible complication is that, if the fireball expands in a medium with constant density, the cooling frequency is expected to decrease with time according to . Accordingly, in most X-ray afterglows, the cooling frequency is already between the peak frequency and the X-ray observing frequency less than 1-2 days after the GRB onset. In contrast, our data seems to suggest that in the case of GRB 050401 the cooling frequency remains above the X-ray frequency for about s. While this may be explained in terms of relatively low values of magnetic field energy () and density (see Sari et al. 1999), we also note that a transit of the cooling frequency through the X-ray band after 20,000 s cannot be completely excluded by our data: the change in the decay slope and in the spectral slope would be 0.25 and 0.5 respectively, and hence difficult to detect due to very low statistics in the late time XRT detections of the afterglow.
4.2 The optical and X-ray properties of GRB 050401.
The GRB 050401 afterglow is quite bright in the X-ray band, but weak in
the optical, with an optical to X-ray flux ratio similar to those of
’dark bursts’.
In order to compare its properties with those typically observed in
other GRBs, we show in figure 5 the relation between the
optical and X-ray fluxes for a series of GRB afterglows detected by
BeppoSAX. As pointed out by several authors (e.g.
De Pasquale et al. 2003, Roming et al. 2005b), the GRBs with optical
counterparts exhibit a correlation between the fluxes in these two
spectral bands. Several GRBs without optical counterparts also show
an X-ray emission consistent with that expected by assuming the
validity of the same correlation, indicating that they may well be
simply the faint tail of the same population. However, there is
evidence for a sample of dark GRBs which have ”normal” X-ray fluxes
but with tight upper limits in the optical. Jakobbson et al. (2004)
reached similar conclusions by comparing the spectral index between
the optical and the X-ray band, , with the expectations
of the fireball model, which requires . They
found that at least 10 % of the events in their sample had
, and called them the truly dark GRBs.
To explain the optical faintness of these bursts, two main scenarios
have been proposed. The first idea is that they occur at very high
redshift, possibly following the death of Population II and III
stars (Bromm & Loeb 2002), in which case the optical flux is washed out
by the intervening Ly- forest. The second idea is that dark
GRBs have lines of sight passing through large and giant molecular
clouds (hereafter GMCs). GMCs are rich in dust, which extinguishes
optical and UV light very efficiently.
GRB 050401 appears to be an ’intermediate’ case. An optical afterglow
is detected, but is very faint relative to its X-ray flux compared to other
GRBs with optical counterparts. Its optical to X-ray spectral index
is , which makes this source a dark burst
according to Jakobsson et al. (2004) classification.
Given the detection of an optical counterpart with a likely redshift
of , we can exclude the hypothesis of a very high redshift.
On the contrary, the X-ray spectrum indicates a high absorption,
typical of GMCs (Reichart & Price 2002, Galama & Wijers 2001).
Therefore, a natural question is: can the hypothesis of extinction
in this medium explain the weakness of the optical emission
detected? The light detected at Earth in the R band (centered at 700
nm) was emitted at a wavelength of 180 nm in the GRB cosmological
restframe at a redshift of . The simplest working hypothesis
is to assume that the same medium is responsible for both the X-ray
and optical extinction. In this case, the hydrogen column density
measured from the X-ray spectrum (N cm-2) would correspond to an absorption in the V band
of magnitudes (Zombeck 1990). Assuming a Galactic
extinction curve of , this
results in a predicted extinction of magnitude
for nm. This value is unreasonably high and would
imply that the optical afterglow was unrealistically
bright. Thus we can exclude this simple explanation.
Instead, comparing with the optical-to-X-ray flux ratio typical of other ’non-dark’ GRBs (De Pasquale et al. 2003, Jakobsson et al. 2004, Roming et al. 2005b) we could expect a plausible extinction of about 3 magnitudes, which is clearly not in agreement with the measured X-ray absorption when we adopt the Galactic extinction curve. We note that a discrepancy like this has been noted in several other cases (for a summary, see Stratta et al. 2004), but for GRB 050401 we have the advantage of a fairly constrained value of the absorption parameter.
In order to reconcile the value of absorption with the likely
extinction, a few hypothesis have been proposed. The first scenario
involves the presence of a gas-to-dust ratio much lower than the
Galactic one and/or a dust grain size distribution skewed toward
large grains (Stratta et al. 2004).
This first case is, for instance, typical of dwarf galaxies like the
Small Magellanic Cloud (SMC). In fact, for the SMC interstellar
medium (ISM) a dust content of the Galactic one has been
inferred (Pei et al. 1992). Thus, we would have magnitudes
of extinction based on the measured value of the X-ray absorption.
This value is close to that required. We note, however, that the
best-fit value has been obtained by assuming Galactic metal
abundances, while the metallicity of SMC is of the Milky Way
(Pei et al. 1992). If this low metallicity were adopted, we would
need to adjust the value of upwards by a factor of ,
given that the majority of the absorption in the X-ray band is
produced by heavy elements, so this is not a solution.
Another scenario that could result in a low is that
there is a change in both the gas-to-dust ratio and the distribution
of grain size, with the latter enriched in large grains by the
effects of the high-energy radiation of the GRBs. Dust grains can be
heated and evaporated by the intense X-ray and UV radiation fields
up to parsecs from the GRB (Waxman & Draine 2000, Draine & Hao 2002,
Fruchter et al. 2001). Perna et al. (2003) and Perna & Lazzati (2002) show that the consequence
of exposing dust to intense
radiation fields can be a grain size distribution flatter than the
original one. The main reason is that dust destruction is more
efficient on small grains. Perna et al. (2003) computed the
extinction curve that is obtained if standard Galactic dust is
exposed to a GRB and found that the extinction curve can be very
flat, at least for bursts lasting more than a few tens of seconds.
Finally, a distribution of grain size skewed toward large grains can also be produced by an efficient mechanism of coagulation of smaller grains in a dense environment (Kim & Martin 1996, Maiolino et al. 2001), in which case the dust-to-gas ratio is unaffected. Both of the above explanations could lessen the discrepancy between the low UV extinction and the high X-ray absorption detected.
5 Conclusions.
We have presented Swift observation of the Gamma-Ray Burst
050401 and we have discussed the properties of the prompt emission,
and, in more detail, the X-ray afterglow. The light curve of this
burst shows a break 4900 s after the trigger, changing from a decay
index of to , while the
spectral energy index does not change. To explain this behavior, we
have proposed that the ’central engine’ has been active until the
time of the break, with luminosity described by the law . Another possibility is that the central engine activity
turned off as the prompt emission ended, but the shells had a broad
distribution of Lorentz factors. In this case, the slowing front of
the GRB blastwave is continually re-energized by the arrival of
progressively slower shells and the flux decay is therefore
mitigated. We find that the decay slope observed before the break
may be reproduced if the shells were emitted with a powerlaw
distribution of Lorentz factor, .
The
peculiar behaviour of the optical light curve can be in agreement
with the two scenarios proposed.
After the break time, the profiles of the X-ray light curve and
spectrum are consistent with those expected when a fireball expands
in a circumburst medium with constant density, and the observed
X-ray band lies between the
synchrotron peak frequency and the cooling frequency.
Even though the X-ray flux of the GRB 050401 afterglow is high, the
optical counterpart is faint. This leads to a low optical to X-ray
flux ratio similar to that of dark GRBs which are likely to be
obscured by some mechanism. The spectral analysis shows clear
evidence of absorption, namely N cm-2, at the redshift of the GRB. This value
is typical of giant molecular clouds where star forming regions are
located. The detection of a dense circumburst medium could lead us
to the conclusion that this ”obscuration mechanism” is, at least in
this case, extinction.
However, the amount of extinction extrapolated by assuming the
Galactic extinction law is far too high to be physically acceptable.
This may be evidence that the circumburst medium is characterized by
a dust grain size distribution different from the Galactic one, and
skewed towards large grains. This could be due either to coagulation
of smaller grains or to small dust grain destruction due to high
energy photons produced by the GRB. In the latter case the
dust-to-gas ratio would also be different from the Galactic one.
Acknowledgements: We are grateful to an anonymous referee for his/her suggestions that led to a substantial improvement of the draft. APB, KPA acknowledge support for this work at Leicester by PPARC. SZ also thanks PPARC for support through an Advanced Fellowships.
References
- Angelini et al. (2005) Angelini L. et al., 2005, GCN 3161
- Barbier et al. (2005) Barbier et al., 2005, GCN 3162
- Barthelmy et al. (2005) Barthelmy S.D. et al., 2005, Sp. Science Rev, in press
- Beurmann et al. (1999) Beuermann K. et al. 1999, A&A, 352, L26
- Berger et al. (2003) Berger E. et al., 2003, ApJ, 590, 379.
- Berger et al. (2005) Berger E. et al., 2005, ApJsubmitted, (astro-ph/0505107)
- Bjornsson et al. (2002) Bjornsson G., Hjorth J., Pedersen K. et al., 2002, ApJ, 579L, 62.
- Bjornsson et al. (2004) Bjornsson G., Gudmundsson E.H. & Johannesson G., 2004, ApJL, 615, 77.
- Bloom et al. (1999) Bloom J.S. et al., 1999, Nature, 401, 453
- Bloom et al. (2001) Bloom J.S, Frail D.A., Kulkarni S.R. et al., 2001, ApJ, 508, L21
- Bromm & Loeb (2002) Bromm V. & Loeb A., 2002, ApJ, 575, 111
- Burrows et al. (2005) Burrows D. et al., 2005, Space Science Review, in press
- Chincarini et al. (2005) Chincarini et al. 2005, submitted to ApJ, astro-ph/0506453
- D’Avanzo et al. 2005 (2005) D’Avanzo P. et al., GCN 3171
- De Pasquale et al. (2003) De Pasquale M., Piro L., Perna R. et al. 2003, ApJ, 592, 1018
- Dickey & Lockman (1990) Dickey J.M. & Lockman F.J., 1990, ARAA, 28, 215
- Draine & Hao (2002) Draine B.T. & Hao L., 2002, ApJ, 569, 780
- Esin & Blandford (2002) Esin, A.A. & Blandford, R., 2000, ApJL, 534, L51
- Frail et al. (2003) Frail D. 2003, IAU Colloquium 192, Supernovae: 10 Years of 1993J Valencia, astro-ph/0309557
- Frontera et al. (2000) Frontera F. et al., 2000, ApJ, 127 59
- Fruchter et al. (2001) Fruchter A.S. et al., 2001, ApJ, 563 597
- Fynbo et al. (2005) Fynbo J. et al., 2005, GCN 3176
- Fruchter (1999) Fruchter A.S., 1999, ApJ, 512L 1
- Galama et al. (2000) Galama, T.J., et al., 2000, ApJ, 536, 185
- Galama & Wijers (2001) Galama, T.J. & Wijers, R.A.M.J. 2001, ApJL, 549, L209
- Garnavich et al. (2000) Garnavich, P., Loeb, A. & Stanek, K., 2000, ApJL, 544, 11
- Gehrels et al. (2005) Gehrels N. et al., 2005, ApJ, 621, 558
- Ghirlanda et al. (2004) Ghirlanda G., Ghisellini G. & Lazzati D., 2004, 616, 331.
- Golenetskii et al. (2005) Golenetskii S. et al., 2005, GCN 3179
- Greco et al. (2005) Greco G. et al., 2005, GCN 3319
- Groot et al. (1998) Groot P.J, Galama T.J., Vreeswijk P.M. et al. 1998, ApJ, 502L 123
- Hill et al. (2005) Hill J.E. et al., 2005, in preparation
- Jakobsson et al. (2004) Jakobsson P. et al., 2004, ApJL, 617, L21
- Kim & Martin (1996) Kim S.H. & Martin P.G., 1996, ApJ, 462, 296
- Lamb et al. (2005) Lamb, D.Q. et al., 2005, New Astronomy Reviews, 48, 423
- Lazzati et al. (2002) Lazzati D. et al. 2002, MNRAS
- Maiolino et al. (2001) Maiolino R. et al., 2001, A&A, 365, 37
- Misra et al. (2005) Misra K. et al. 2005, GCN 3175
- McNaught et al. (2005) McNaught R. et al., 2005, GCN 3163
- Panaitescu et al. (1998) Panaitescu A., Mészáros, P. & Rees, M.J., 1998, ApJ, 503, 314
- Panaitescu & Kumar (2002) Panaitescu A. & Kumar P., 2002, ApJ, 779, 789
- Panaitescu et al. (2005) Panaitescu A. et al., 2005, MNRAS submitted, astro-ph/0508340
- Pei et al. (1992) Pei Y.C. et al., 1992, ApJ, 395, 130
- Perna & Lazzati (2002) Perna R. & Lazzati D., 2002, ApJ, 580, 261
- Perna et al. (2003) Perna R. et al., 2003, ApJ, 585, 775
- Predehl & Schmitt (1995) Predehl P. & Schmitt J.H.M.M., 1995, A&A, 293, 889
- Price et al. (2002) Price P. et al., 2002, ApJL, 572, L51
- Price et al. (2005) Price P. et al., 2005, GCN 3164
- Protassov et al. (2002) Protassov R., van Dyk D.A., Connors A. et al. 2002, ApJ, 571, 545
- Reichart (1999) Reichart E., 1999, ApJL, 521, L111
- Reichart & Price (2002) Reichart E. & Price P., 2002, ApJ, 565, 174
- Rhoads et al. (1999) Rhoads J. et al., 1999, ApJ, 525, 737
- Roming et al. (2005a) Roming P. et al., 2005a, Space Science Review, in press
- Roming et al. (2005b) Roming P. et al., 2005b, to be submitted to Science, astro/ph0509273
- Rykoff et al. (2005) Rykoff E. S. et al., 2005, accepted by ApJL, astro-ph/0508495
- Sari et al. (1999) Sari R. et al., 1999, ApJL, 519, 17
- Sakamoto et al. (2005) Sakamoto T., 2005, private communication.
- Schlegel et al. (1998) Schlegel D.J., Finkbeiner D.P & Davis M, 1998, ApJ, 500, 525S
- Soderberg et al. (2005) Soderberg A.M. et al., 2005, GCN 3187
- Stratta et al. (2004) Stratta G. et al., 2004, ApJ, 608, 846
- Stanek et al. (2001) Stanek K., Garnavich P.M, Saurabh J., et al., 2001, ApJ, 563, 592.
- Waxman & Draine (2000) Waxman E. & Draine B.T., 2000, ApJ, 537, 796
- Zahharov et al. (2005) Zahharov. et al., 2005, GCN 3174
- Zhang et al. (2005) Zhang B., Fan Y.Z., Dyks J. et al., 2005, submitted to ApJ, astro-ph/0508321
- Zhang & Meszaros (2001) Zhang B. & Meszaros P., 2001, ApJ, 552L, 35
- Zhang & Meszaros (2002) Zhang B. & Meszaros P., 2002, ApJ, 566, 712
- Zombeck (1990) Zombeck M., 1990, Handbook of Astrophysics, Ed. Cambridge University Press
| Instrument | Section | NH | ||||
| Swift: | ||||||
| BAT Prompt Emission | 136/115 | |||||
| WT pre-break | 280/261 | |||||
| WT post-break | 16.3/21 | |||||
| PC | 21.8/18 | |||||
| Konus-Wind: | ||||||
| first segment | ||||||
| second segment |
| Time after GRB (days) | R magnitude | Reference |
|---|---|---|
| 0.040 | Siding Spring Observatory | |
| 0.043 | ” | |
| 0.051 | ” | |
| 0.055 | ” | |
| 0.063 | ” | |
| 0.071 | ” | |
| 0.086 | ” | |
| 0.102 | ” | |
| 0.126 | ” | |
| 0.149 | ” | |
| 0.173 | ” | |
| 0.24 | Misra et al. 2005 (GCN 3175) | |
| 0.39 | Kahharov et al. 2005 (GCN 3174) | |
| 0.46 | Greco et al. 2005 (GCN 3319) | |
| 0.47 | D’Avanzo et al. 2005 (GCN 3171) |