THERMAL SiO AND H13CO+ LINE OBSERVATIONS OF THE DENSE MOLECULAR CLOUD G0.110.11 IN THE GALACTIC CENTER REGION ††thanks: This work was carried out under the common-use observation program at Nobeyama Radio Observatory (NRO).
Abstract
We obtained the first view in H13CO+ and a high-resolution map in thermal SiO lines of G0.110.11, which is a molecular cloud situated between the Galactic Center radio arc and Sgr A. From a comparison with previous line observations, we found that the H13CO+ line is optically thin, whereas the thermal SiO lines are optically thick. The line intensity in H13CO+ shows that the cloud has a large column density, up to , which corresponds to about 640–740 mag in or 10–12 mag in . The estimated column density is the largest known of any even in the Galactic center region. We conclude from the intensity ratio of SiO to CS that emitting gas is highly inhomogeneous for SiO abundance on a scale smaller than the beam width 35″.
1 INTRODUCTION
Recent infrared observations have revealed the existence of a population of dense bright-star clusters in the Galactic center region (e.g., Figer et al. (2002)), such as the Arches cluster or the Quintuplet cluster. Although these clusters must be made from molecular clouds in the Galactic center region, it remains unclear what modifies the star formation process to form such extremely massive stars. Further detailed observations of dense molecular clouds in the Galactic center region may provide a key to understanding the physical properties of the clouds and their relationship to this star-forming mechanism.
Large-scale surveys in molecular lines have revealed that molecular clouds in the central 100 pc of the Galaxy are different from those in the Galactic disk. For example, the incidence of relatively dense clouds is higher in the Galactic center region. The Nobeyama Radio Observatory (NRO) CS survey has shown that density of most molecular clouds there is over (Tsuboi et al., 1999). Moreover, the multiline observations show that even the CO-emitting region (or outer envelope) of a typical Galactic center molecular cloud is under high pressure at (Oka et al., 1998; Sawada et al., 2001).
Among dense molecular clouds in the Galactic center region, the molecular cloud G0.110.11111 The cloud is referred to as Tsuboi’s shell in the NRO 45-m CO survey (Oka et al., 2001), as G0.110.11 in Reich (2003), and as the TUH shell in Yusef-Zadeh et al. (2002). is unique and one of the most interesting objects. It is located between Sgr A and the Galactic center arc (GCA). The NRO CS survey (Tsuboi et al., 1999) shows that G0.110.11 is well separated in -- space from the main ridge of the CS emission, which is the central disk of molecular gas in the Galactic center. The CS observations reveal that G0.110.11 has a large molecular mass and large velocity width at the eastern222 In this paper, all directions on the sky are in terms of Galactic coordinates. and western edges of the cloud. The eastern edge appears to have an interaction with the GCA (Tsuboi et al., 1997). G0.110.11 is bright at the X-ray fluorescent iron line (Yusef-Zadeh et al., 2002), which suggests that dense gas in the cloud reflects X-rays from an intense source.
The morphologies of G0.110.11 in CS and CO lines are similar. These lines are presumably optically thick at the surface of the cloud. To obtain the physical properties of the cloud, observations in an optically thin line are required. The H13CO+ () line should be suitable because of its very low abundance. Here we present the first view in an H13CO+ line of G0.110.11, exploring the molecular gas distribution in the cloud. At the same time, we present a high-resolution view in thermal SiO lines. The thermal SiO lines are thought to be a good tracer of hot and shocked regions because this molecule is in gas phase only under high-temperature environment (Ziurys et al., 1989). For example, thermal SiO emission is detected in bipolar flow sources and in shocked shells of supernova remnants. Martín-Pintado et al. (1997) surveyed the Galactic center region in the thermal SiO line. However, they observed only half the extent of G0.110.11, and with poor angular resolution. We have now made observations of G0.110.11 in these lines using the Nobeyama 45 m telescope with much higher resolution.
2 OBSERVATIONS
We have observed G0.110.11 in April 2002, using the Nobeyama 45 m telescope, simultaneously observing at the spectral lines of H13CO+ (86.754330 GHz), SiO (43.423798 GHz), and SiO (86.846998 GHz). The FWHM beam sizes at 43 and 86 GHz are 35″ and 18″, respectively. The receiver front ends were SIS receivers at 43 and 86 GHz with a polarization splitter. The observed region is a rectangular area of , and , which covers the whole cloud. The spacing of the observation grid is 20″, which corresponds to 0.82 pc at the distance to the Galactic center, 8.5 kpc. The main-beam efficiencies at 43 and 86 GHz are 0.81 and 0.50, respectively. Two SiO maser sources, OH 2.60.4 and VX Sgr, were observed every hour in order to check the telescope pointing. Typical pointing accuracy was 5″ during this observation.
We used acousto-optic spectrometers with 250 MHz bandwidth, of which the respective velocity resolutions at 43 and 86 GHz are 0.87 and 0.44 , respectively. The line intensities were calibrated by the chopper wheel method (Kutner & Ulich, 1981) in order to correct the antenna temperature for atmospheric attenuation, . The system temperatures during this observation were 300 K at 43 GHz and 500 K at 86 GHz. Linear or parabolic baselines were applied to all the spectra.
3 RESULTS
3.1 Features and Morphology of the Cloud
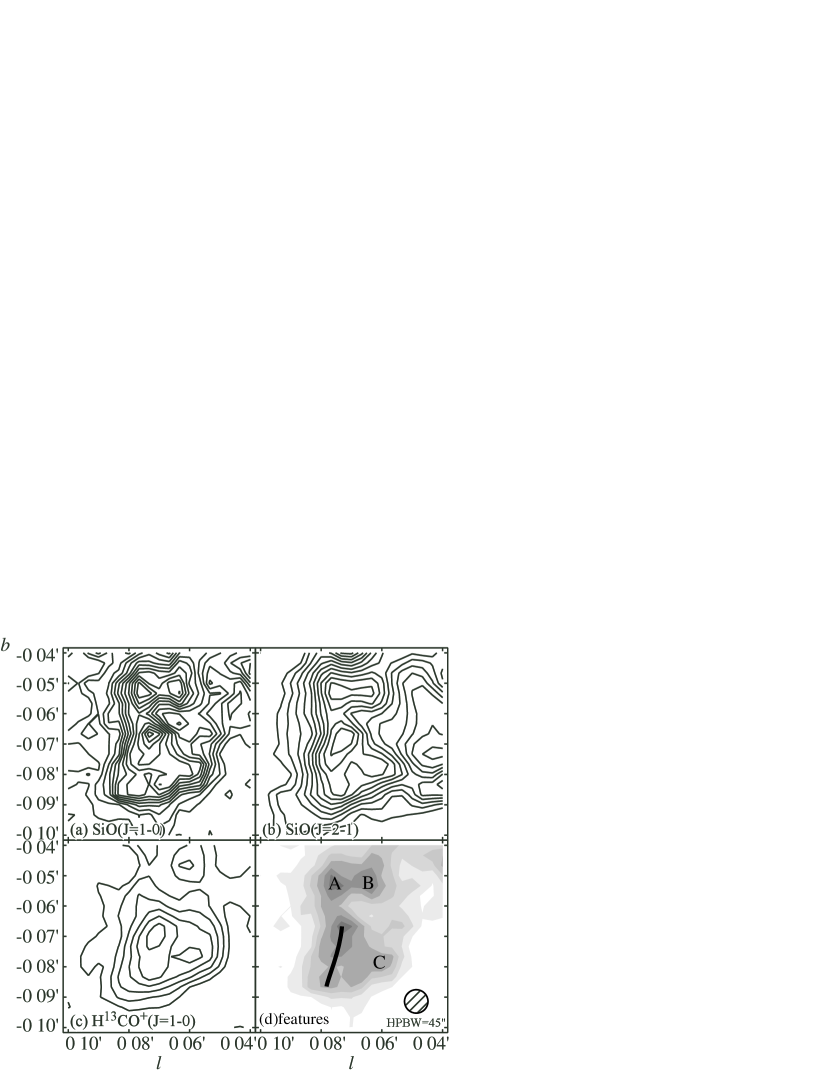
Figure 1 shows the integrated intensity maps in the three lines in the velocity range of . The spatial resolutions are adjusted to 45″ by applying Gaussian convolution. A shell-like molecular cloud is seen in all the three lines. The appearance in the SiO lines resembles that in the CS line (see Fig. 1 of Tsuboi et al. 1997).
However, several differences are apparent in the images in the H13CO+ and SiO lines. The H13CO+ intensity is significantly concentrated to the southern half of the cloud, although the cloud seems to extend beyond in SiO and CS images. In the H13CO+ line, the integrated intensity in is 80 % of the total intensity of the whole cloud, which is integrated over , . These discrepancies are presumably due to the difference in optical depths between the SiO and H13CO+ lines (see detail in § 4.1). Namely, the H13CO+ line intensity traces the column density, but the SiO lines do not. Thus, G0.110.11 shows significant difference in column density below and above a front at .
G0.110.11 shows four distinctive features in these lines. Along the eastern edge of the cloud, a prominent ridge is seen in all the three lines. We dub it the E ridge hereafter (Fig. 1, solid line). At , it extends from to perpendicular to the Galactic plane. On the northern end of the E ridge, a peak is seen in both the SiO lines at (hereafter peak A). At , another peak (peak B) is seen in the SiO lines. The other prominent feature is a peak at (peak C). Figure 1 illustrates these features.
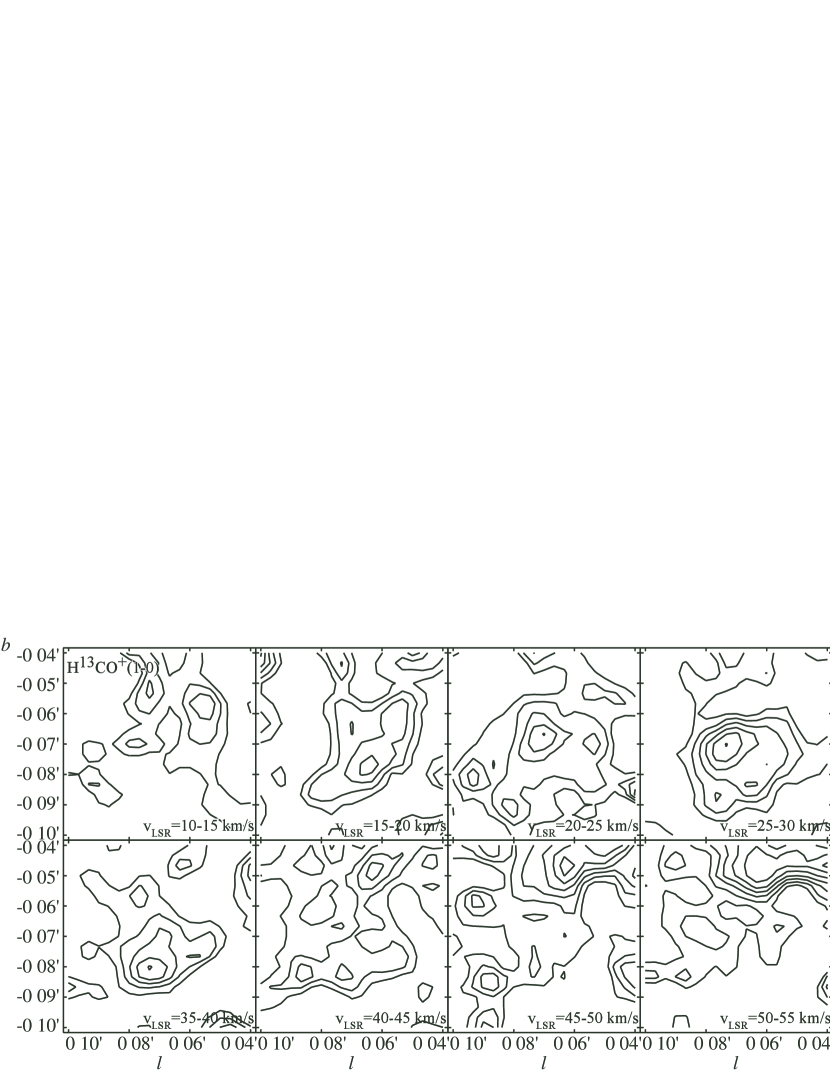
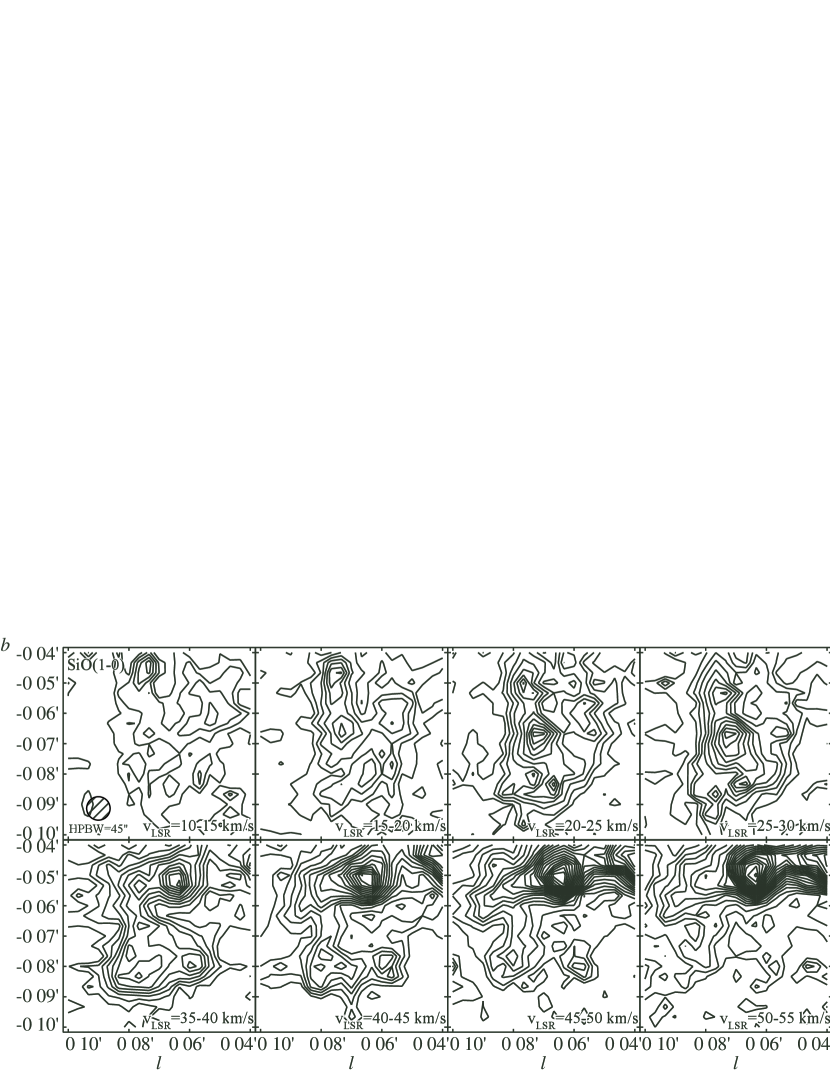
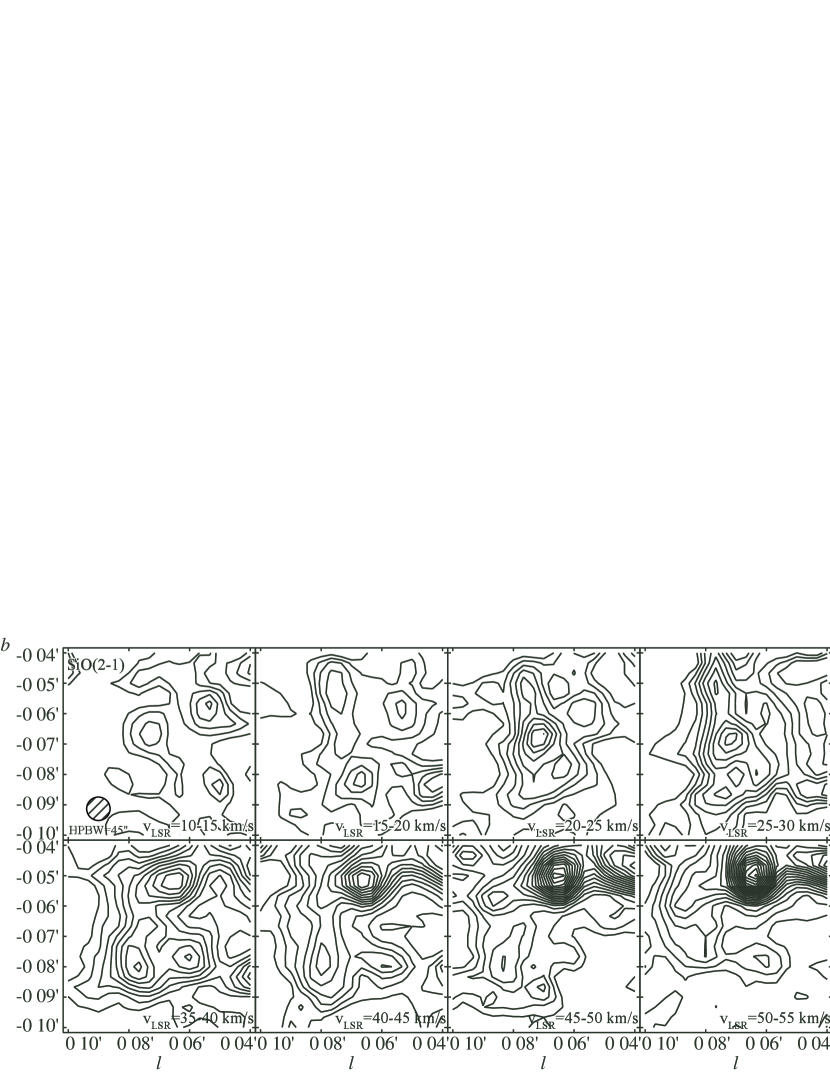
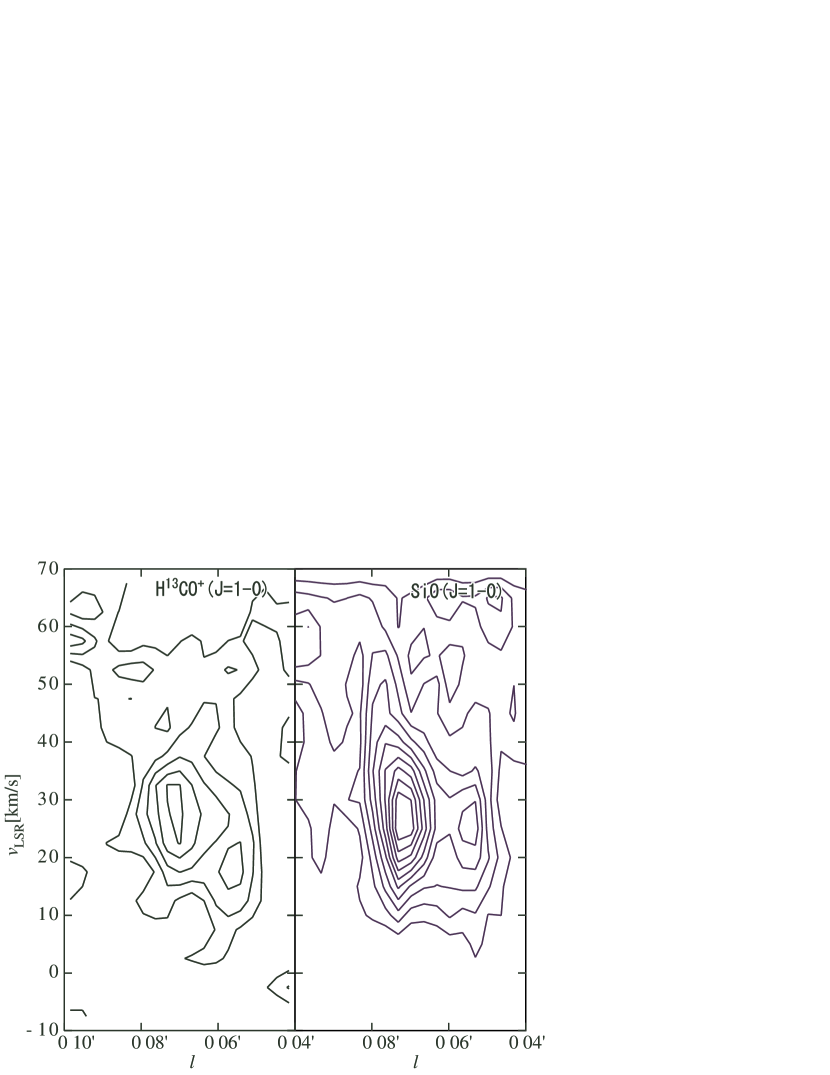
Figures 2, 3, and 4 show the channel maps of the H13CO+ line and the two SiO lines with a velocity interval of 5 . The FWHM in these figures is increased to be 45″ by Gaussian smoothing. Typical rms noise levels in for H13CO+ , SiO , and lines are 0.042 K, 0.050 K, and 0.042 K, respectively.
The E ridge is seen in the SiO channel maps between . The E ridge extends for 3′ in Galactic latitude, equivalent to 7 pc at a distance of 8.5 kpc. A corresponding feature is also seen in the CS line (Fig. 2 in Tsuboi et al. 1997). The E ridge is extended in the direction parallel to the GCA. This morphology may suggest an interaction of the molecular gas with the GCA. However, this interaction is probably not very strong, if it exists, because the E ridge is not the most prominent feature in the SiO image.
In the H13CO+ map the E ridge is also distinguishable, but less prominent than in the SiO lines, and very weak in . The velocity structures of the E ridge in the SiO and H13CO+ lines are similar at . The SiO emission is extended beyond , but the H13CO+ emission is not. We note that this extension of the E ridge in the SiO emission connects at to the ridge extending at , which goes through peak B (see Fig. 5).
Peak A is seen in the SiO maps between . At the high-redshift end, peak A is merged into the ridge along the Galactic plane through peak B. In the SiO line images, peak A appears to be somehow connected with the E ridge. However, the H13CO+ line image shows no feature corresponding to peak A or B (), whereas it seems to show the E ridge. Hence, peak A is unlikely to be a part of the E ridge.
Peak B is seen in the SiO maps at . Beyond the position of peak B is shifted northward by 20″. In the H13CO+ map a clear counterpart is seen only beyond . This suggests that peak B may be a double source and separable at . In any case, peak B with is only seen in the SiO lines.
Peak C is seen in the range . The H13CO+ map shows its counterpart clearly. Peak C is morphologically connected to the E ridge in space. The E ridge and peak C might be two main parts of G0.110.11.
Another prominent ridge with at parallel to the Galactic plane is seen in all the observed lines. The large-scale velocity structure observed in CS (Tsuboi et al., 1999) suggests that this ridge is a blueshifted wing of the main ridge of the Galaxy through the whole Galactic center region. Therefore, we do not discuss this feature in this paper.
3.2 Intensity Ratio
To evaluate the morphological resemblance among the SiO lines and difference between the H13CO+ and SiO lines quantitatively, we estimate intensity ratios of observed lines, which are keys to determine the optical depth and/or physical conditions of the emitting gas in G0.110.11. First, we estimate an intensity ratio of two SiO lines, . To calculate an average value, we use an intensity correlation for all the observed points in a box assigned in space for each feature. To remove the difference in resolution due to different beam size at the three lines, we reduce the resolution to be 45″ by appropriate Gaussian convolution. We found the ratios of the SiO line to the SiO line to be 0.9–1.0 for the E ridge and the three peaks and also found no significant difference in the ratios among the regions in the cloud.
We also estimated the line intensity ratios of H13CO+ to SiO and found them to be uniform in each feature, although they differ significantly between the northern and southern parts of G0.110.11. For the E ridge and peak C, they are 0.5. For peaks A and B, they are about 0.2 or smaller, although the signal-to-noise ratio is poor.
4 DISCUSSION
4.1 Column Density and Mass of the Cloud
The H13CO+ line is expected to be optically thin, because of its small abundance. We can check it by comparing the H13CO+ intensity with the CS intensity. We should note that since the excitation parameters of both the lines are similar, their intensity ratio ought not to be a strong function of the physical conditions of the gas; accordingly, the only causes of variation in this ratio must be variations either in the relative abundances of the species or in their relative optical depth. Using an H13CO+ abundance of and a CS abundance of (García-Burillo et al., 2000; Irvine et al., 1987) together with excitation parameters of the lines, the expected intensity ratio of H13CO+ to CS is about , if both lines are optically thin. Using CS observations by Tsuboi et al. (1997), the line intensity ratio of H13CO+ to CS is calculated to be 0.12–0.14 in the southern part of G0.110.11. It follows that the CS line in this locality must be optically thick, whereas the optical depth of H13CO+ is about 0.1. In the northern part of the cloud, the ratio is about 0.05 or smaller and the H13CO+ line is therefore optically thin.
Then we estimate the column density of the southern part of G0.110.11 and the molecular mass of the whole cloud from H13CO+ intensity under the condition of local thermal equilibrium (LTE). In this case, we need to know the kinetic temperature () of the emitting gas. The kinetic temperature of molecular gas in the Galactic center region is controversial. In the Galactic center region, of dense molecular clouds is estimated to be 60–80 K or hotter (Morris et al., 1983; Hüttemeister et al., 1993; Lis et al., 2001). Here we assume . Thus, the column density of molecular hydrogen at the E ridge is derived to be . This corresponds to about 640–740 mag in (visual extinction) at the typical gas-to-dust ratio expected for dense clouds, and about 80–90 mag and 10–12 mag in and (extinction at ), respectively (Mathis, 2000). Similar values are obtained for peak C. This large is consistent with the fact that G0.110.11 is observed as a shadow in an infrared map with the Midcourse Space Experiment (MSX; Egan et al. 1998). The shadow has a spatial extension on the sky similar to that in .
In submillimeter continuum map we can find the counterpart of G0.110.11, although it is less prominent than major submillimeter features (Pierce-Price et al., 2000). Using the same conversion from gas column density to submillimeter brightness as Pierce-Price et al. (2000), corresponds to 20 Jy beam-1 at 450 m with 8″ beam and 8 Jy beam-1 at 850 m with 15″ beam. The maps with SCUBA (Submillimeter Common-User Bolometric Array; Pierce-Price et al. 2000) show about 15–20 Jy beam-1 at 450 m and 3–4 Jy beam-1 at 850 m. The estimated values are consistent because both estimations are based on assumptions with some uncertainty. The gas-to-dust mass ratio may be reduced in the cloud because strong thermal SiO line of the cloud suggests dust evaporation. The molecular abundance of H13CO+ may be smaller than the value we assumed. Moreover, inhomogeneity in the cloud may affect the conversion factors from the observable values to the true mass of the cloud.
The estimated column density of G0.110.11 is one of the largest ever observed even in the Galactic center region. For several X-ray sources in the Galactic center region, total hydrogen column densities were estimated to be (Sakano et al., 1999; Sakano, 2000). The cloud G0.110.11 shows a column density larger by at least factor of 5 than the ordinary environments in the Galactic center region. It is extraordinarily large, being comparable only to Sgr B2, which is the most massive cloud in the Galaxy.
Other than G0.110.11, many dark features in the MSX map are found in the Galactic center region. They are called the MSX dark clouds (Egan et al., 1998). Some of them have also been observed in the line (Carey et al., 1998). Typical column densities for MSX dark clouds are estimated to be . Our estimated column density of G0.110.11 is as large as the typical MSX dark clouds; n.b., (Carey et al., 1998) did not observe G0.110.11.
Finally we estimated the molecular mass of G0.110.11 to be from the integrated intensity in the H13CO+ line for . This is consistent with the previous estimate, based on the CS line (, Tsuboi et al. 1997). We should note that the previous estimate was made on the assumption that the CS line is moderately opaque () and should therefore have a large uncertainty.
4.2 The SiO-emitting Clump and its Structure
The intensity ratio of the two SiO lines, is about 0.9–1.0 for all the features in G0.110.11 (§ 3.2). This value implies two possibilities; one is that the both SiO lines are optically thick, and the other is that both lines are optically thin and the density of molecular hydrogen in the SiO-emitting gas is . However, the latter case is unlikely for the following two reasons. If the hydrogen density were , the CS lines would be optically thin. But our estimation (§ 4.1), as well as the previous estimate (Tsuboi et al., 1997), shows that the CS line is (at least moderately) optically thick. Moreover, uniformity of the SiO line intensity ratio over G0.110.11 under the optically thin case requires uniformity of the gas density over a scale of several parsecs in a cloud that, on the contrary, is known to have a complicated morphology. Therefore, we conclude the former case to be likely: both SiO lines are optically thick in G0.110.11.
Because the observed antenna temperature at the SiO line is much lower than the expected gas kinetic temperature, the beam filling factor must be smaller than unity; i.e. the telescope beam is not filled by the emitting surface. Hence, we should employ a “clumpy model” (Snell et al., 1984) to consider the physical state of G0.110.11. Using the clumpy model, the observed line intensity ratio depends on the opacity of the emitting clumps, and the observed antenna temperature is reduced by the beam filling factor.
Using the clumpy model and an optically thick line, we can roughly estimate some clump parameters. In Figure 3, we find that the main-beam brightness temperatures of most features in G0.110.11 are . When , the typical beam filling factor is 0.02. Because G0.110.11 does not show a discrete clump with 35″ beam, there must be 10 or more clumps in a beam. Thus, the clump diameter is smaller than 1.5″, or 0.06 pc. The averaged gas density in a clump is then estimated to be higher than .
In this case, a clump may be unstable because the free-fall time of the clump is much shorter than the sound crossing time. Howerver, it can be stable when the size of the clump is much smaller. Given a beam averaged column density and beam filling factor, the free-fall time is propotional to square root of the clump size. On the other hand, given a gas temperature, the sound crossing time is propotional to the size. Therefore, the clump can be stable when the size is smaller than pc for our estimated values. Note that the critical size may be much larger if the clump is supported by magnetic field.
The clumpy model can also explain why the intensity ratios of the optically thin (H13CO+ ) to thick (the CS and SiO) lines are not significantly different in the southern half of the cloud. In the clumpy model, the shape of a line profile observed with a finite beam size is given only by the distribution of the emitting clumps in velocity space. In the case of a small beam filling factor, each emitting clump does not screen other clumps even if the line is optically thick. Therefore, optically thick lines show almost the same profile shape as optically thin lines.
The CS line intensity observed by Tsuboi et al. (1997) shows that the main-beam brightness temperature in the CS line is brighter than that in the SiO lines by a factor of 3, although both the lines are optically thick in G0.110.11. This means that the beam filling factor at the SiO line must be smaller than that at the CS line. However, in the case of the simplest clumpy model, in which every emitting clump is assumed to be isothermal and uniform in density, the line intensity ratio of SiO to CS is expected to be unity because the excitation parameters of SiO and CS are very close. To resolve this discrepancy, we deduce that the emitting gas clump has a steep abundance gradient in SiO and that the typical size of an optical thick surface (or beam filling factor) that emits the SiO line is much smaller than the corresponding emission surface of the CS line. With the same clump temperature and density, the optical depth in the SiO lines can vary, depending on the SiO abundance. In fact, the observed SiO abundance, , differs by several orders of magnitude for molecular gas in the Galactic disk region: e.g., for quiescent dark clouds (Ziurys et al., 1989) and in bipolar outflows of star-forming regions (Martín-Pintado et al, 1992; Schilke et al., 1997; Gueth et al., 1998).
The ratio of the projected area of the SiO-emitting part to that of the CS-emitting part is the same as the value of the intensity ratio of these lines because both lines are optically thick. We find that the intensity ratio of SiO to CS is uniform over the cloud. This uniformity implies that the ratio of the projected areas in a clump is uniform over the cloud. Thus, the abundance gradient of SiO in the emitting clump is presumably due to a mechanism on a scale much larger than the whole cloud. Consequently, clump internal structure should be the same over the whole cloud. In this case, it is a reasonable assumption that the emitting clump is spherically symmetric.
In the case of a spherically symmetric clump, the SiO-emitting part should be at smaller radius than the CS-emitting part. It follows that the emitting clump is hotter in the innermost part because the SiO abundance is believed to increase in hot (e.g. shock heated) gas. Even in this case, our discussion is valid, although our model is inconsistent to the simplest clumpy model; the main-beam brightness temperature of an optically thick clump is the same when the product of the surface area and the actual brightness temperature is the same.
The large opacity even in dense gas tracers and large extinction even in mid-infrared suggest that the cooling time may be longer than in cores in star-forming regions in the Galactic disk region. Using virial mass analysis, Sawada et al. (2001) show that molecular clouds in the Galactic center region are under a high pressure of . Emitting clumps in G0.110.11 may be compressed by this external pressure.
From our observations, G0.110.11 is found to be likely composed of many hot and dense clumps, which can hardly be cooled down because of large extinction even in infrared. This condition is greatly different from that of star-forming clouds in the Galactic disk region. Under such condition, star formation should be very different. This may be a reason why a dense cluster of massive stars is seen only in the Galactic center region. Although G0.110.11 is a good site for investigating this speculation, high-resolution observations in rarer molecules such as CS isotopes are required to unveil optically thick clumps.
References
- Carey et al. (1998) Carey, S. J., Clark, F. O., Egan, M. P., Price, S. D., Shipman, R. F., & Kuchar T. A. 1998, ApJ, 508, 721
- Egan et al. (1998) Egan, M. P., Shipman, R. F., Price, S. D., Carey, S. J., & Clark, F. O. 1998, ApJ, 494, L199
- Figer et al. (2002) Figer, D. F., et al. 2002, ApJ, 581, 258
- García-Burillo et al. (2000) García-Burillo, S., Martín-Pintado, J., Fuente, A., & Neri, R. 2000, A&A, 355, 499
- Gueth et al. (1998) Gueth, F., Guilloteau, S., & Bachiller, R. 1998, A&A, 333, 287
- Hüttemeister et al. (1993) Hüttemeister, S., Wilson, T. L., Bania, T. M., & Martín-Pintado J. 1993, A&A, 280, 255
- Irvine et al. (1987) Irvine, W. M., Goldsmith, P. F., & Hjalmarson, A. 1987, in Interstellar Processes, ed. D. J. Hollenbach & H. A. Thronson (Dordrecht: Reidel), 561
- Kutner & Ulich (1981) Kutner, M., & Ulich, B. L. 1981, ApJ, 250, 341
- Lis et al. (2001) Lis, D. C., Serabyn, E., Zylka, R., & Li Y. 2001, ApJ, 550, 761
- Martín-Pintado et al (1992) Martín-Pintado, J., Bachiller, R., & Fuente A. 1992, A&A, 254, 315
- Martín-Pintado et al. (1997) Martín-Pintado, J., de Vicente, P., Fuente, A., & Planesas, P. 1997, ApJ, 482, L45
- Mathis (2000) Mathis, J. S. 2000, in Allen’s Astrophysical Quantities, ed by A. N. Cox (4th ed; New York: AIP), 523
- Morris et al. (1983) Morris, M., Polish, N., Zuckerman, B., & Kaifu, N. 1983, AJ, 88, 1228
- Oka et al. (1998) Oka, T., Hasegawa, T., Hayashi, M.., Handa, T., & Sakamoto, S. 1998, ApJ, 493, 730
- Oka et al. (2001) Oka, T., Hasegawa, T., Sato, F., Tsuboi, M., & Miyazaki A. 2001, PASJ, 53, 779
- Pierce-Price et al. (2000) Pierce-Price, D., et al. 2000, ApJ, 545, L121
- Reich (2003) Reich, W. 2003, A&A, 401, 1023
- Sakano (2000) Sakano, M. 2000, Ph.D. thesis, Kyoto Univ.
- Sakano et al. (1999) Sakano, M., Koyama, K., Nishiuchi, M., Yokogawa J., Maeda, Y. 1999, Adv. Space Res., 23, 969
- Sawada et al. (2001) Sawada, T., et al. 2001, ApJS, 136, 189
- Schilke et al. (1997) Schilke, P., Walmsley, C. M., & Pineau des Forêts, G., & Flower, D. R. 1997, A&A, 321, 293
- Snell et al. (1984) Snell, R. L., Mundy, L. G., Goldsmith, P. F., Evans, N. J., II, & Erickson N. R. 1984, ApJ, 276, 625
- Tsuboi et al. (1999) Tsuboi, M., Handa, T., & Ukita, N. 1999, ApJS, 120, 1
- Tsuboi et al. (1997) Tsuboi M., Ukita N., Handa T. 1997, ApJ, 481, 263
- Yusef-Zadeh et al. (2002) Yusef-Zadeh, F., Law, C., & Wardle, M. 2002, ApJ, 568, L121
- Ziurys et al. (1989) Ziurys, L. M., Friberg, P., & Irvin, W. M. 1989, ApJ, 341, 857