Gas Infall and Stochastic Star Formation in Galaxies
in the Local Universe
Guinevere Kauffmann1, Timothy M. Heckman2, Gabriella De Lucia1,
Jarle Brinchmann3, Stéphane Charlot4, Christy Tremonti5, Simon D.M. White1
Jon Brinkmann6
1Max-Planck Institut für Astrophysik, D-85748 Garching, Germany
2Department of Physics and Astronomy, Johns Hopkins University, Baltimore, MD 21218
3Astrofi’sica da Universidade do Porto, Rua das Estrelas - 4150-762 Porto, Portugal
4 Institut d’Astrophysique du CNRS, 98 bis Boulevard Arago, F-75014 Paris, France
5 Steward Observatory, University of Arizona, 933 North Cherry Avenue,
Tucson, AZ 85721, USA
6 Apache Point Observatory, P.O. Box 59, Sunspot, NM 88349
Abstract
We study the recent star formation histories of local galaxies by analyzing the scatter in their colours and spectral properties. We present evidence that the distribution of star formation histories changes qualitatively above a characteristic stellar surface mass density of kpc-2, correponding to the transition between disk-dominated (late-type) galaxies and bulge-dominated (early-type) systems. When we average over subpopulations of galaxies with densities below this value, we find that subpopulations of all masses and densities form their stars at the same average rate per unit stellar mass. However, the scatter in galaxy colours, stellar absorption line indices and emission line strengths is larger for more compact galaxies of a given mass. This suggests that star formation occurs in shorter, higher amplitude events in galaxies with smaller sizes. Above the characteristic density, galaxy growth through star formation shuts down and the scatter in galaxy colours and spectral properties decreases. We propose that in low density galaxies, star formation events are triggered when cold gas is accreted onto a galaxy. We have used the new high resolution Millennium Simulation of structure formation in a “concordance” CDM Universe to quantify the incidence of these accretion events and we show that the observational data are well fit by a model in which the consumption time of accreted gas decreases with the surface density of the galaxy as . The dark matter halos that host massive galaxies with high stellar surface mass densities are also expected to grow through accretion, but the observations indicate that in bulge-dominated galaxies, star formation is no longer coupled to the hierarchical build-up of these systems.
Keywords: galaxies: formation,evolution; galaxies: fundamental parameters; galaxies: haloes; galaxies: starbursts; galaxies: statistics; galaxies: stellar content; galaxies: structure
1 Introduction
The physical processes that regulate the rate at which galaxies form stars and the timescale over which galaxies evolve from star-forming to “passive” systems are still not understood. One key ingredient is the observed relationship between the large scale star formation rate in a galaxy and the physical conditions in its interstellar medium . Schmidt (1959) showed that the observed surface densities of gas and star formation in external galaxies can be related by a power law,
| (1) |
The validity of the Schmidt law has been tested in many empirical studies, with most measured values of falling in the range 1-2. The most comprehensive recent study is that of Kennicutt (1998), who used measurements of H, HI and CO in both normal spiral galaxies and infrared-selected starburst galaxies to show that the disk-averaged star formation rates in the combined sample could be represented by a Schmidt law with over several orders of magnitude in gas density.
If galaxies evolved in isolation as closed boxes, the Schmidt law implies that their star formation rates should decline smoothly with time. There is considerable evidence, however, that the star formation rates in many galaxies have not been monotonic with time, but have instead exhibited significant fluctuations. Analyses of the colour-magnitude diagrams of stars in Local Group galaxies show that no two Local Group members have identical star formation histories (see Grebel 2001; Dolphin et al 2005 for reviews). Many of the dwarf galaxies appear to have formed their stars in one or two discrete episodes or bursts. The Large and Small Magellanic Clouds seem to have formed stars continuously, but at a variable rate (Dolphin 2000; Smecker-Hane et al 2002; Harris & Zaritksy 2004 ). An analysis of solar neighbourhood data from the Hipparcos catalogue by Hernandez, Valls-Gabaud & Gilmore (2000) indicates that star formation in our own Milky Way has also been variable (see also De la Fuente Marcos & De la Fuente Marcos 2004). All these observations suggest that star formation in galaxies is subject to either internal or external triggering mechanisms.
It is not yet possible to derive accurate star formation histories for galaxies outside our own Local Group. Instead, measurements of colours and spectral features provide a “snapshot” of the ages of the stellar populations and the current star formation rates in these systems. An analysis of the intrinsic scatter in these measurements can diagnose whether star formation has been continuous or bursty (Searle, Sargent & Bagnuolo 1973).
Larson and Tinsley compared the scatter in the UBV colours of galaxies in the Atlas of Peculiar Galaxies (Arp 1966) with “normal” galaxies drawn from the Hubble Atlas of Galaxies (Sandage 1961). Their results provided evidence for a “burst” mode of star formation associated with violent dynamical phenomena. Seiden & Gerola (1979) and Gerola, Seiden & Schulman (1980) invoked internal interstellar medium processes to explain intermittent star formation rates in dwarf galaxies. In their view, star formation always occurs in discrete units with typical masses and sizes comparable to those of Giant Molecular Clouds. It was assumed that star formation in one unit could trigger star formation in a neighbouring unit with a certain probability . Once star formation occurred, each unit required a certain recovery period before it was able to form stars again. Because dwarf galaxies host only a small number of these units, statistical fluctuations in the number of units that are forming stars at any given time result in integrated star formation histories that are bursty. A key prediction of this scenario is that the lowest mass systems experience the largest relative fluctuations in star formation rate. Gerola et al did not compare the predictions of their models with observations, arguing that the available samples were incomplete, and in many cases heavily biased by selection effects.
In this paper, we revisit the question of the scatter among the recent star formation histories of local galaxies. Two recent developments motivate this work. The first is the availability of magnitude-limited samples of hundreds of thousands of galaxies with high quality spectra and multi-band photometry. The second development is the establishment of the cold dark matter (CDM) model, augmented with a dark energy field, as the standard theoretical paradigm for structure and galaxy formation. Measurements of the cosmic microwave background by the WMAP satellite (Spergel et al 2003) and the galaxy power spectrum by the 2dFGRS and Sloan Digital Sky Surveys (Percival et al 2001; Tegmark et al 2004) have boosted confidence in the validity of the model and have allowed precise determination of the geometry and matter content of the Universe. The collapse of the fluctuations in the dark matter component and the subsequent build-up of structure can be accurately computed using direct numerical simulation. This allows the incidence of mergers and of accretion onto galaxies to be predicted in detail as a function of cosmic epoch.
Our paper is divided into two parts. In the first part, we analyze a large sample of galaxies drawn from the Sloan Digital Sky Survey. We study how the scatter in galaxy colours and age-dependent stellar absorption features such as the 4000 Å break depend on the mass and on the structural properties of galaxies. We demonstrate that the galaxy-to-galaxy scatter does not depend primarily on the mass of the galaxy, but rather on structural properties such as surface density and concentration. The scatter increases monotonically as function of these parameters and reaches a maximum, before dropping again. We identify the location of this maximum as the point where the dominant population component transitions from disk-dominated (late-type) galaxies to bulge-dominated (early-type) systems. We also study how the distributions of star formation rates deduced from emission lines in the spectra change between diffuse, low surface density galaxies and compact, more concentrated systems of the same stellar mass.
In the second part of the paper, we introduce a simple model that can explain many of the observational trends in a self-consistent way. In our scenario, star formation in late-type, disk-dominated galaxies is regulated by two factors: a) the infall of gas that occurs as dark matter halos assemble through the process of hierarchical clustering, b) the time for the conversion of this gas into stars, which is determined by the density of the system. The infall rates are calculated using a new high resolution simulation of structure formation in a CDM “concordance” cosmology. We show that the inferred gas conversion times scale with the surface density of the galaxy approximately as predicted by the Schmidt/Kennicutt law of star formation.
2 The Sample
The data analyzed in this study are drawn from the Sloan Digital Sky Survey (SDSS). The survey goals are to obtain photometry of a quarter of the sky and spectra of nearly one million objects. Imaging is obtained in the u, g, r, i, z bands (Fukugita et al 1996; Smith et al 2002; Ivezic et al 2004) with a special purpose drift scan camera (Gunn et al 1998) mounted on the SDSS 2.5 meter telescope (Gunn et al 2005) at Apache Point Observatory. The imaging data are photometrically (Hogg et al 2001; Tucker et al 2005) and astrometrically (Pier et al 2003) calibrated, and used to select stars, galaxies, and quasars for follow-up fibre spectroscopy. Spectroscopic fibres are assigned to objects on the sky using an efficient tiling algorithm designed to optimize completeness (Blanton et al 2003a). The details of the survey strategy can be found in (York et al 2000) and an overview of the data pipelines and products is provided in the Early Data Release paper (Stoughton et al 2002).
Our parent sample for this study is composed of 397,344 objects which have been spectroscopically confirmed as galaxies and have data publicly available in the SDSS Data Release 4 (Adelman-McCarthy et al 2005). These galaxies are part of the SDSS ‘main’ galaxy sample used for large scale structure studies (Strauss et al 2002) and have Petrosian magnitudes in the range after correction for foreground galactic extinction using the reddening maps of Schlegel,Finkbeiner & Davis (1998). Their redshift distribution extends from to 0.30, with a median of 0.10.
The SDSS spectra are obtained with two 320-fibre spectrographs mounted on the SDSS 2.5-meter telescope. Fibers 3 arcsec in diameter are manually plugged into custom-drilled aluminum plates mounted at the focal plane of the telescope. The spectra are exposed for 45 minutes or until a fiducial signal-to-noise (S/N) is reached. The median S/N per pixel for galaxies in the main sample is . The spectra are processed by an automated pipeline, which flux and wavelength calibrates the data from 3800 to 9200 Å. The instrumental resolution is R = 1850 – 2200 (FWHM Å at 5000 Å). At the median redshift of the SDSS main galaxy sample () the target galaxies subtend several arcseconds on the sky. The fraction of galaxy light falling in the 3 arcsec fibre aperture is typically about 1/3.
In this paper we use the amplitude of the 4000 Å break (the narrow version of the index defined in Balogh et al. 1999) and the strength of the H absorption line (the Lick index of Worthey & Ottaviani 1997) as diagnostics of the stellar populations of the host galaxies. Both indices are corrected for the observed contributions of the emission-lines in their bandpasses (see Tremonti et al 2004 for a more detailed discussion). As described in Kauffmann et al (2003a), a library of 32,000 model star formation histories and the measured and indices are used to obtain a median likelihood estimate of the -band mass-to-light ratio for each galaxy. By comparing the colour predicted by the best-fit model to the observed colour of the galaxy, we also estimate the attenuation of the starlight due to dust.
The SDSS imaging data provide the basic structural parameters that are used in this analysis. We use the -band as our fiducial filter because it is the least sensitive to the effects of dust attenuation. The -band absolute magnitude, combined with our estimated values of M/L and dust attenuation yield the stellar mass (). The half-light radius in the -band and the stellar mass yield the effective stellar surface mass-density (). As a proxy for Hubble type we use the SDSS “concentration” parameter , which is defined as the ratio of the radii enclosing 90% and 50% of the galaxy light in the band (see Stoughton et al. 2002). Strateva et al. (2001) find that galaxies with 2.6 are mostly early-type galaxies, whereas spirals and irregulars have 2.0 2.6.
The procedures we adopt for estimating stellar masses are described in detail in Kauffmann et al (2003a). The relations between stellar absorption line indices, stellar masses and structural parameters are discussed in Kauffmann et al (2003b). We have also used star formation rates estimated from the emission lines using the methods described in Brinchmann et al (2004). The parameters from our analyses have been made publically available at http://www.mpa-garching.mpg.de/SDSS/. Where appropriate we adopt a cosmology of , , and H0 = 70 km s-1 Mpc-1.
3 Observational Analysis
3.1 Analysis of Matched Galaxy Pairs
In order to draw meaningful physical conclusions from an analysis of the scatter in the colours or spectral features of galaxies, it is important that the galaxy sample be as homogeneous as possible. The mean stellar ages of galaxies are known to correlate strongly with properties such as galaxy luminosity, mass, concentration and size (Tinsley 1968). The reader is referred to Kauffmann et al (2003b) and Blanton et al (2003b) for a detailed analysis of these correlations for galaxies in the SDSS. Throughout this paper we analyze galaxies that are selected to be as similar as possible in terms of their stellar masses and structural properties. In order to minimize any additional scatter in spectroscopic parameters induced by mismatched apertures, we also require that the galaxies be closely matched in redshift.
In this section, we analyze a sample of matched galaxy pairs. In our default sample, pairs are selected to have , , , km s-1 and (where and are in units of and kpc-2, is the concentration index, is the stellar velocity dispersion and is the redshift). For galaxies with stellar masses less than the tolerances are relaxed to , , km s-1 and because there are fewer low mass galaxies in our sample. Even with these very stringent matching constraints, we find 139,676 distinct galaxy pairs (where ‘distinct’ means that no galaxy is assigned to a pair more than once). We now use this pair sample to study how the variation in star formation history between structurally similar galaxies depends on properties such as mass, concentration and stellar surface mass density.
Since we wish to analyze the properties of our sample as a function of stellar mass rather than of -band absolute magnitude, it is important to ensure that survey selection effects do not bias our estimates of the scatter, because at fixed stellar mass, young galaxies with small mass-to-light ratios are detected out to greater distances than old galaxies with large mass-to-light ratios. For each stellar mass, we calculate the limiting redshift out to which a galaxy with maximal is detected in the survey. The maximal is computed using the Bruzual & Charlot (2003) population synthesis models assuming a single star formation burst at . Any pair with a redshift greater than this limit is excluded from the analysis.
Before we analyze our default sample, it is useful to illustrate the effect of increasing the precision with which galaxies are paired by increasing the number of parameters which are required to match within small tolerances. This is illustrated in Figure 1 where each panel corresponds to pairs matched in a different number of parameters. For each panel we rank all the pairs in order of increasing stellar mass and then divide them into groups that each contain 1500 pairs. For each group, we calculate the r.m.s. difference in the 4000 Å break strengths of the paired galaxies. 111There are two reasons why Dn(4000) is used as our default stellar age indicator throughout this paper: 1) It has very small measurement errors; 2)It is more insensitive to dust than galaxy colours. We also correct for the contribution of observational errors by subtracting in quadrature the errors in Dn(4000) for each pair. From now on, we will refer to this quantity as the variation in Dn(4000). Because there are always a fixed number of pairs in each group, the error on each point plotted in Figure 1 should be similar. It can be estimated from the scatter in the plotted points at intermediate values of , where the number of pairs is very large.
The top left panel shows the dependence of the variation on if pairs are only matched in stellar mass and redshift. As can be seen, the variation peaks at . As discussed in Kauffmann et al (2003b), most low mass galaxies have young stellar populations and most high mass galaxies have old stellar populations. A sharp transition between these two regimes occurs at a characteristic stellar mass of (also at a characteristic stellar surface mass density of kpc-2 and a concentration index of 2.6). This explains why the variation peaks around this stellar mass. However, the top right and bottom left panels show that this peak is largely suppressed once galaxies are matched in both stellar mass and structural parameters such as size or concentration. The bottom right panel shows the variation as a function of stellar mass for our default pair sample, which is matched in redshift, , size, concentration and velocity dispersion.

In Figure 2, we plot the variation in Dn(4000) as a function , , and for our default pair sample. Interestingly the peak in the variation is larger and also more sharply defined for the parameters and than for and . For the two structural parameters, the peak occurs at , very close to the characteristic values given in Kauffmann et al (2003b). The smallest variations in Dn(4000), on the other hand, are obtained for galaxies with the largest velocity dispersions. The peak in the variation is interesting because it indicates that there are certain values of the structural parameters where we are least able to predict the age of the stellar populations in a galaxy. This shows that the transition from star-forming to “passive” is most likely driven by the structure of the galaxy rather than its mass.
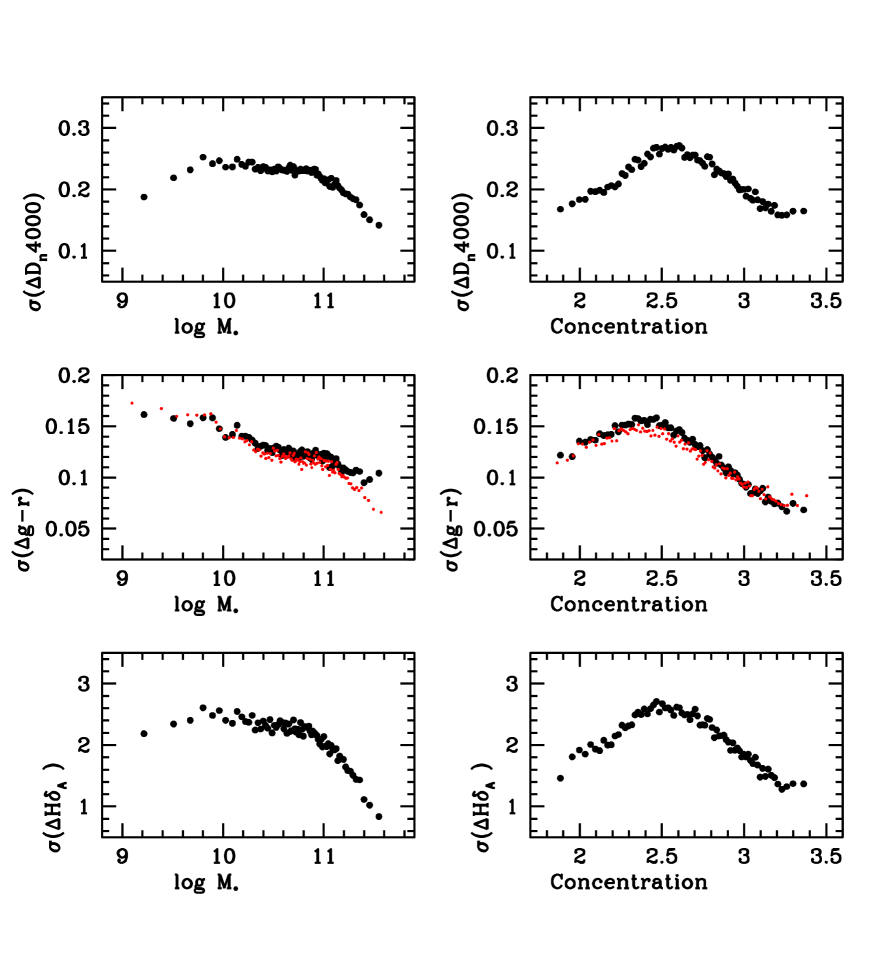
We now demonstrate that the peak in variation at around 2.6 and is not confined to one particular stellar indicator. Figure 3 compares the variations as a function of and for three different age-sensitive indicators: the 4000 Å break (as before), the Petrosian and fibre colours, and the H Lick index. As can be seen, the maximum at is apparent for all three indicators. (We note that similar results are found as a function of , with the peak always at kpc-2.) The variation in Dn(4000) and H exhibit very similar behaviour as a function of and . The variation in colour exhibits somewhat different behaviour, particularly for the lowest mass galaxies where it rises rather than falls. The variation in colour also falls off less steeply at the highest stellar masses. The results presented in the middle panel of Figure 3 show that we obtain almost identical results for both fibre colours (which, like the indices, sample the light from the central 3 arcsec of the galaxy) and Petrosian colours (which sample the light from the entire galaxy). This suggests that the differences between colours and indices are not caused by the fact that the two quantities are measured within different apertures. Galaxy colours are sensitive to dust extinction as well as to mean stellar age and it is thus likely that variable extinction in different galaxies contributes significantly to the variation in colour.
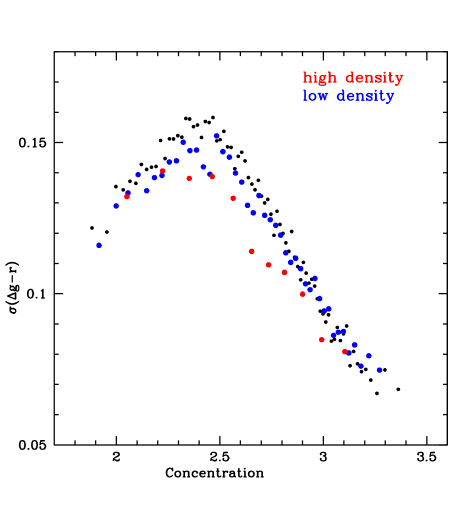
We now consider how much of the variation is contributed by the dependence of the colours and star formation rates of galaxies on their environment. As described by numerous authors (see Hogg et al 2003; Kauffmann et al 2004; Blanton et al 2005 for discussions pertaining to SDSS galaxies), galaxy colours are strongly dependent on local density, with the fraction of red galaxies increasing strongly in the highest density environments. Following Kauffmann et al 2004, we have calculated galaxy counts in cylindrical apertures of radius 2 Mpc and depth 500 km s-1 around each galaxy. We repeat our analysis by selecting pairs from a subsample that contains half the galaxies in the lowest density environments. The results are shown as blue symbols in Figure 4. Also shown are results for a subsample that includes 20% of the galaxies in the densest regions (red symbols). As can be seen, if galaxies are restricted to lie in more similar environments, the overall amplitude of the variation decreases, although the reduction is small. 222 As shown in Figure 7 of Kauffmann et al 2004, the largest shifts in the median value of Dn(4000) as a function of and occur for the two densest (red and magenta) bins, which together comprise less than 10% of all the galaxies in the sample. Because the distribution of Dn(4000) is bimodal, the variation in Dn(4000) is also expected to be less sensitive to environment than the median value. However, the trends as a function of and remain the same.
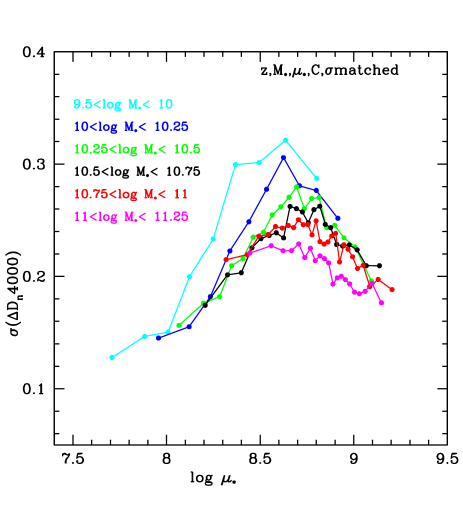
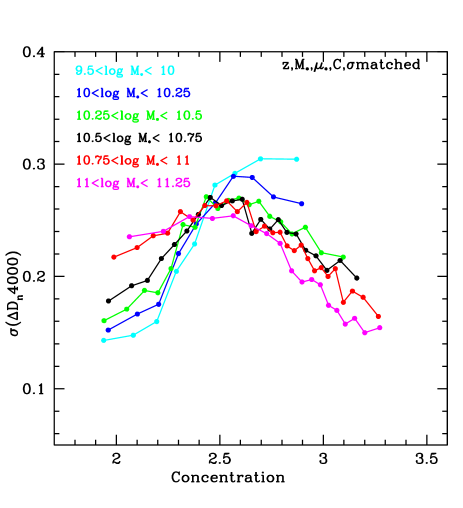
Finally, in Figures 5 and 6, we plot the variation in Dn(4000) for six narrow ranges in . Low mass galaxies have lower concentrations and stellar surface mass densities than high mass galaxies. Nevertheless, our results show that the trend for the variation to increase with concentration (surface density) for () and to decrease with concentration (surface density) for () occurs for all galaxies independent of their stellar mass. It is curious that at low stellar surface densities, lower mass galaxies have larger variation than higher mass galaxies, but at low concentrations, the opposite appears to be true. At high surface densities and concentrations, the most massive galaxies always have the smallest variation.

3.2 Distribution Functions
A more intuitive way of phrasing the results presented in the previous section is in terms of the ability to predict the stellar populations of a galaxy, given full information about its mass and structural properties. The results presented in Figures 3-6 show that the stellar populations are least predictable at C=2.5 and and most predictable both at very low and at very high values of and .
High values of and correspond to the regime of galaxy spheroids and bulges. “Predictability” simply reflects the fact that star formation has switched off in bulge-dominated galaxies and their stars are now uniformly old. More puzzling is the increase in variation as a function of and for the star-forming, disk-dominated galaxies in our sample. In this section, we attempt to gain more insight into this trend.
As shown in Figure 1, matching galaxies in redshift, stellar mass and a single structural parameter (either concentration or surface density) already causes the variation in Dn(4000) to decrease to close to its minimum level. In this section, we present the distribution in Dn(4000) of galaxies in narrow intervals of mass and stellar surface mass density. This is illustrated in Figures 7 and 8 for galaxies with stellar masses in the ranges and . In order to make these plots, we have have relaxed the redshift matching tolerance to and instead of matching pairs, we find all galaxies that lie within the specified range in and . Distributions are shown for samples containing at least 700 galaxies.
At stellar surface mass densities less than kpc-2, the main body of the population has Dn(4000) values peaked at around 1.3-1.4. There is a tail of objects with higher values of Dn(4000) and the fraction of galaxies contained in this tail increases with stellar surface mass density. At stellar surface mass densities greater than kpc-2, the parity of the distribution rapidly switches and the main body of the population is peaked at large values of Dn(4000), with a tail of objects towards the blue.


There are two scenarios that come to mind when attempting to explain these trends:
-
1.
As surface density increases, an increasing fraction of galaxies have stopped forming stars. In this scenario, the blue and red populations are disjoint. Once a galaxy stops forming stars, it joins the red population and stays there permanently.
-
2.
As surface density increases, galaxies still form the same total number of stars, but the characteristic timescale over which star-forming events occur becomes shorter. In this scenario, the blue and red populations are not disjoint. Galaxies may stop forming stars temporarily, but star formation will be triggered again at a later time. Galaxies thus migrate from the blue peak to the red and then back again. The red population is more dominant at high surface densities, because the characteristic dynamical times in these objects are smaller and star formation occurs in shorter bursts of higher intensity. Following the end of a burst of star formation, Dn(4000) increases to values characteristic of old stellar populations in timescales of less than a Gyr for bursts involving a small fraction of the total mass of the galaxy (Charlot & Silk 1994).
These two scenarios can be distinguished by a very simple test. In scenario 1, the average amount of star formation for the population as a whole should decrease as the surface density becomes larger and as more and more galaxies “switch off”. In scenario 2, the average amount of star formation should remain constant as a function of surface density. Because star formation occurs in shorter, more intense bursts, one also expects to see a larger fraction of galaxies with strong emission lines.
The results of this test are shown in Figure 9. We have used the in-fibre specific star formation rates estimated by Brinchmann et al (2004) to calculate the average star formation rate per unit stellar mass as a function of stellar surface mass density. The results are shown as thick solid lines on Figure 9 for nine different ranges in . The dotted curves indicate the upper 95th percentile and lower 25th percentile of the distributions of SFR at a given value of .
As can be seen, the average specific star formation rate remains remarkably constant for low mass galaxies. For higher mass galaxies, remains constant for and decreases at higher surface densities. 333Note that the timescale associated with this specific star formation rate years. For our assumed Kroupa (2001) IMF, the return fraction is , so this corresponds to a mean timescale for the build-up of the galaxies of years. The satisfying consistency with the Hubble time shows the consistency of the calibrations of our observational stellar mass and star formation rate indicators. We have also checked that we obtain the same mean time scale when we use the aperture-corrected specific star formation rates derived by Brinchmann et al (2004). Over the range of surface densities where is constant , the upper 95th percentile of the distribution of SFR/ exhibits a small but significant increase, while the lower 25th percentile drops very steeply. This shows that even though the specific star formation rates averaged over the galaxy population as a whole do not depend on density or on mass for , the star formation histories of the galaxies in our sample do change systematically as increases. At a given stellar mass, more compact and dense galaxies experience stronger bursts as well as extended periods of inactivity. We conclude that Scenario 2 provides a good description of what is happening below the characteristic surface density. Above this density, the decrease both in the average value of SFR/ and in the upper and lower percentiles indicates that star formation is truly shutting down at very high densities and that Scenario 1 provides a more accurate description of the current state of these galaxies. Figure 9 also shows that the total spread in SFR/ reaches a maximum at the characteristic surface density . This is in good agreement with the results shown in the previous section.
Finally we note that the average value of SFR/ below the characteristic surface density is almost independent of stellar mass. Over the mass range from to , always has values in the range -9.7 – -9.9. This “universality” in the value of the average specific star formation rate was also discussed in Brinchmann et al (2004). It is quite remarkable and we will try to provide an explanation for why this should be the case in the following section.

4 A Simple Model
4.1 The Millennium Run Simulation
In the previous section we showed that at stellar surface densitities below kpc-2, the mean specific star formation rate of galaxies of given mass and surface density does not depend on either mass or surface density, but the scatter in star formation rate between galaxies of the same mass and surface density increases with surface density. The simplest interpretation is then that all these galaxies form stars at the same time-averaged rate, but that the star formation is burstier in high surface density galaxies. The question that then arises is what is reponsible for triggering episodic star formation in these galaxies?
In hierarchical models of galaxy formation (e.g. White & Rees 1978; White & Frenk 1991; Kauffmann, White & Guiderdoni 1993; Cole et al 1994; Kauffmann et al 1999; Somerville & Primack 1999; Cole et al 2000; Croton et al 2005), galaxies grow by merging and by accretion of gas from their surroundings. At early times and in low mass structures, the gas cooling times are short. The supply of gas onto a galaxy is regulated by infall of new material that occurs as its surrounding dark matter halo grows with time. At late times and in massive structures, the cooling times become longer than the local dynamical time. Infalling gas then shock heats to the virial temperature of the halo and forms a hot atmosphere which cools quasi-statically. In recent work, Forcada-Miro & White (1997) and Birnboim & Dekel (2003) showed that for realistic dark matter halos in a CDM cosmology, the transition between the infall-regulated and cooling flow regimes occurs at a halo mass of approximately at the present day. Thus, the majority of lower mass galaxies in our sample may be experiencing infall-regulated gas accretion.
In early work (e.g. White & Frenk 1991) the infall-regulated regime was modelled in an approximate way – every halo was assumed to have the same accretion history. With the advent of large N-body simulations, it has become possible to follow the build-up of dark matter halos of Milky Way mass and larger in cosmologically interesting volumes (Kauffmann et al 1999). In this paper we make use of a new high-resolution simulation – the Millennium Simulation – recently carried out by the Virgo Consortium and described in Springel et al (2005). With 21603 particles in a cubic region 500 Mpc on a side (i.e. a particle mass of ), the simulation offers an unprecedented combination of high spatial resolution and a large simulated volume and it permits detailed statistical analysis of the assembly histories of dark matter halos down to masses typical of LMC/SMC-type galaxies.
The post-processing of the simulation data includes the identification of gravitationally bound dark matter subhalos orbiting within larger virialized structures. This is carried out using an extended version of the SUBFIND algorithm described in Springel et al (2001). These subhalos are then tracked over time in order to construct hierarchical merging trees that describe in detail how cosmic structures build up over time. These merging trees are stored at 64 different redshifts spaced logarithmically from to and they form the basis for the analysis carried out in this section.
4.2 Mass accretion histories for dark matter halos
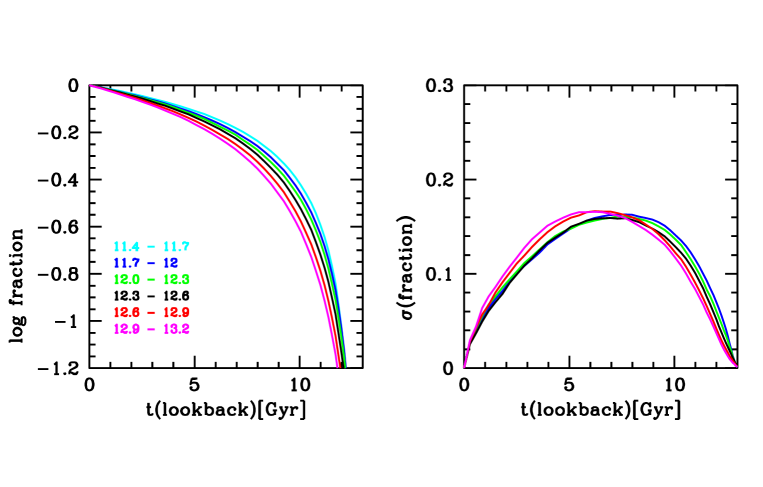
The left panel of Figure 10 shows the average mass accretion histories for dark matter halos in a number of different mass ranges. A galaxy with the mass of the Milky Way would be expected to reside in a dark matter halo of mass of a few at the present day, so our accretion histories are relevant for the mass range of galaxies contained in our observational samples. To calculate the average history, we track the mass of the most massive progenitor of each halo back in time, i.e. at time , we find the largest progenitor of the object that is the largest progenitor at time (where , and measures the time since the Big Bang). This procedure is repeated for all the halos in the simulation volume and the average histories are calculated by summing over all the halos in the given mass range. Note that this procedure does not ensure that the object identified at time is the most massive among all possible progenitors of the halo at that time (i.e. when the trunk of the merger tree bifurcates, the largest branch at the point of bifurcation may not lead to the largest branches at all earlier epochs). In this analysis we are mainly concerned with the recent accretion histories of galaxies, typically before any bifurcation has taken place, so these subtleties will not be important for us.
Figure 10 indicates that more massive halos assemble later than less massive halos. Over the range of masses shown in the plot, this effect is rather weak (it is a much larger effect for larger dark matter halos with masses corresponding to those of rich groups and clusters). Dark matter halos of galactic mass have typically accreted 15-20% of their final mass in the past 3 Gyr, % in the past 2 Gyr and % in the past Gyr. As well as the average accretion history, the simulations can be used to study the scatter in the accretion histories among different halos of the same mass. The right panel of Figure 10 shows the r.m.s dispersion in the fraction of the final mass of the halo that is contained in the largest progenitor as a function of lookback time for halos in the same ranges of mass. As can be seen, the dispersion is also very insensitive to the mass of the halo. Figure 11 shows nine random accretion histories for halos with masses between and . As can be seen, there is a significant variation in recent accretion histories. In some halos, there has been very little accretion over the past several Gyr, while in others the halo has accreted as much as a third of its mass during this period. It can also be seen that in some haloes, the accretion occurs smoothly over timescales of many Gyrs and in others, there are sudden “jumps” when the halo significantly increases its mass over a short period of time. 444Note that numerical effects occasionally cause the masses of halos to decrease by a small amount and a faithful representation would lead to a number of downward “glitches” being visible in Figure 11. We have chosen to smooth over these by forcing the mass to remain constant during these periods. This allows us to transform directly from the mass accretion history of the halo to the star formation history of the galaxy as described in section 4.3 We intend to present a statistical analysis of these different types of accretion events in a future paper.

4.3 From mass accretion histories to star formation histories
We now make the simple assumption that the star formation history of a galaxy directly tracks the accretion history of its surrounding dark matter halo (and hence the accretion history of cold gas). The accretion histories are computed directly from the Millennium Run simulation as described above. The only free parameter in the model is the timescale over which the accreted gas is converted into stars. We will denote this gas consumption timescale as from now on. During time , the halo will have accreted mass , which corresponds to a fraction of the final mass of the halo. We assume the same fraction of the final baryonic mass of the galaxy is also accreted during this time step and that it is transformed into stars at a constant rate over time .
As shown in Figure 10, the distribution of specific accretion histories of dark matter halos varies very little with mass over the range . This means that is the only parameter that significantly affects the star formation histories of galaxies in our model. At recent times, all dark matter halos accrete, on average, the same fraction of their mass. According to our simple model, all galaxies therefore accrete the same fraction of their mass in gas (In practice, some fraction of the accreted material will be in the form of stars, but we will neglect this for simplicity). If the gas consumption time is short, the accreted gas is converted into stars very rapidly in a burst. If the gas consumption time is long, the effects of the individual accretion events will be smoothed out and the star formation history of the galaxy will be more continuous. This model is thus qualitatively similar to scenario 2 described in section 3.2. The fact that the average specific accretion histories are so insensitive to the mass of the dark matter halos provides a natural explanation for why the specific star formation rate averaged over a population of galaxies should depend so weakly on mass (see discussion at the end of section 3.2). We now investigate whether the model can yield results that are in quantitative agreement with the observations.
Figure 12 shows the distribution of Dn(4000) predicted by the models for different values of the gas consumption timescale . These plots are for all halos with masses in the range , but as discussed, very similar results would be obtained for other mass ranges. We calculate these Dn(4000) values by summing the weighted contributions of a series of single age stellar populations (SSPs) to the red and the blue sides of the index. The SSP predictions are generated using the GALEXEV software (Bruzual & Charlot 2003).
For galaxies with mean stellar ages greater than a few Gyr, Dn(4000) is sensitive to metallicity as well as age. We have adopted a metallicity of 0.5 solar, which is an appropriate mean metallicity for galaxies with stellar masses (Gallazzi et al 2005). As can be seen, when is large, the main body of the distribution is peaked at Dn(4000). As decreases, the fraction of galaxies in the red tail increases, but the position of the blue peak remains relatively constant. This is very reminiscent of the trends seen in Figures 7 and 8 at stellar mass densities below kpc-2. When is small, the number of galaxies in the red peak becomes almost equal to the number of galaxies in the blue peak. However, the Dn(4000) distribution does not switch parity and is never peaked towards the red. In order to reproduce the Dn(4000) distributions of galaxies with kpc-2 shown in Figures 7 and 8, star formation must be decoupled from mass accretion at high stellar surface mass densities.
In Figure 13, we examine how the distribution of specific star formation rates predicted by the model depends on the value of the gas consumption time. The thick solid line shows the average star formation rate per unit stellar mass as a function of for our ensemble of models. The upper curves show the 95th, 97th and 99th percentiles of the distribution, while the lower curves show the lower 25th and 33rd percentiles of the distribution. As can be seen, the trends as a function of decreasing gas consumption time are very similar to the trends as a function of increasing stellar surface mass density seen in Figure 9. The average value of SFR/ remains constant (the decrease seen in the plot is because smaller fraction of the total accreted gas has been converted into stars in models with long gas consumption times). The uppermost percentiles of the distribution increase by 0.1-0.2 dex as decreases from values close to a Hubble time to 0.1 Gyr. The lower percentiles exhibit a strong drop in value, particularly for Gyr. The average specific star formation rate is slightly (0.1-0.2 dex) lower than in the observations. This may indicate that baryons were converted into stars less efficiently at high redshifts than at present.


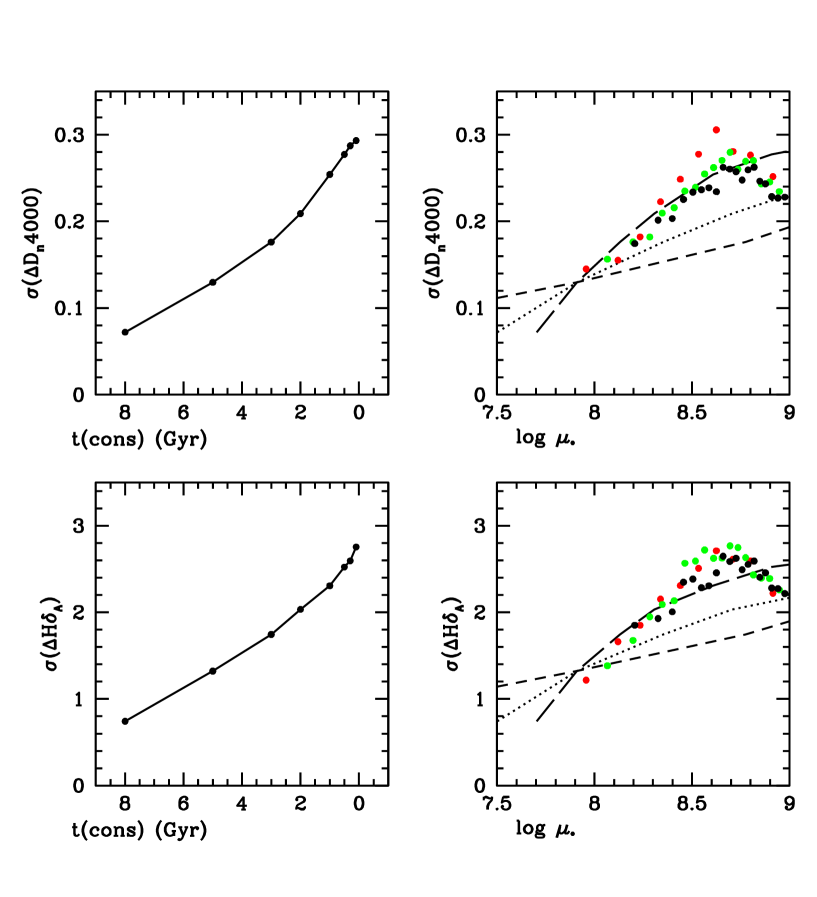
We now turn the analysis around and ask whether we can use the models to constrain how the inferred gas consumption times scale with the observed stellar surface mass densities of the galaxies in our sample. Our results are shown in Figure 14. The left hand panels show the variation in Dn(4000) and H for galaxy pairs predicted by the models for different values of . In the right hand panels, we plot the variation as a function of for the SDSS galaxies. Red symbols correspond to galaxies with in the range 10-10.25, green symbols to 10.25-10.5 and black symbols to 10.5-10.75. As can be seen, galaxies with stellar surface densities of kpc-2 have inferred gas consumption times of around 4-5 Gyr. At stellar surface densities close to the critical value of kpc-2, the inferred timescales have decreased to less than a Gyr.
To see if this behaviour can be easily understood, we make the following assumptions based on the approximation that the variation in properties is driven by individual, well-separated accretion events whose typical size scales with the mass of the galaxy (see Figure 10):
-
1.
The mean surface density of the accreted gas scales in direct proportion to the mean surface density of the stars that are already present in the galaxy.
-
2.
There is a power-law dependence between the mean surface density of star formation and the mean surface density of the accreted gas (i.e. the star formation obeys a global Schmidt law).
-
3.
All of the gas is consumed into stars; none of it is ejected.
The Schmidt law (equation 1) then allows one to derive a relation between the gas consumption time and (). By assumption 1, we have that , so that . The curves shown in the left panels of Figure 14 relate the observed variation in Dn(4000) and H to the gas consumption time. The two curves on the right hand panels show the scalings between the variation in Dn(4000)/H and that are then predicted for different values of the Schmidt-law exponent . The dotted curve is for a Schmidt law with , while the long-dashed curve shows the relation expected if . The curves are normalized to go through the same point at . As can be seen, the observations are better fit by a Schmidt law model with , where the consumption time scales as . We caution, however, that our methodology only provides indirect constraints on the form of the star formation law. All three assumptions listed above are subject to considerable uncertainty.
In models for the formation of galactic discs by the condensation of gas in gravitationally dominant dark matter halos (Fall & Efstathiou 1980; Mo, Mao, White 1998) the density of the accreted gas is determined by the angular momentum of the surrounding halo. Analysis of the size distributions of galaxies in the SDSS (Kauffmann et al 2003b; Shen et al 2003) shows that at a given luminosity or stellar mass, the distribution of half-light radii is well described by a log-normal function. For low mass galaxies, the width of the log-normal function is in good agreement with theoretical expectations. This suggests that the disk formation models do provide a reasonable explanation for the observed sizes of galaxies. So long as the angular momentum distributions of the dark matter halos surrounding galaxies of fixed mass and size have not changed substantially over the past few Gyr, one might expect assumption (1) to be valid.
Assumption (2) is more problematic. The Schmidt law is known to break down when the surface density of gas falls low enough so that the disk is stabilized against the effects of gravitational perturbations (Van der Hulst et al 1993). The effective gas consumption times in low surface density galaxies are thus likely to be longer than predicted by the canonical Schmidt law with . In addition, the Schmidt Law only comes into play once the accreted gas has settled into a cold disk and the timescale for this to happen may not be the same as the timescale over which star formation occurs once the disk is present. Finally, assumption (3) breaks down if a substantial fraction of the accreted gas is expelled from the galaxy by supernovae-driven winds.
In spite of these ambiguities, we find it encouraging that our simple model is able to reproduce so many of the trends seen in the observations self-consistently and with a minimum of free parameters.
5 Summary and Discussion
In this paper, we have attempted to infer the nature of the recent star formation histories of local galaxies by studying the scatter in their spectral properties. We have presented evidence that the distribution of star formation histories changes qualitatively above a characteristic stellar surface mass density of kpc-2. Below this density, the mean star formation rate of galaxies of given mass and surface density is independent of the values of mass and surface density, while the scatter in star formation rate increases with surface density. The simplest interpretation is that all galaxies in this regime are forming stars at a rate which will typically double their mass in a Hubble time, but that the star formation in the denser galaxies is more bursty. As a result, the scatter in specific star formation rates, stellar absorption line indices and colours is larger for smaller, more concentrated galaxies. Above the characteristic surface density, galaxy growth through star formation shuts down and the scatter in spectral properties decreases.
We propose that in galaxies below the characteristic stellar surface mass density of kpc-2, star formation events are triggered when cold gas is accreted onto a galaxy. We have used a new high resolution numerical simulation of structure formation in a “concordance” CDM Universe to quantify the incidence of these accretion events showing that observational data are well fit by a model in which the consumption time of accreted gas decreases with the surface density of the galaxy as . In high density galaxies, star formation ceases to be coupled to the hierarchical build-up of dark matter halos.
One question that arises is whether these results and inferences are consistent with past studies of the star formation histories of nearby galaxies. Qualitatively, at least, we believe that the answer is yes. One area where the issue of the intrinsic scatter in the luminosities and colours of galaxies has been of considerable importance is in the establishment of the extragalactic distance scale. The use of galaxies as distance indicators is dependent on the accuracy with which one can predict the intrinsic luminosity of the system from other measurable quantities such as its rotation speed or stellar velocity dispersion. In order for galaxies to be good distance indicators, the intrinsic scatter in their stellar mass-to-light ratios must be small. Historically, the use of galaxies as distance indicators has been confined to two classes of object: ellipticals, which have high stellar surface densities, and late-type (i.e. low density ) spirals. As shown in this paper, this is where the variation in spectral properties is at a minimum. What has not been extensively discussed in the literature is the fact that the variation exhibits a peak in the regime of parameter space between the two galaxy classes.
It is also interesting to consider whether the conclusions in this paper can shed light on trends in the star formation histories among different kinds of dwarf galaxies. Van Zee (2001) used UBV photometry, H imaging and HI observations of a large sample of isolated dwarf irregular galaxies to argue that these systems have experienced slow, but constant star formation over timescales comparable to a Hubble time. The derived gas depletion timescales were also very long, typically Gyr. These star formation histories are in strong contrast to those of blue compact dwarf galaxies, which have long been known to be experiencing strong bursts of star formation.
If blue compact galaxies are bursting because they have recently experienced a gas infall event, there should be evidence that the HI gas distribution and kinematics are systematically different in these systems than in ordinary dwarf irregulars. The HI-to-optical diameters of BCGs are typically larger than those of normal irregular galaxies (Gordon & Gottesman 1981). Whereas most dwarf irregular galaxies have well-defined, low-dispersion rotating disks of HI gas that appear undisturbed ( Skillman et al 1987; van Zee et al 1997), the HI kinematics of blue compact galaxies is much more complex. Some BCGs have extensive HI haloes that appear to be rotating (Brinks & Klein 1988;Meurer et al 1996). The 5 BCGs studied by van Zee, Skillman & Salzer (1998) all have non-ordered kinematic structure. Gordon & Gottesman (1981) and Stil & Israel (2002) argue that the HI gas in the extended envelopes around these galaxies may be falling in and providing the fuel for the starburst. If the infalling material has not yet been enriched, it would help explain why the metallicities of BCGs are frequently lower than those of other dwarf galaxies of the same luminosity (see for example Werk, Jangren & Salzer 2004). I Zw 18 is perhaps the most famous example of a blue compact galaxy with infalling gas – it has an HI envelope that extends a factor of 8 beyond its optical radius (Lequeux & Viallefond 1980) and a metallicity only 1/38th of solar (Searle & Sargent 1972; Skillman & Kennicutt 1993). Although these results for dwarf galaxies are tantalizing and suggest that our infall model may provide a way of understanding the star formation cycles in these systems, the lack of large, complete samples of dwarfs makes it difficult reach any definitive conclusions.
Further checks on our model will come from the analysis of complete samples of galaxies with HI gas mass measurements as well as star formation rates and absorption line indices from optical spectra. If our model is correct, then the trends in the gas mass fractions of galaxies as a function of stellar mass and stellar surface mass density ought to mirror the trends in specific star formation rates shown in Figure 9. As surface density increases, we expect galaxies of fixed stellar mass to use up the infalling gas more rapidly and so to have correspondingly lower mean gas fractions.
It is also interesting to investigate how galaxies would be expected to evolve as a function of redshift using our infall models. As seen in the left panel of Figure 10, the infall rates are predicted to increase strongly as a function of lookback time. As discussed in section 4.2, local galaxies have only accreted 5% of their mass in the past Gyr on average. At redshift 1, an average of 20% of the mass was accreted in the last Gyr and by redshift 2, nearly half the mass of a typical galaxy was assembled over this same period. Rather than the present-day trickle, the infall of gas would have resembled a flood. We intend to explore the implications of this in more detail in future work.
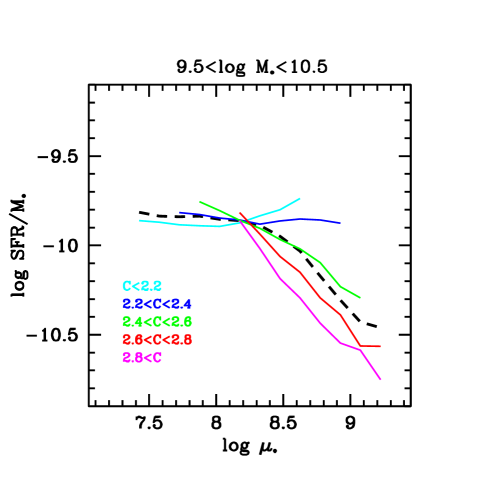
Finally, we have not addressed the reason why star formation switches off in galaxies with stellar surface mass densities greater than kpc-2. As shown in Figure 10, mergers and accretion are important in dark matter halos of all masses – indeed, more massive halos are expected to have accreted a larger fraction of their mass at late times. The observations indicate, however, that star formation in massive and dense galaxies cannot be linked to these events any longer. The results shown in Figure 15 may provide a clue to this conundrum. We have plotted the average specific star formation rate as a function of stellar surface density for galaxies with stellar masses in the range . The galaxies have been split into five different concentration bins. At stellar surface densities less than , increases for more concentrated galaxies. This is presumably because the starburst is often concentrated towards the centre of the galaxy. At stellar surface densities greater than , declines for more concentrated galaxies. The obvious interpretation of this result is that star formation is increasingly suppressed as the bulge of the galaxy becomes more dominant.
One possibility is that gas in the halo is heated and possibly even expelled as the bulge is formed (Granato et al 2001; Springel, Di Matteo, Hernquist 2005). In this case, bulge-dominated galaxies would continue to merge, but with very little associated star formation. This has been dubbed “dry merging” in recent papers by Faber et al (2005) and Van Dokkum et al (2005). It is also interesting the emission from active galactic nuclei (AGN) in the local Universe peaks very close to the stellar surface mass density ( kpc-2) where the switch in star formation behaviour occurs (Heckman et al 2004). This coincidence raises the possibility that the two phenomena are causally connected, although the empirical demonstration that this is the case still remains as a challenge for the future.
Acknowledgements
G. D. L. thanks the Alexander von Humboldt Foundation, the Federal Ministry of Education and Research, and the Programme for Investment in the Future (ZIP) of the German Government for financial support.
Funding for the creation and distribution of the SDSS Archive has been provided by the Alfred P. Sloan Foundation, the Participating Institutions, the National Aeronautics and Space Administration, the National Science Foundation, the U.S. Department of Energy, the Japanese Monbukagakusho, and the Max Planck Society. The SDSS Web site is http://www.sdss.org/. The SDSS is managed by the Astrophysical Research Consortium (ARC) for the Participating Institutions. The Participating Institutions are The University of Chicago, Fermilab, the Institute for Advanced Study, the Japan Participation Group, The Johns Hopkins University, the Korean Scientist Group, Los Alamos National Laboratory, the Max-Planck-Institute for Astronomy (MPIA), the Max-Planck-Institute for Astrophysics (MPA), New Mexico State University, University of Pittsburgh, University of Portsmouth, Princeton University, the United States Naval Observatory, and the University of Washington.
References
Adelman-McCarthy, J. et al., 2004, ApJS, in press
Arp, H., 1966, ApJS, 14, 1
Birnboim, Y., Dekel, A., 2003, MNRAS, 345, 349
Balogh, M.L., Morris, S.L., Yee, H.K.C., Carlberg, R.G., Ellingson, E., 1999, ApJ, 527, 54
Blanton, M.R., Lupton, R.H., Maley, F.M., Young, N., Zehavi, I., & Loveday, J. 2003a, AJ, 125, 2276
Blanton, M.R., et al., 2003b, ApJ, 594, 186
Blanton, M.R., Eisenstein, D., Hogg, D.W., Schlegel, D.J., Brinkmann, J., 2005, ApJ, 629,143
Brinchmann, J., Charlot, S., White, S.D.M., Tremonti, C., Kauffmann, G., Heckman, T., Brinkmann, J., 2004, MNRAS, 351, 1151
Bruzual, G., Charlot, S., 2003, MNRAS, 344, 1000
Charlot, S., Silk, J., 1994, ApJ, 432, 453
Cole, S., Aragon-Salamanca, A., Frenk, C.S., Navarro, J.F. Zepf, S., 1994, MNRAS, 271, 781
Cole, S., Lacey, C.G., Baugh, C.M., Frenk, C.S., 2000, MNRAS, 319, 168
Croton, D., 2005, MNRAS, submitted (astro-ph/0508046)
De la Fuente Marcos, R., De la Fuente Marcos, C., 2004, NewA, 9, 475
Dolphin, A.E., 2000, MNRAS, 313, 281
Dolphin, A.E., Weisz, D.R., Skillman, E.D., Holtzman, J.A., 2005, astro-ph/0506430
Faber, S.M. et al, 2005, ApJ, submitted (astro-ph/0506044)
Fall, S.M., Efstathiou, G., 1980, MNRAS, 193, 189
Forcada-Miro, M.I. & White, S.D.M., 1997, astro-ph/9712204
Fukugita, M., Ichikawa, T., Gunn, J. E., Doi, M., Shimasaku, K., & Schneider, D. P., 1996, AJ, 111, 1748
Gallazzi, A., Charlot, S., Brinchmann, J., White, S.D.M., Tremonti, C.A., 2005, MNRAS, 362, 41
Gerola, H., Seiden, P.E., Schulman, L.S., 1980, ApJ, 242, 517
Gordon, D., Gottesman, S.T., 1981, AJ, 86, 161
Granato, G.L., De Zotti, G., Silva, L., Bressan, A., Danese, L., 2004, ApJ, 600, 580
Grebel, E.K., 2001, in ”Dwarf galaxies and their environment”, Shaker Verlag, Eds. De Boer,K.,Dettmar,R.,Klein,U.. , p.45
Gunn, J. E. et al., 1998, AJ, 116, 3040
Gunn, J.E. et al. 2005, AJ, submitted
Harris, J., Zaritsky, D., 2004, AJ, 127, 1531
Heckman, T.M., Kauffmann, G., Brinchmann, J., Charlot, S., Tremonti, C., White, S.D.M., 2003, ApJ, 613, 109
Hernandez, X., Valls-Gabaud, D. Gilmore, G., 2000, MNRAS, 316, 605
Hogg, D. W., Finkbeiner, D. P., Schlegel, D. J., and Gunn, J. E., 2001, AJ, 122, 2129
Hogg, D.W. etal al, 2003, ApJ, 585, L5
Ivezic, Z.R et al, 2004, AN, 325, 583
Kauffmann, G., White, S.D.M., Guiderdoni, B., 1993, MNRAS, 264, 201
Kauffmann, G., Colberg, J., Diaferio, A., White, S.D.M., 1999, MNRAS, 307, 529
Kauffmann, G, et al, 2003a, MNRAS, 341, 33
Kauffmann, G, et al, 2003b, MNRAS, 341, 54
Kauffmann, G., White, S.D.M., Heckman, T.M., Menard, B., Brinchmann, J., Charlot, S., Tremonti,C., Brinkmann, J., 2004, MNRAS, 353, 713
Kennicutt, R.C., 1998, ApJ, 498, 181
Lequeux, J., Viallefond, F., 1980, A&A, 91, 261
Mo, H.J., Mao, S., White, S.D.M., 1998, MNRAS, 295, 319
Percival, W.J. et al, 2001, MNRAS, 327, 1297
Pier, J.R., Munn, J.A., Hindsley, R.B., Hennessy, G.S., Kent, S.M., Lupton, R.H., and Ivezic, Z. 2003, AJ, 125, 1559
Sandage, A., The Hubble Atlas of Galaxies, Washington: Carnegie Institution, 1961
Schlegel, D. J., Finkbeiner, D. P., & Davis, M., 1998, ApJ, 500, 525
Schmidt, M., 1959, ApJ, 129, 243
Searle, L., Sargent, W., 1972, ApJ, 173, 25
Searle,L, Sargent, W., Bagnuolo, W.G., 1973, ApJ, 179, 427
Seiden, P.E., Gerola, H., 1979, ApJ, 233
Shen, S. et al, 2003, MNRAS, 343, 978
Shimasaku, K. et al., 2001, AJ , 122, 1238
Skillman, E.D., Bothun, G.D., Murray, M.A., Warmels, R.H., 1987, A&A, 185, 61
Skillman, E.D., Kennicutt, R.C., 1993, ApJ, 411, 655
Smecker-Hane,T.A., Cole, A.A., Gallagher, J.S., Stetson, P.B., 2002, ApJ, 566, 239
Smith, J. A. et al., 2002, AJ, 123, 2121
Somerville, R.S., Primack, J., 1999, MNRAS, 210, 1087
Spergel, D. et al, 2003, ApJS, 148, 175
Springel, V., White, S.D.M., Tormen, G., Kauffmann, G., 2001, MNRAS, 328, 726
Springel, V. et al., 2005, Nature, 435, 629
Springel, V., Di Matteo, T., Hernquist, L., 2005, MNRAS, 361, 776
Stil, J.M., Israel, F.P., 2002, A&A, 392, 473
Stoughton, C. et al., 2002, AJ, 123, 485
Strateva, I. et al 2001, AJ, 122, 1861
Strauss, M. A. et al., 2002, AJ, 124, 1810
Tegmark, M. et al, 2004, ApJ, 606, 702
Tinsley, B., 1968, ApJ, 151, 547
Tremonti, C.A. et al, 2004, ApJ, 613, 898
Tucker, D et al, 2005, AJ, submitted
Van der Hulst, J.M., Skillman, E.D., Smith, T.R., Bothun, G.D., McGaugh, S.S., De Blok, W.J.G., 1993, AJ, 106, 548
van Dokkum, P., 2005, AJ, in press (astro-ph/0506661)
van Zee, L., Maddalena, R.J., Haynes, M.P., Hogg, D.E., Roberts, M.S., 1997, AJ, 113, 1638
van Zee, L., 2001, AJ, 121, 2003
van Zee, L., Skillman, E.D., Salzer, J.J., 1998, AJ, 111,1186
Werk, J.K., Jangren, A., Salzer, J.J., 2004, ApJ, 617, 1004
White, S.D.M., Rees, M.J., 1978, MNRAS, 183, 341
White, S.D.M., Frenk, C.S., 1991, ApJ, 379, 52
Worthey, G., Ottaviani, D.L., 1997, ApJS, 111, 377
York, D. G. et al., 2000, AJ, 120, 1579