Low-resolution VLT spectroscopy of GRBs 991216, 011211 and 021211††thanks: Based on observations collected at the European Southern Observatory, Chile; proposals no. 64.H-0313, 165.H-0464, 70.D-0523
We present low-resolution VLT spectroscopy of the afterglow of the gamma-ray bursts (GRBs) 991216, 011211 and 021211. Our spectrum of GRB 991216 is the only optical spectrum for this afterglow. It shows two probable absorption systems at and , where the highest redshift most likely reflects the distance to the host galaxy. A third system may be detected at . HST imaging of the field, obtained 4 months after the burst, has resulted in the detection of two amorphous regions of emission, one at the projected afterglow position, and the other 06 away. The spectrum shows a depression in flux in between 4000 Å and 5500 Å. This could be the result of a 2175 Å-type extinction feature in the host of GRB 991216, but at a rather red wavelength of 2360 Å. If this interpretation is correct, it is the first time the extinction feature is seen in a GRB afterglow spectrum. It is centered at a wavelength similar to that of the ultra-violet (UV) bumps inferred from observations of a few UV-strong, hydrogen-poor stars in the Galaxy. All significant absorption lines (except for one) detected in the spectrum of GRB 011211 are identified with lines originating in a single absorption system at , the redshift of the GRB 011211 host galaxy. We also detect the Ly absorption line in the host, to which we fit a neutral hydrogen column density of log (H i)=, which indicates that it is a damped Ly system. Using a curve-of-growth analysis, we estimate the Si, Fe and Al metallicity at the GRB 011211 redshift to be [Si/H]=, [Fe/H]=, and [Al/H]=. For GRB 021211, we detect a single emission line in a spectrum obtained tens of days after the burst, which we identify as [O ii] 3727 at . The corresponding unobscured [O ii] star-formation rate is 1.4 M⊙ yr-1.
Key Words.:
Gamma rays: bursts – Galaxies: abundances, distances and redshifts1 Introduction
Spectroscopy of the afterglows of long-duration Gamma-Ray Bursts (GRBs) has been essential for our understanding of the physical mechanism that produces these powerful explosions. Following the discovery of GRB afterglows (Costa et al. 1997; Van Paradijs et al. 1997), the first redshift determination by Metzger et al. (1997) provided conclusive evidence that the origin of the long-duration class of GRBs (Kouveliotou et al. 1993) is cosmological. Obviously, redshifts are required to deduce most meaningful quantities, such as the GRB energetics (Frail et al. 2001; Bloom et al. 2001; Ghirlanda et al. 2004), the brightness of any underlying supernova component (e.g. Bloom et al. 1999), and properties of the GRB host galaxies (e.g. Hogg & Fruchter 1999). So far, optical redshifts have been secured for four dozen GRBs, either through absorption-line spectroscopy of their bright early afterglow (e.g. Metzger et al. 1997), or through the detection of host-galaxy emission lines (e.g. Kulkarni et al. 1999). The average observed GRB redshift is (see Jakobsson et al. 2004a; Berger et al. 2005), with the highest being GRB 050904 at (Kawai et al. 2005).
Apart from the vital redshift, spectroscopic afterglow observations have also shown that GRB hosts are actively star-forming galaxies (e.g. Djorgovski et al. 1998; Vreeswijk et al. 2001b), that the afterglow is often situated behind a very large neutral hydrogen column (e.g. Hjorth et al. 2003a; Vreeswijk et al. 2004) with relatively high metal column densities and dust depletions compared to damped Ly systems observed along QSO sight lines (Savaglio et al. 2003; Savaglio & Fall 2004), and have provided evidence for high-velocity outflows (up to 3000 km s-1, Møller et al. 2002; Schaefer et al. 2003; Mirabal et al. 2003), presumably caused by the wind of the GRB massive-star progenitor. Finally, spectroscopic monitoring of GRB 030329/SN2003dh (Stanek et al. 2003; Hjorth et al. 2003b) has revealed a remarkable similarity with the spectral evolution of GRB 980425/SN1998bw (Galama et al. 1998; Patat et al. 2001), confirming the connection between GRBs and supernova explosions. This strongly suggests that long-duration GRBs are produced by collapsing massive stars (see Woosley 1993; MacFadyen et al. 2001).
The GRB Afterglow Collaboration at ESO (GRACE) has an on-going program at the European Southern Observatory (ESO) to perform spectroscopic observations of GRB afterglows. In this paper, we present low-resolution Very Large Telescope (VLT) spectroscopy of three GRB afterglows: 991216, 011211 and 021211. For GRB 991216 the spectroscopy is complemented by Hubble Space Telescope (HST) imaging. The organisation of this paper is as follows. After a description of the observations, data reduction and spectral analysis in Sect. 2, each GRB afterglow is presented in a separate section: GRB 991216 in Sect. 3, GRB 011211 in Sect. 4 and GRB 021211 in Sect. 5. Each of these sections starts with an introduction on the afterglow, followed by our results. We briefly conclude in Sect. 6.
-
a
Start of the first exposure.
-
b
Without order sorting filter, the second order will start to contaminate the spectrum above Å.
-
c
The resolution is approximately constant across the entire spectrum.
-
d
The first three exposures are taken without order sorting filter, followed by three with filter.
2 Observations, data reduction and spectral analysis
Table 1 shows the log of the VLT spectroscopic observations. All spectra have been reduced in the same manner within IRAF, using tasks within the kpnoslit package. After overscan subtraction and flat-fielding, the cosmic rays were removed from the images using the L.A. Cosmic routine written by Van Dokkum (2001). The spectra were then optimally extracted for each 2-dimensional (2-D) image separately, with an extraction aperture width of 2-4″. The wavelength calibration was applied, again to each spectrum separately, using an HeNeAr lamp spectrum that was taken in the morning after the science observations. The formal error in the wavelength calibration fit (order 5) was roughly 0.3 Å for the 150I grism, and 0.2 Å for the 300V grism. The individual wavelength-calibrated spectra were averaged, and the corresponding Poisson error spectra, calculated by the apall task, were quadratically averaged.
The flux calibration was performed using observations of the standard HD 49798 for both GRB 991216 and GRB 011211, and LTT 3218 for GRB 021211111see http://www.eso.org/observing/standards/spectra/. These standards were taken with a 5″ slit width during the same night as the GRB science observations. During the night of observations of GRB 991216, HD 49798 was also observed with a slit width of 1″, i.e. the same width as that of the GRB afterglow spectra. The nights that GRB 991216 and GRB 021211 were observed were probably photometric, but the night that GRB 011211 was observed was definitely not.
For the spectra of GRB 011211, we performed a correction for the slit loss, i.e. the fraction of the surface underneath the spectral profile that falls outside the slit width. The correction factor was estimated by fitting a Gaussian profile along the spatial direction (i.e. along the CCD columns) of the 2-D spectra, averaged over 4 pixels in the dispersion direction (i.e. averaging 4 columns before performing the fit). The resulting Gaussian full width at half maximum (FWHM) was then compared to the slit width to obtain the slit loss along the dispersion axis. The slit loss profile was then fit with a polynomial to correct the spectra. Note that this does not correct for any colour-dependent slit losses, but both FORS1 and 2 have a linear atmospheric dispersion compensator (LADC) in the light path, which minimises any colour-differential slit losses up to a zenith distance of 45°. However, several spectra of GRB 011211 were taken at an airmass above 1.4 (see Table 1), and therefore these are likely to suffer from such colour-differential slit losses. For the GRB 991216 spectra a slit-loss correction was not necessary, as we flux calibrated with the standard that was taken with the same slit width as the afterglow spectra. This should in principle result in a correct flux calibration, provided that the seeing was the same during the afterglow and standard star observations. This was more or less the case for GRB 991216, with a seeing of 06 during the afterglow observations, and 07 during the standard star observations. For the late-time spectra of GRB 021211, where the afterglow continuum is absent, we did not attempt a slit-loss correction.
Finally, each spectrum was corrected for Galactic extinction, assuming the from Schlegel et al. (1998). The values used are 0.626 for GRB 991216, 0.043 for GRB 011211, and 0.028 for GRB 021211. The flux calibration, slit-loss correction, and dereddening were also applied to the combined wavelength-calibrated error spectrum.
The resulting spectra were analysed within IRAF as well. The equivalent width (EW) of the significant absorption and emission lines were measured using the splot routine in IRAF. By eye, we fit the continuum with a high-order polynomial function. After normalisation, we measure the EWs with the e option. The Poisson error in the EW is calculated from the formal error spectrum calculated within IRAF, using the same pixels that were used to measure the EW. We do not include a contribution in the error from the uncertainty in the location of the continuum.
3 GRB 991216
Following the Burst And Transient Source Experiment (BATSE) -ray detection of GRB 991216 (see Kippen et al. 1999), the X-ray afterglow was discovered by the Rossi X-ray Timing Explorer (RXTE) (Takeshima et al. 1999), and the optical/infrared afterglow by Uglesich et al. (1999). The afterglow of GRB 991216 is one of a number of GRB afterglows (as e.g. GRB 990510; see Harrison et al. 1999; Pian et al. 2001) to show evidence for a “beaming” break (Rhoads 1997), suggesting that the gamma-ray, X-ray, and early optical emission was confined into jets (Halpern et al. 2000). Although the optical through X-ray data can be explained with a jet fireball model, inclusion of the radio data calls for more exotic models (Frail et al. 2000). Chandra X-ray Observatory spectral observations of the X-ray afterglow show two probable emission features (a 4.7 detection at keV, and a marginal one at keV; Piro et al. 2000), that are identified with an iron line and the recombination continuum at a redshift of . These features suggest the presence of 0.01–1 M⊙ of iron in the vicinity of the burst (Piro et al. 2000; Vietri et al. 2001). However, in an independent analysis of the same Chandra data, Sako et al. (2005) only find a fluctuation at a slightly higher energy (3.8 keV), and do not find any feature near 4.4 keV.
3.1 Absorption lines and redshift

The spectrum of the afterglow of GRB 991216 is shown in Fig. 1. The two strong features in the red part around 6900 Å and 7600 Å are caused by the earth’s atmosphere and are not intrinsic to the GRB host. The apparent lines above 9000 Å are due to bad sky subtraction. In the blue part of the spectrum, several significant absorption lines are detected. From inspection of the standard star spectrum at the same wavelengths we can conclude that the detected lines are not caused by the instrument, or by the earth’s atmosphere. The detected lines cannot be identified with typical interstellar medium (ISM) absorption features of a system at a single redshift; at least three systems need to be invoked. An alternative explanation is that the feature around 5700 Å is Ly at , and that the features shortward of it are Ly forest lines. We have simulated such a spectrum, and the lines can appear quite similar to the lines in the observed spectrum. This is a very unlikely explanation, however, since the break is much too smooth, and the continuum emission around 4000 Å is only about 10-20% lower than the level beyond the supposed break. We therefore discard the latter possibility, and are left with the most probable explanation: several absorption systems.
Table 2 lists the identification of the significant lines in the spectrum of GRB 991216. These significant lines are indicated with the short solid lines in the lower panel of Fig. 1. As the spectrum was taken with a very low-resolution grism (150I), we conservatively use 5 as the significance threshold. Typical ISM absorption lines that could be present at low significance, such as Mgi 2852, Caii K and H, and other Fe lines, are shown with a short dashed line in the lower panel of Fig. 1.
On the basis of the strongest features we infer the possible presence of three absorption-line systems along the line of sight, with the following redshifts: , and . The identification of the system in the blue part of the spectrum is strengthened by the possible detection of Caii K (3933 Å) and H (3968 Å) around 8000 Å, respectively at and . In order to increase the signal-to-noise ratio (S/N) around the possible Ca lines, we have added the blue spectrum (taken without the order sorting filter) to the red spectrum (taken with the OG590 order sorting filter), even though the blue spectrum can be contaminated by its second order above Å. This second order appears with twice the resolution and at twice the wavelength of the first order. However, if the two features around 8000 Å were due to this contamination, their first order counterparts would be located at 3976 Å and 4009 Å, where no lines are detected. The resulting combined spectrum around the Ca lines is also shown in Fig. 1, offset downward by 30 Jy from the red-only spectrum for clarity. We measure the following equivalent widths for the two features in the combined spectrum: (Caii K 3933) = () Å and (Caii H 3968) = () Å. The expected ratio of this doublet on the basis of the oscillator strengths, , is roughly two if the lines are not saturated, but can be unity if they are saturated. The observed ratio, , indicates that these lines are saturated.
A redshift of for GRB 991216 is consistent with the inferred iron line detection in the Chandra spectrum of the X-ray afterglow of GRB 991216 (Piro et al. 2000). However, we note that in an independent analysis of the Chandra data, Sako et al. (2005) find this iron line to be not significant. The system that we detect in our optical spectrum is most likely caused by the GRB 991216 host-galaxy ISM. In all cases for which both GRB absorption and emission lines have been detected, the (most distant) absorption system is at the same redshift as the emission lines from the presumed host galaxy (e.g. for GRB 980703 and GRB 021004; Djorgovski et al. 1998; Mirabal et al. 2003). Moreover, if the detection of Mgi at is real, this suggests a dense environment at this redshift, probably the ISM of the host galaxy. The probable detection of the Caii doublet supports this hypothesis, since this line is believed to require column densities that are typically an order of magnitude larger than seen in Mgii absorbers (Bowen 1991; Carilli & Van Gorkom 1992). We note that the system shows the strongest Mgii and Feii features.
3.2 The shape of the spectral continuum
The continuum flux level of optical afterglows, measured from spectroscopy or broad-band photometry, is generally well described by a single power law, with a slope of the order (with F) (for a high S/N example, see Savaglio & Fall 2004). This is consistent with the fireball afterglow theory (e.g. Sari et al. 1998). Any departure from the pure power law is usually ascribed to extinction caused by the host-galaxy ISM (see Ramaprakash et al. 1998). The flux-calibrated spectrum of GRB 991216 contains two features that distinguish it from “normal” afterglow spectra: its shallow slope ( over the range 6000-9300 Å), and an apparent depression around 4700 Å.
In order to verify our absolute flux calibration, we first compare the spectrum with the photometry of Halpern et al. (2000). Their measurements are shown in Fig. 1; the horizontal error bars represent the approximate FWHM of the filter transmission curves. In absolute terms, the spectral flux level is roughly 10% below that of the photometry; we have scaled the spectrum in Fig. 1 upward with this amount. Relatively, however, our flux calibration is in good agreement with the photometry. There are no published or photometry data to compare with. A cause for concern is that the spectrophotometric standard that was used for the GRB 991216 flux calibration, HD 49798, has not been calibrated in the optical regime with an observed spectrum, but rather with a model extension from the observed 1150-3200 Å range (see Bohlin & Lindler 1992). The same standard was also observed for GRB 011211 (see Sect. 4.1). Comparison of our GRB 011211 spectrum (see Fig. 3) with the photometry from Jakobsson et al. (2003) indicates that the absolute flux calibration of the GRB 011211 spectrum is too high by 70%. Indeed, the night when this spectrum was taken was definitely not photometric (alternating thin and thick cloud conditions). However, after scaling the spectral flux down by this 70%, the relative spectral flux calibration of our GRB 011211 spectrum is in good agreement with the photometric calibration. In the B band, the spectral flux is % higher than the photometry. If this is due to an error in the model flux calibration of HD 49798, and we were to apply a correction to the GRB 991216 spectrum based on this difference, it would only make the GRB 991216 flux depression more pronounced.
Also, during the night that the GRB 991216 afterglow spectra were taken, the standard HD 49798 was observed with a slit width of both 1″ (in long-slit mode, or LSS) and 5″ (in multi-object mode, or MOS; see the FORS manual222see http://www.eso.org/instruments/fors/ for details). This allows us to check whether the depression could be due to colour-differential, or wavelength-dependent slit losses. Flux-calibration of the GRB 991216 spectra with the 5″ standard results in an absolute offset of about 13% with the 1″-flux-calibrated spectra, with a lower flux level for the 5″-calibrated spectra. Relatively, the spectra agree to within 4%, with the depression being more pronounced in the 5″-calibrated spectra, i.e. there is no dependence on wavelength (e.g. due to colour-differential slit losses) beyond the 4% level. We note that Fig. 1 shows the 1″-calibrated spectrum. Moreover, we have also performed the flux calibration using observations of three different 5″ standards taken during three different photometric nights, up to one week before the night of the GRB. The sensitivity curves of all these standards differ by at most 8% in absolute terms (wavelength range: 4000–6000 Å) with the 5″-standard taken during the GRB 991216 night. Therefore, we regard it unlikely that the blue flux depression in the spectrum of GRB 991216 is caused by an error in the flux calibration.
Assuming that the relative flux calibration is acceptable, and that the redshift of GRB 991216 is , we investigate whether the depression in the blue part of the spectrum can be due to a redshifted 2175 Å absorption feature, as observed in the Galactic extinction curve. With this aim, we fit the Milky Way (MW) extinction curve of Pei (1992) to the regions of our spectrum void of identified absorption lines, and fixing the redshift at . We assume that the intrinsic afterglow spectrum is a single power law, to obtain the intrinsic spectral slope () and host-galaxy extinction () that best matches the observed spectrum (i.e. minimum ). For the MW we obtain the following best-fit values: , corresponding to a rest-frame V-band extinction of mag. The resulting fit is shown by the smooth solid line in Fig. 1. Fitting the red part (6000-9300 Å) of the GRB 991216 spectrum with a single power law model results in a slope of . We have also fit the Large and Small Magellanic Clouds’ (LMC and SMC) extinction curves; these are shown by the dashed (LMC) and dotted (SMC) curves in Fig. 1. These MC fits are less successful due to the 2175 Å feature being less prominent in the LMC as compared to the MW, and absent in the SMC. Although the MW fit is reasonable, the 2175 Å feature clearly does not correspond to the minimum depression in the spectrum. Placing the burst at a redshift of , or alternatively, moving the peak of the bump from 2175 Å to 2360 Å results in the best fit. This fit is shown by the dash-dotted line in Fig. 1.
Although it seems likely that some form of graphitic carbon (possibly polycyclic aromatic hydrocarbon – PAH – molecules) is responsible for the 2175 Å absorption feature in our Galaxy (Draine 2003), its exact nature is still unclear after decades of research. Observations along different Galactic sight lines have shown that although the FWHM of the 2175 Å bump can vary considerably (in our GRB 991216 fits we did not allow this width to change), the central wavelength of the bump is very stable ( Å; Fitzpatrick & Massa 1986; Draine 2003). However, in a few particular cases where the UV component of the star used to measure the interstellar extinction is strong enough to reveal extinction by grains in its own circumstellar material, a broad bump is observed with a central wavelength in between 2300 Å and 2500 Å. Abell 30 (Greenstein 1981) and HD 213985 (Buss et al. 1989) are two examples of such UV-strong, hydrogen-poor stars. It is tempting to make the connection with the UV-strong environment of a GRB, which may cause the extinction bump to be redder than 2175 Å as well. Also, laboratory experiments (see Blanco et al. 1991, 1996), aimed at testing the physical grain models proposed by Hecht (1986) and Sorrell (1990), have shown that, by decreasing the hydrogen content in carbon grains, the 2175 Å bump not only becomes more pronounced, but also shifts to higher wavelengths, up to 2600 Å (Mennella et al. 1995). Beyond the Local Group, the best case for detection of the Galactic extinction feature is a gravitational lens system, where the best-fit central wavelength of the bump is found to be only slightly larger than the Galactic value: 223424 Å (Motta et al. 2002). Therefore, the flux depression in our spectrum may have been caused by such a red extinction bump along the line-of-sight to GRB 991216.
3.3 HST imaging
The field of GRB 991216 was observed with the Space Telescope Imaging Spectograph (STIS) approximately 4 months after the burst, on 17 April 2000, starting at 11:36 UT, through the clear (50CCD) and long pass (LP) filters, each for a total of 4790 seconds. The pipeline reduced images were drizzled (see Fruchter & Hook 2002) onto output images with pixels one-half native scale, or approximately 0025 on a side. Figure 2 shows the central 55 square arcseconds of the sum of the 50CCD and LP images.
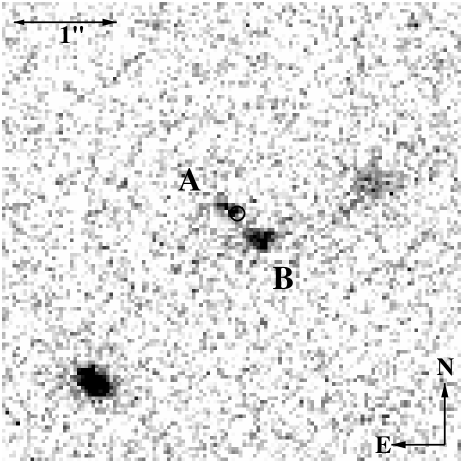
We have projected the optical afterglow (OA) position from an early VLT image, taken 1.5 days after the burst, to the frame of the HST drizzled images. Four bright nearby reference stars were used, and the estimated 1 error in the resulting position is 005, corresponding to 2 drizzled pixels. The position and its error are indicated with a circle in Fig. 2. The error circle coincides with one of two faint regions of light (A and B), which are separated by 06. The two regions are about equally bright in the 50CCD as in the LP image, showing that they have similar colours with most of the light coming out longward of 5500 Å. A and B are possibly part of the same galaxy, or they could be two systems that are interacting. Several other host galaxies also show a complex morphology, e.g. the hosts of GRBs 980613, 990123, 000926, and 011211. The likely detection of the Caii doublet at argues slightly in favour of this merger scenario, since (at low redshifts) the Caii lines are detected mainly in disrupted environments (Bowen 1991; Carilli & Van Gorkom 1992). Another possibility is that B is actually a foreground system at , corresponding to the absorption-line system detected in the VLT spectrum, and that A is the host galaxy of GRB 991216 at . The detection of emission lines from A and B would determine which of these possibilities is correct. Either one of the two other galaxies that are located roughly 2″ away from the OA position could be responsible for the tentative absorption system at . At a redshift of 0.77, 2″ corresponds to about 14 kiloparsec (assuming km s-1 Mpc-1, , and ), which is smaller than the typical galaxy halo size, and so one would indeed expect to detect Mgii in absorption.
Using an aperture radius of 02, we measured the following fluxes in photons per second in the drizzled 50CCD and LP images: for A in 50CCD, (B, 50CCD), (A, LP), and (B, LP). We also measured the total flux of A and B combined, with an aperture radius of 11: (A+B, 50CCD), and (A+B, LP). This aperture size is the same as used by Halpern et al. (2000), who obtained for the host galaxy from a Keck II image taken on 4 April 2000, i.e. about two weeks before the HST imaging reported here. To convert the HST fluxes to standard magnitudes, a spectral energy distribution has to be assumed for the source. Using synphot within IRAF, combined with the Kinney-Calzetti atlas of galaxy spectra (Calzetti et al. 1994; Kinney et al. 1996), we found that the best-fitting galaxy template is the Sc template (redshifted to ). The redshifted starburst templates also provide reasonably consistent magnitudes for both passbands and a total magnitude corresponding with the value of of Halpern and colleagues. Adopting the Sc galaxy template, the fluxes above can be converted to the following magnitudes: , and , and colours: , , and . We estimate the uncertainty in the transformation of fluxes to magnitudes to be of the order of 0.2 mag. We note that these magnitudes (including the one of Halpern et al.) and colours have not been corrected for the Galactic extinction along the GRB 991216 sight line (=2.1 and =1.7).
The transient afterglow may still be present in these observations, but the low S/N does not allow an unambiguous identification of the bright patch at the edge of the galaxy as a point source. We estimate that any remaining OA is not brighter than . Assuming the single power law decay index, , of Garnavich et al. (2000), the expected magnitude of the afterglow at the time of our observations is . Our observations therefore tend to confirm the break in the light curve reported by Halpern et al. (2000). A supernova as bright as SN1998bw at a redshift of would have at the epoch of our observations, and would thus be too faint to be detected.
4 GRB 011211
Following the BeppoSAX localisation of GRB 011211 (Gandolfi 2001; Frontera et al. 2002), the afterglow was discovered by Grav et al. (2001) (see also Jakobsson et al. 2004b), and a preliminary redshift of was reported by Fruchter et al. (2001), which was confirmed by Gladders et al. (2001). Rapid optical variability (1 hour variability time scale at 12 hours after the burst) is detected in the afterglow lightcurve; these variations could be caused by either density fluctuations in the external medium (Holland et al. 2002; Jakobsson et al. 2004b), or by a non-uniform jet structure (Jakobsson et al. 2004b). Reeves et al. (2002) obtained an XMM-Newton spectrum of the X-ray afterglow and detect transient features that they identify as Mg xi, Si xiv, S xvi, Ar xviii, and Ca xx at a redshift of , i.e. blue-shifted by about with respect to the optical redshift. The authors suggest this to be due to reprocessing of the burst flux in a shell expelled by a supernova explosion preceding the GRB by 4 days. However, Rutledge & Sako (2003) (but see Reeves et al. 2003) and Sako et al. (2005) claim that the detection of these metal lines in the X-ray spectrum is not significant. The host galaxy has , with a modest () SMC-like extinction, and the most likely afterglow model is that of a jet expanding into a constant mean density environment (Jakobsson et al. 2003). Fynbo et al. (2003) detect Ly in emission in the GRB 011211 host galaxy, extending up to 1″ to the North-North-East of the afterglow position.

4.1 Absorption lines and redshift
Figure 3 shows the spectrum of GRB 011211. As was discussed in Sect. 3.2, the night in which the GRB 011211 afterglow spectroscopy was performed was not photometric. Comparison with the photometric calibration of Jakobsson et al. (2003) shows our calibration to be off by 70%, and we have scaled the spectrum down by this amount in Fig. 3. The photometric observations of Jakobsson et al. (2003), scaled in time to the epoch of the spectrum, are shown by the open circles in Fig. 3. The horizontal error bars reflect the FWHM of the filter transmission. Relatively, the spectral and photometric flux calibration match reasonably well. Fitting a single power law to our spectrum over the range 4000–8000 Å results in a spectral slope of .
Table 3 lists the lines detected with a significance above 3 in the spectrum. The redshift as determined from the detected low-ionisation metal lines is: . Holland et al. (2002) have reported the detection of 8 metal absorption lines at a mean redshift of , in a spectrum taken with the LDSS-2 imaging spectrograph at the Magellan 6.5m telescope. Although the S/N of our spectra is superior, we are able to confirm the detection of only 4 of the lines that Holland et al. (2002) identify. Their Si iv 1368, Cr ii 1406, 1422 are misidentifications, and the line at 6875.2 Å identified as Fe iii 2189 by Holland and colleagues, is a well-known atmospheric absorption feature. Also, we clearly do not detect the broad absorption feature that they detect at 4600 Å.
4.2 The H i column density, and metallicity
Figure 4 shows the fit to the Ly line in the spectrum of GRB 011211, performed within the LYMAN context in Midas. The resulting neutral hydrogen H i column density is log (H i)=, with the line center at () Å, corresponding to a redshift of . The fit region is limited to around the core of the line, 3810–3833 Å. If this is extended to the red, the continuum around 3850 Å is very poorly fit, and to the blue of 3810 Å the Ly forest starts to contaminate the Ly line.
The H i column density in the host of GRB 011211 is at the low end of the H i GRB afterglow column densities obtained so far. Of the 7 afterglows to date for which it was possible to detect Ly in absorption at the host-galaxy redshift, 6 turn out to be damped Ly systems (see Jensen et al. 2001; Hjorth et al. 2003a; Vreeswijk et al. 2004) and therefore have log N(H i) 20.3. The host of GRB 021004 is the exception, with a column density (H i) atoms cm-2.

The low resolution of our spectrum makes it difficult to fit an absorption profile to the detected metal lines to obtain the corresponding column density and metallicity. However, we can derive a strict lower limit on these quantities by simply assuming that the lines are not saturated, even though most lines are in fact saturated. In this optically thin approximation there is a linear correspondence between the equivalent width of a line, and its column density: log log , where is the oscillator strength (see Morton 2003), and the unit of is Å. Applying this relation to the detected low-ionisation lines that are not blended, we obtain: log , log , and log . Assuming that these ions are the dominant ionisation state for the corresponding element, these column density limits can be translated to the following metallicity limits: [Si/H], [Fe/H], and [Al/H], where we have used the solar abundances from Grevesse & Sauval (1998) (see also Morton 2003), and the H i column density derived above. Neither Zn ii 2026 nor Zn ii 2062 are detected, for which we measure: Å and Å. These values correspond to the 2 column density limit: log and the metallicity limit: [Zn/H].

Taking this a step further, the abundances can be estimated through the curve-of-growth (COG) technique (see Spitzer 1978). Our COG analysis is very similar to the one that Savaglio et al. (2003) applied to three GRB host galaxies. Figure 5 shows the resulting curve of growth for the absorption lines measured in the afterglow of GRB 011211. The straight line corresponds to the linear part, where the lines are optically thin. The bent curve shows the deviation from the optically thin regime due to saturation of the absorption lines, the so-called flat part. The degree of bending depends on the amount of Doppler broadening ( in km s-1) in the medium in which the lines originate. The best fit curve is obtained by varying the column density of each element separately (i.e. sliding the data points horizontally), and finding the value for the Doppler width that fits best with the overall shape of all elements together. We have assumed a Gaussian shape for the line profiles, i.e. we have neglected damping or natural line broadening, which is important for high column density absorbers. We only use the low-ionisation lines from Table 3 which are not obviously blended, i.e. Si ii 1526, Fe ii 1608, 2344, 2382, 2586, 2600, and Al ii 1670. We also included the measurement of Fe ii 2374, even though this line is detected at the 2.5 level only; for this reason it is not listed in Table 3. Minimising , we find the following values for the Doppler width () and the Si ii, Fe ii and Al ii column densities: = km s-1, log (Si ii)=, log (Fe ii)=, and log (Al ii)=. The errors in these values are obtained by varying each parameter (while fitting the others), up to the point where the chi-squared becomes the minimum chi-squared plus one, i.e. where =+1. The full range that the parameter can adopt within this chi-squared restriction is taken as the 1 error range. These metal column densities correspond to the following metallicities: [Si/H]=, [Fe/H]=, and [Al/H]=. Again, we have made the common assumption that these low-ionisation species are the dominant ionisation states for the corresponding element.
Finally, we do not see the Ly in emission that was detected by Fynbo et al. (2003), either in the 2-dimensional spectra or in the extracted spectra. This is due to the poor S/N of our spectrum around 3800 Å.
5 GRB 021211
The High Energy Transient Explorer 2 (HETE-2) satellite detected GRB 021211 (HETE-2 trigger #2493) at 11:18:34 UT on 2002 December 11, as a bright and X-ray-rich burst (Crew et al. 2003). The optical afterglow was imaged as early as 65 seconds after the GRB (Woźniak et al. 2002), and was reported by Fox et al. (2003) to the GRB community within an hour of the burst. The afterglow was fainter than nearly all known afterglows to that date at an epoch of 1 day after the GRB (see Fig. 2 of Fox et al. 2003). Li et al. (2003) find evidence for a light-curve break at minutes, with the decay index becoming more shallow from –1.82 to –0.82, which they suggest is due to the emission before the break being dominated by the reverse shock. Panaitescu & Kumar (2004) calculate the shock microphysical parameters, and find that the reverse-forward shock scenario provides a more natural explanation than the wind-bubble scenario for the steep early decay. Finally, Della Valle et al. (2003b) present spectroscopic evidence for a supernova component in the late-time afterglow of GRB 021211.
5.1 Emission line and redshift
Our team first reported a redshift of for the putative host galaxy of GRB 021211, based on the identification of the [O ii] and [O iii] emission lines (Vreeswijk et al. 2002b). However, we later found that, due to saturation of the offset star, the slit position did in fact not cover the afterglow position (Vreeswijk et al. 2002a). Instead, the slit mostly contained the galaxy 15 to the North-East of the afterglow, first noted by McLeod et al. (2002), whose redshift is then , and which is unrelated to the GRB as shown below.
In follow-up spectroscopy of GRB 021211, we positioned the slit to cover both the position of the early afterglow and that of the galaxy at , as well as a nearby reference star. Using this reference star and the slit position angle, the exact location of both the galaxy and the projected position of the early-time afterglow on the 2-dimensional spectrum can be inferred. Figure 6 shows the spectrum extracted at the position of the early afterglow; we find one clear emission line at 7478 Å. This line most likely corresponds to [O ii] 3727 emission from the host galaxy of GRB 021211 at a redshift of (Vreeswijk et al. 2002a). This redshift was later confirmed by Della Valle et al. (2003a) who besides [O ii] also detect H 4861 and [O iii] 4959, 5007. The limited spectral coverage in the red part of our spectrum does not allow us to detect these lines. For completeness, we show in Fig. 7 the wavelength-calibrated spectrum of the galaxy that is located 15 to the North-East of the afterglow, with a redshift of .

Della Valle et al. (2003b) obtained a total of 8 hours of spectroscopy with the VLT/FORS2 and the 150I grism and OG590 filter combination, which covers the optical spectrum above 6000 Å with a resolution of 19 Å. Della Valle et al. (2003b) focus on the possible evidence for a supernova component in the late-time afterglow of GRB 021211, and briefly mention the detection of H 4861 and [O iii] 4959, 5007. Since the host-galaxy metallicity can be measured from the combination of [O ii], H 4861 and [O iii] 4959, 5007 (see Kobulnicky et al. 1999), we decided to reduce and extract these archival spectra as well. However, we are unable to detect any significant line apart from the line at 7478 Å mentioned above. This is probably due to a combination of the very low spectral resolution, which complicates the subtraction of the numerous sky emission lines in the red, and the low sensitivity around 10,000 Å, where the [O iii] and H lines are expected.
Figure 6 shows that the continuum level just redward of the significant line at 7478 Å is similar to that on the blue side, suggesting that the line is not Ly at . The most likely identification is [O ii] 3727 at a redshift of . This line is actually a doublet with components at 3727.09 Å and 3729.88 Å (vacuum wavelengths), but our spectral resolution is too low to resolve these. At a redshift of , other prominent emission lines such as H 4861, and [O iii] 4959, 5007 are not covered by our spectral range. If the significant line were H at , we would have expected to detect [OII] (at 4246 Å) and the [OIII] lines (at 5649 Å and 5705 Å) in the blue part of the spectrum, for which we do not find any evidence. And finally, if the line were [O iii] 5007 at , we would have expected to detect [O iii] 4959 (at 7406 Å) with roughly one-third of the strength of [O iii] 5007, and [O ii] at 5566 Å, even though this latter detection would have been made slightly difficult due to the presence of a strong sky line at 5577 Å. The [O ii] 3727 at identification is strengthened by the observed drop between the 8000–9000 Å continuum and that blueward of the emission line. This is consistent with the red HST colour reported by Fruchter et al. (2002), and with the possibility that this colour is caused by the 4000 Å break.

5.2 Star-formation rate
Assuming that the detected emission line indeed is [O ii], we can estimate the corresponding star-formation rate using the relation M⊙ yr-1 from Kennicutt (1998), where is in erg s-1. We measure an [OII] flux of () erg s-1 cm-2, where the error is dominated by the uncertainty in the continuum level. As the continuum level is close to zero, the measurement of the observed equivalent width is highly uncertain: = Å. At the luminosity distance of GRB 021211 of cm, the [O ii] flux corresponds to a star-formation rate of M⊙ yr-1, which is a typical value of GRB host galaxies (ranging from 0.3 to 24 M⊙ yr-1, e.g. see Table 1 of Vreeswijk et al. 2001a). We note that this value has not been corrected for host-galaxy extinction, and is therefore a strict lower limit to the actual star-formation rate.
6 Conclusions
We have determined the redshift for three GRBs: for GRB 991216, for GRB 011211 and for GRB 021211. For GRB 991216, we also find evidence for a foreground absorption system at , and possibly another at . We argue that the flux depression from 4000–5500 Å in the GRB 991216 spectrum is unlikely to be due to an error in the flux calibration, and find that it could be explained by a host-galaxy extinction bump similar to the Galactic 2175 Å feature, but at a wavelength of 2360 Å. In the Galaxy, similar extinction bumps, with a central wavelength between 2300 Å and 2500Å, have been observed toward UV-strong, hydrogen-poor stars. Fitting the Ly absorption line that we detect in the afterglow spectrum of GRB 011211, we obtain a neutral hydrogen column density of log (H i)=, indicating that it is a damped Ly (DLA) system. This is at the low end of the H i column densities detected in GRB afterglows. Using a curve-of-growth analysis, we find the following metallicity estimates at the redshift of GRB 011211: [Si/H]=, [Fe/H]=, and [Al/H]=. Assuming that the identification of [O ii] 3727 in the GRB 021211 spectrum is correct, we derive a star-formation rate of M⊙ yr-1, which is a typical value for GRB host galaxies.
Acknowledgements.
PMV thanks Thomas Szeifert for an enlightening discussion on the flux-calibration of FORS spectra. The rapid follow-up VLT spectroscopic observations discussed in this paper would not have been possible without the GRB Coordinates Network (GCN), set up by Scott Barthelmy at NASA’s GSFC. We are grateful to Jochen Greiner and the University of Texas GRBlog team led by Robert Quimby for their extremely useful GRB webpages. We acknowledge benefits from collaboration within the Research Training Network “Gamma-Ray Bursts: An Enigma and a Tool”, funded by the EU under contract HPRN-CT-2002-00294. PMV was partly supported by the NWO Spinoza grant 08-0 to E.P.J. van den Heuvel. LK has been supported by a fellowship of the Royal Academy of Arts & Sciences in the Netherlands. JG acknowledges the support of a Ramón y Cajal Fellowship from the Spanish Ministry of Education and Science. The Dark Cosmology Centre is supported by the DNRF.References
- Berger et al. (2005) Berger, E., Kulkarni, S. R., Fox, D. W., et al. 2005, ApJ, accepted, astro-ph/0505107
- Blanco et al. (1991) Blanco, A., Bussoletti, E., Colangelli, L., Fonti, S., & Stephens, J. R. 1991, ApJ, 382, L97
- Blanco et al. (1996) Blanco, A., Fonti, S., & Orofino, V. 1996, ApJ, 462, 1020
- Bloom et al. (2001) Bloom, J. S., Frail, D. A., & Sari, R. 2001, AJ, 121, 2879
- Bloom et al. (1999) Bloom, J. S., Kulkarni, S. R., Djorgovski, S. G., et al. 1999, Nature, 401, 453
- Bohlin & Lindler (1992) Bohlin, R. & Lindler, D. 1992, STSCI Newsletter, 9, 19
- Bowen (1991) Bowen, D. V. 1991, MNRAS, 251, 649
- Buss et al. (1989) Buss, R. H., Snow, T. P., & Lamers, H. J. G. L. M. 1989, ApJ, 347, 977
- Calzetti et al. (1994) Calzetti, D., Kinney, A. L., & Storchi-Bergmann, T. 1994, ApJ, 429, 582
- Carilli & Van Gorkom (1992) Carilli, C. L. & Van Gorkom, J. H. 1992, ApJ, 399, 373
- Costa et al. (1997) Costa, E., Frontera, F., Heise, J., et al. 1997, Nature, 387, 783
- Crew et al. (2003) Crew, G. B., Lamb, D. Q., Ricker, G. R., et al. 2003, ApJ, 599, 387
- Della Valle et al. (2003a) Della Valle, M., Benetti, S., Malesani, D., et al. 2003a, GCN, 1809
- Della Valle et al. (2003b) Della Valle, M., Malesani, D., Benetti, S., et al. 2003b, A&A, 406, L33
- Djorgovski et al. (1998) Djorgovski, S. G., Kulkarni, S. R., Bloom, J. S., et al. 1998, ApJ, 508, L17
- Draine (2003) Draine, B. T. 2003, ARA&A, 41, 241
- Fitzpatrick & Massa (1986) Fitzpatrick, E. L. & Massa, D. 1986, ApJ, 307, 286
- Fox et al. (2003) Fox, D. W., Price, P. A., Soderberg, A. M., et al. 2003, ApJ, 586, L5
- Frail et al. (2000) Frail, D. A., Berger, E., Galama, T., et al. 2000, ApJ, 538, L129
- Frail et al. (2001) Frail, D. A., Kulkarni, S. R., Sari, R., et al. 2001, ApJ, 562, L55
- Frontera et al. (2002) Frontera, F., Amati, L., Guidorzi, C., et al. 2002, GCN, 1215
- Fruchter et al. (2002) Fruchter, A., Levan, A., Vreeswijk, P., Holland, S. T., & Kouveliotou, C. 2002, GCN, 1781
- Fruchter et al. (2001) Fruchter, A., Vreeswijk, P., Rhoads, J., & Burud, I. 2001, GCN, 1200
- Fruchter & Hook (2002) Fruchter, A. S. & Hook, R. N. 2002, PASP, 114, 144
- Fynbo et al. (2003) Fynbo, J. P. U., Jakobsson, P., Møller, P., et al. 2003, A&A, 406, L63
- Galama et al. (1998) Galama, T. J., Vreeswijk, P. M., Van Paradijs, J., et al. 1998, Nature, 395, 670
- Gandolfi (2001) Gandolfi, G. 2001, GCN, 1188
- Garnavich et al. (2000) Garnavich, P. M., Jha, S., Pahre, M. A., et al. 2000, ApJ, 543, 61
- Ghirlanda et al. (2004) Ghirlanda, G., Ghisellini, G., & Lazzati, D. 2004, ApJ, 616, 331
- Gladders et al. (2001) Gladders, M., Holland, S., Garnavich, P. M., et al. 2001, GCN, 1209
- Grav et al. (2001) Grav, T., Hansen, M. W., Pedersen, H., et al. 2001, GCN, 1191
- Greenstein (1981) Greenstein, J. L. 1981, ApJ, 245, 124
- Grevesse & Sauval (1998) Grevesse, N. & Sauval, A. J. 1998, Space Science Reviews, 85, 161
- Halpern et al. (2000) Halpern, J. P., Uglesich, R., Mirabal, N., et al. 2000, ApJ, 543, 697
- Harrison et al. (1999) Harrison, F. A., Bloom, J. S., Frail, D. A., et al. 1999, ApJ, 523, L121
- Hecht (1986) Hecht, J. H. 1986, ApJ, 305, 817
- Hjorth et al. (2003a) Hjorth, J., Møller, P., Gorosabel, J., et al. 2003a, ApJ, 597, 699
- Hjorth et al. (2003b) Hjorth, J., Sollerman, J., Møller, P., et al. 2003b, Nature, 423, 847
- Hogg & Fruchter (1999) Hogg, D. W. & Fruchter, A. S. 1999, ApJ, 520, 54
- Holland et al. (2002) Holland, S. T., Soszyński, I., Gladders, M. D., et al. 2002, AJ, 124, 639
- Jakobsson et al. (2003) Jakobsson, P., Hjorth, J., Fynbo, J. P. U., et al. 2003, A&A, 408, 941
- Jakobsson et al. (2004a) Jakobsson, P., Hjorth, J., Fynbo, J. P. U., et al. 2004a, A&A, 427, 785
- Jakobsson et al. (2004b) Jakobsson, P., Hjorth, J., Ramirez-Ruiz, E., et al. 2004b, New Astronomy, 9, 435
- Jensen et al. (2001) Jensen, B. L., Fynbo, J. P. U., Gorosabel, J., et al. 2001, A&A, 370, 909
- Kawai et al. (2005) Kawai, N., Yamada, T., Kosugi, G., Hattori, T., & Aoki, K. 2005, GRB Circular Network, 3937
- Kennicutt (1998) Kennicutt, R. C. 1998, ARA&A, 36, 189
- Kinney et al. (1996) Kinney, A. L., Calzetti, D., Bohlin, R. C., et al. 1996, ApJ, 467, 38
- Kippen et al. (1999) Kippen, R. M., Preece, R. D., & Giblin, T. 1999, GCN, 463
- Kobulnicky et al. (1999) Kobulnicky, H. A., Kennicutt, R. C., & Pizagno, J. L. 1999, ApJ, 514, 544
- Kouveliotou et al. (1993) Kouveliotou, C., Meegan, C. A., Fishman, G. J., et al. 1993, ApJ, 413, L101
- Kulkarni et al. (1999) Kulkarni, S. R., Djorgovski, S. G., Odewahn, S. C., et al. 1999, Nature, 398, 389
- Li et al. (2003) Li, W., Filippenko, A. V., Chornock, R., & Jha, S. 2003, ApJ, 586, L9
- MacFadyen et al. (2001) MacFadyen, A. I., Woosley, S. E., & Heger, A. 2001, ApJ, 550, 410
- McLeod et al. (2002) McLeod, B., Caldwell, N., Grav, T., et al. 2002, GCN, 1750
- Mennella et al. (1995) Mennella, V., Colangeli, L., Blanco, A., et al. 1995, ApJ, 444, 288
- Metzger et al. (1997) Metzger, M. R., Djorgovski, S. G., Kulkarni, S. R., et al. 1997, Nature, 387, 878
- Mirabal et al. (2003) Mirabal, N., Halpern, J. P., Chornock, R., et al. 2003, ApJ, 595, 935
- Møller et al. (2002) Møller, P., Fynbo, J. P. U., Hjorth, J., et al. 2002, A&A, 396, L21
- Morton (2003) Morton, D. C. 2003, ApJS, 149, 205
- Motta et al. (2002) Motta, V., Mediavilla, E., Muñoz, J. A., et al. 2002, ApJ, 574, 719
- Panaitescu & Kumar (2004) Panaitescu, A. & Kumar, P. 2004, MNRAS, 353, 511
- Patat et al. (2001) Patat, F., Cappellaro, E., Danziger, J., et al. 2001, ApJ, 555, 900
- Pei (1992) Pei, Y. C. 1992, ApJ, 395, 130
- Pian et al. (2001) Pian, E., Soffitta, P., Alessi, A., et al. 2001, A&A, 372, 456
- Piro et al. (2000) Piro, L., Garmire, G., Garcia, M., et al. 2000, Science, 290, 955
- Ramaprakash et al. (1998) Ramaprakash, A. N., Kulkarni, S. R., Frail, D. A., et al. 1998, Nature, 393, 43
- Reeves et al. (2003) Reeves, J. N., Watson, D., Osborne, J. P., Pounds, K. A., & O’Brien, P. T. 2003, A&A, 403, 463
- Reeves et al. (2002) Reeves, J. N., Watson, D., Osborne, J. P., et al. 2002, Nature, 416, 512
- Rhoads (1997) Rhoads, J. E. 1997, ApJ, 487, L1
- Rutledge & Sako (2003) Rutledge, R. E. & Sako, M. 2003, MNRAS, 339, 600
- Sako et al. (2005) Sako, M., Harrison, F. A., & Rutledge, R. E. 2005, ApJ, 623, 973
- Sari et al. (1998) Sari, R., Piran, T., & Narayan, R. 1998, ApJ, 497, L17
- Savaglio & Fall (2004) Savaglio, S. & Fall, S. M. 2004, ApJ, 614, 293
- Savaglio et al. (2003) Savaglio, S., Fall, S. M., & Fiore, F. 2003, ApJ, 585, 638
- Schaefer et al. (2003) Schaefer, B. E., Gerardy, C. L., Höflich, P., et al. 2003, ApJ, 588, 387
- Schlegel et al. (1998) Schlegel, D. J., Finkbeiner, D. P., & Davis, M. 1998, ApJ, 500, 525
- Sorrell (1990) Sorrell, W. H. 1990, MNRAS, 243, 570
- Spitzer (1978) Spitzer, L. 1978, Physical processes in the interstellar medium (New York Wiley-Interscience, 1978. 333 p.)
- Stanek et al. (2003) Stanek, K. Z., Matheson, T., Garnavich, P. M., et al. 2003, ApJ, 591, L17
- Takeshima et al. (1999) Takeshima, T., Markwardt, C., Marshall, F., Giblin, T., & Kippen, R. M. 1999, 478
- Uglesich et al. (1999) Uglesich, R., Mirabal, N., Halpern, J., Kassin, S., & Novati, S. 1999, GCN, 472
- Van Dokkum (2001) Van Dokkum, P. G. 2001, PASP, 113, 1420
- Van Paradijs et al. (1997) Van Paradijs, J., Groot, P. J., Galama, T., et al. 1997, Nature, 386, 686
- Vietri et al. (2001) Vietri, M., Ghisellini, G., Lazzati, D., Fiore, F., & Stella, L. 2001, ApJ, 550, L43
- Vreeswijk et al. (2002a) Vreeswijk, P., Burud, I., Fruchter, A., & Levan, A. 2002a, GCN, 1767
- Vreeswijk et al. (2002b) Vreeswijk, P., Burud, I., Fruchter, A., & Levan, A. 2002b, GCN, 1756
- Vreeswijk et al. (2004) Vreeswijk, P. M., Ellison, S. L., Ledoux, C., et al. 2004, A&A, 419, 927
- Vreeswijk et al. (2001a) Vreeswijk, P. M., Fender, R. P., Garrett, M. A., et al. 2001a, A&A, 380, L21
- Vreeswijk et al. (2001b) Vreeswijk, P. M., Fruchter, A., Kaper, L., et al. 2001b, ApJ, 546, 672
- Woosley (1993) Woosley, S. E. 1993, ApJ, 405, 273
- Woźniak et al. (2002) Woźniak, P., Vestrand, W. T., Starr, D., et al. 2002, GCN, 1757