XMM-Newton observation of the long-period polar V1309 Ori: The case for pure blobby accretion††thanks: Based on observations obtained with XMM-Newton, an ESA science mission with instruments and contributions directly funded by ESA member states and NASA.
Using XMM-Newton we have obtained the first continuous X-ray observation covering a complete orbit of the longest period polar, V1309 Ori. The X-ray light curve is dominated by a short, bright phase interval with EPIC pn count rates reaching up to 15 cts s-1 per 30 sec resolution bin. The bright phase emission is well described by a single blackbody component with eV. The absence of a bremsstrahlung component at photon energies above 1 keV yields a flux ratio . This represents the most extreme case of a soft X-ray excess yet observed in an AM Herculis star. The bright, soft X-ray emission is subdivided into a series of individual flare events supporting the hypothesis that the soft X-ray excess in V1309 Ori is caused by accretion of dense blobs carrying the energy into sub-photospheric layers. On average, the flares have rise and fall times of 10 sec. In addition to the bright phase emission, a faint, hard X-ray component is visible throughout the binary orbit with an almost constant count rate of 0.01 cts s-1. Spectral modelling indicates that this emission originates from a complex multi-temperature plasma. At least three components of an optically thin plasma with temperatures , 0.7, and 2.9 keV are required to fit the observed flux distribution. The faint phase emission is occulted during the optical eclipse. Eclipse ingress lasts about 15–20 min and is substantially prolonged beyond nominal ingress of the white dwarf. This and the comparatively low plasma temperature provide strong evidence that the faint-phase emission is not thermal bremsstrahlung from a post-shock accretion column above the white dwarf. A large fraction of the faint-phase emission is ascribed to the spectral component with the lowest temperature and could be explained by scattering of photons from the blackbody component in the infalling material above the accretion region. The remaining hard X-ray flux could be produced in the coupling region, so far unseen in other AM Herculis systems.
Key Words.:
X-rays: binaries – stars: cataclysmic variables – accretion – stars: magnetic fields – stars: individual: V1309 Ori1 Introduction
The flux distribution of the high-energy emission from the impact regions of strongly magnetic cataclysmic variables (AM Herculis stars or polars) provides important clues on the physics of accretion onto magnetic white dwarfs. The standard model for a magnetically collimated accretion column (Lamb & Masters, 1979; King & Lasota, 1979) involves a shock standing above the white dwarf surface in which the plasma is decelerated and heated to 108 K. This model predicts parity between the hard X-ray flux from the post-shock flow and the reprocessed component from the irradiated white dwarf surface emitted as a K blackbody in the soft X-ray band. Early X-ray observations (e.g. of AM Her; Rothschild et al., 1981) revealed that such an energy balance is strongly violated with the soft X-ray component exceeding the shock emission by a factor of 10 or more. An additional strong hint against this simple reprocession model is given by the missing correlation between the short-term variability in the soft and hard X-ray bands (Stella et al., 1986; Watson et al., 1987). Theory challenged by this ’soft X-ray puzzle’ suggested that the excess emission may result from sub-photospheric energy release of dense filaments of material leading to a complete thermalisation of the accretion luminosity and to blackbody-like emission in the soft X-ray band (Kuijpers & Pringle, 1982). A detailed description of the conditions for this ’blobby’ accretion scenario by Frank et al. (1988) showed that densities larger g cm-3 are required to reach sufficient optical depths and are the natural consequence of stream segregation at large coupling radii and subsequent compression in the magnetic funnel. While blobby accretion is widely accepted as the origin of the soft X-ray excess, other concurrent processes may affect the observed energy distribution in polars. These include re-emission of hard X-ray photons in the UV (Heise & Verbunt, 1988; Gänsicke et al., 1995), or a deficiency of hard X-ray emission due to the dominance of cyclotron cooling over thermal bremsstrahlung in high-field, low-density environments (Woelk & Beuermann, 1996). The physics of the blob impact itself and its effects on the white dwarf atmosphere is largely unexplored. The best approach to the problem so far is restricted to the treatment of a stationary heatflow problem (Litchfield & King, 1990).
Observationally, the soft X-ray excess has been firmly established for a large number of polars using ROSAT PSPC observations (Beuermann & Burwitz, 1995; Ramsay et al., 1994), where also a strong correlation with the magnetic field strength in the accretion region was found. Recently, the status of the energy balance has been critically reconsidered by Ramsay & Cropper (2004) on the basis of a re-analysis of ROSAT PSPC data and a snap-shot survey of 22 polars observed with XMM-Newton in high states of accretion. They question the existence of a soft X-ray excess for the majority of systems and find that high instantaneous accretion rates lead to high soft-to-hard X-ray flux ratios. This is in line with the behaviour of polars observed at very low accretion rates (Ramsay et al., 2004) whose spectra do not show any distinct soft component.
The eclipsing polar V1309 Ori is one of the most peculiar AM Herculis stars. With an orbital period of hrs, almost twice as long as any other system, it is a key object for understanding the evolution and synchronisation of magnetic CVs (Frank et al., 1995). Another puzzling aspect concerns the dominance of emission from the accretion stream at infra-red, optical and UV bands (Shafter et al., 1995) cyclotron radiation from the accretion shock provides the main contribution. Diagnostics of the accretion processes in V1309 Ori are therefore restricted to X-ray observations. The most longest pointing with ROSAT (Walter et al., 1995) revealed that V1309 Ori is a strongly flaring X-ray source with a very soft spectrum. In this paper we present the first continuous, whole orbit X-ray observation of V1309 Ori.
2 Observations and reduction
V1309 Ori was target of a pointed XMM-Newton observation during revolution #233 starting on March 18, 2001. Our analysis focuses on data from the European Photon Counting Cameras (EPIC) which were all operated with a thin filter. With a total exposure time of 29.1 ksec the observations with the two MOS detectors covered just one complete cycle of V1309 Ori, while the shorter pn exposure (on-time 26.4 ksec) missed 9% of the orbit just prior to eclipse ingress. The counting statistics of the RGS instruments were too low, and we dismissed those spectra from further analysis. Data were processed with version 5.3.1 of the XMM-Newton Science Analysis Software (SAS). Source photons were extracted within apertures of 45″ and 30″ radius around the position of V1309 Ori for the pn and MOS data, respectively. The background which was at a low and constant level during the pointing was determined from a source free area close to the target. For spectral analysis within XSPEC, only single and double events were used together with the appropriate response files pn_ff20_sdY9 and m[1,2]1_r7_im_all_2000-11-09. For the pn detector, operated in full window mode, the fitting procedure was complicated by photon pile-up for count rates exceeding 5 cts s-1. We tried to minimise these effects by selecting only photons from either low count rate intervals or an outer annulus of the PSF.
In order to improve the counting statistics and to provide a compact display, we constructed combined light curves from all EPIC instruments with the count rates of the two MOS CCDs normalised to the level of the pn detector. EPIC photon timings given in the time frame of terrestrial time (TT) have been converted to the barycenter of the Sun. We have adopted the orbital ephemeris of Staude et al. (2001), which uses the mid-eclipse of the white dwarf as zero-point. The corresponding value in the time frame of barycentric Julian ephemeris days (BJED) has been corrected for a typing error and the appropriate number of leap seconds.
Simultaneously to the X-ray observations, V1309 Ori was observed with the
optical monitor (OM) in the UVW2 (1800-2400 Å) band. The OM was
operated in image mode resulting in sec
integrations. We applied aperture photometry to the images provided by
the michain } task t derive background subtracted count
rates of the source. These were converted to flux units using the conversion factor erg cm-2 s-1 Å-1 cts-1
given in the XMM-Newton documentation.
We also included in our analysis 34 ksec of largely unpublished ROSAT data taken between 1991 and 1996 with the PSPC and HRI instruments. These observations were spread into small blocks separated by days or weeks, which cover only small fractions of the orbit at a given epoch. Photon event files have been taken from the ROSAT archive and standard corrections (vignetting, dead-time) have been applied using the EXSAS software package (Zimmermann et al., 1994). For comparison with the PSPC data, HRI count rates have been multiplied with a factor of 6.
3 X-ray and UV light curve
3.1 Flare phase
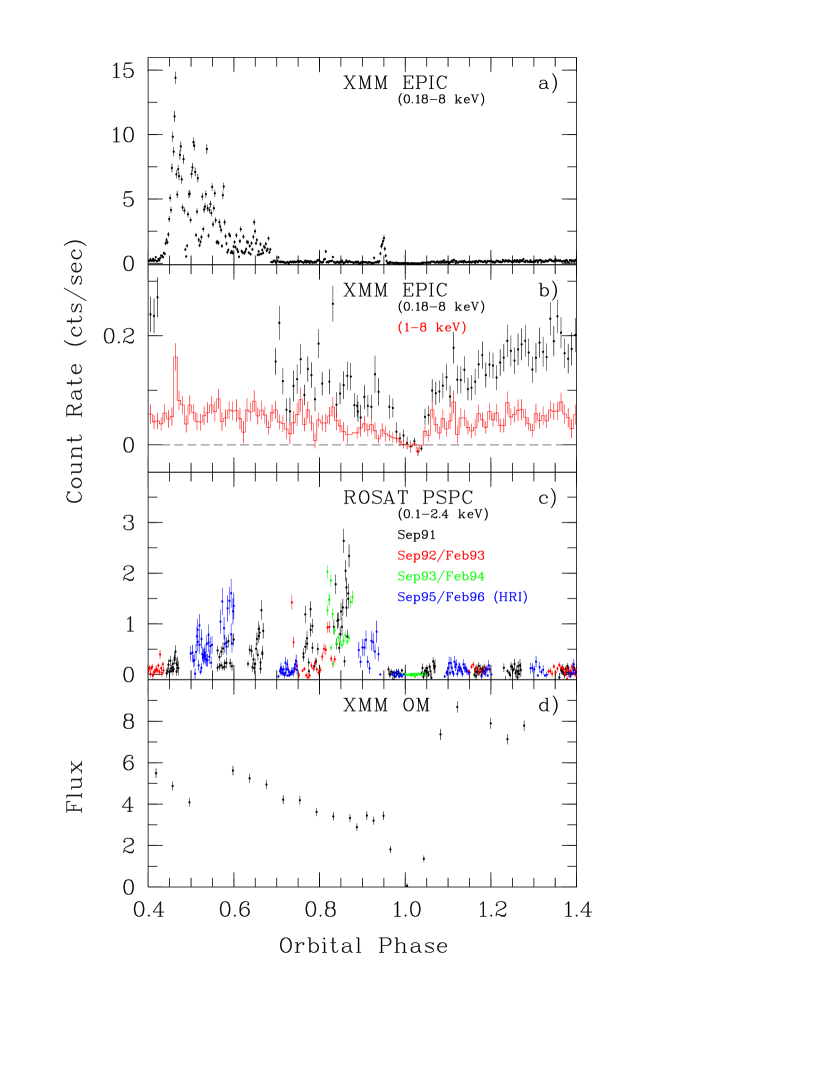
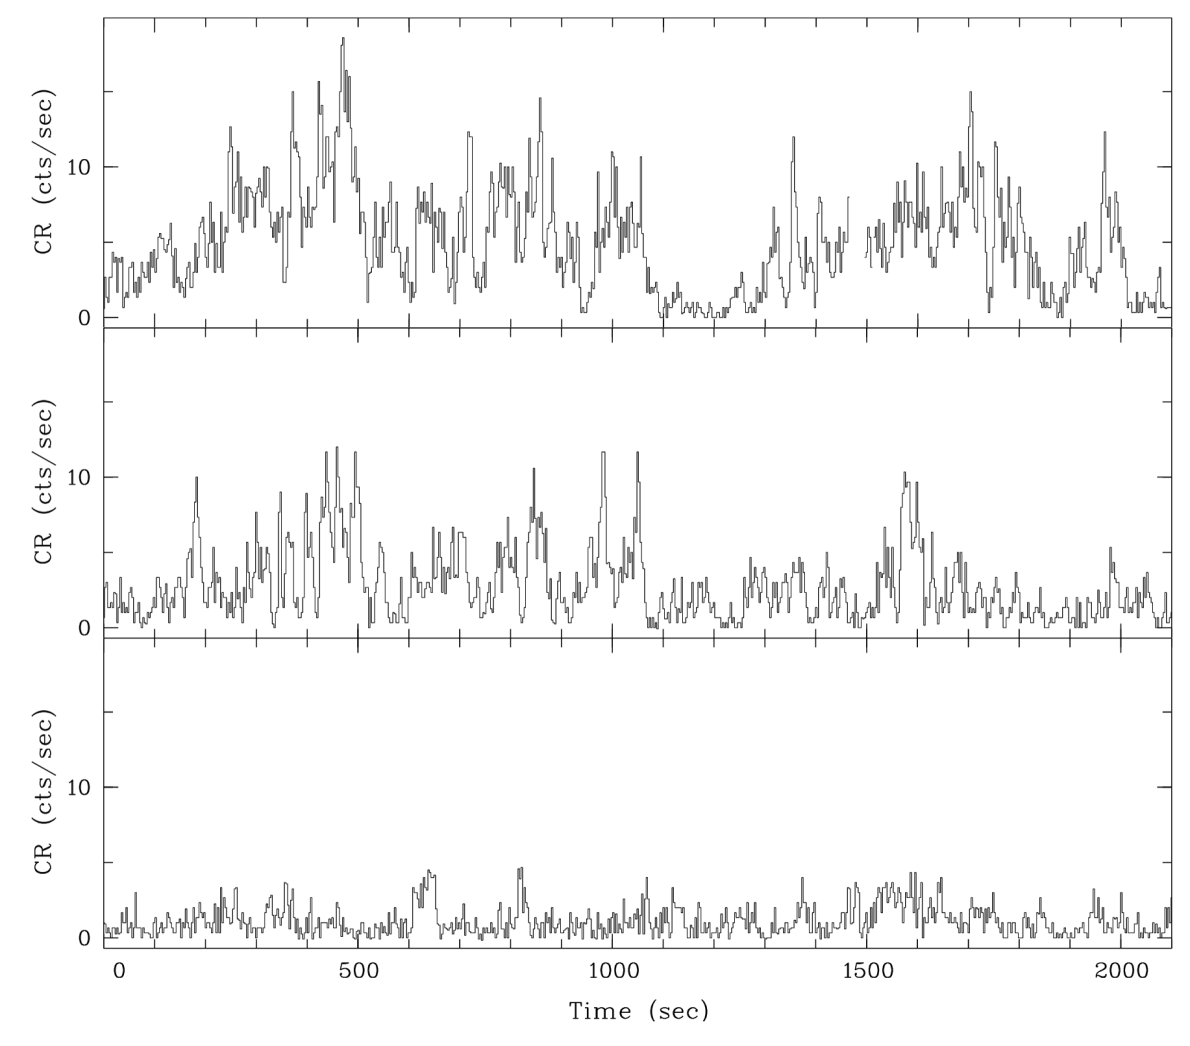
In Fig. 1a we show the XMM-Newton EPIC light curve folded over the orbital ephemeris and binned at a resolution of 30 sec. The most prominent feature is a short, bright interval at = 0.41–0.68 with peak count rates reaching 15 cts/sec (or 25 cts/sec at a binning of 3 sec). At higher temporal resolution (Fig. 2) most of the bright phase flux can be resolved into individual flares. The frequency and intensity of the flares strongly varies with the largest flares seen shortly after onset of the bright phase and a smoothly declining intensity thereafter.
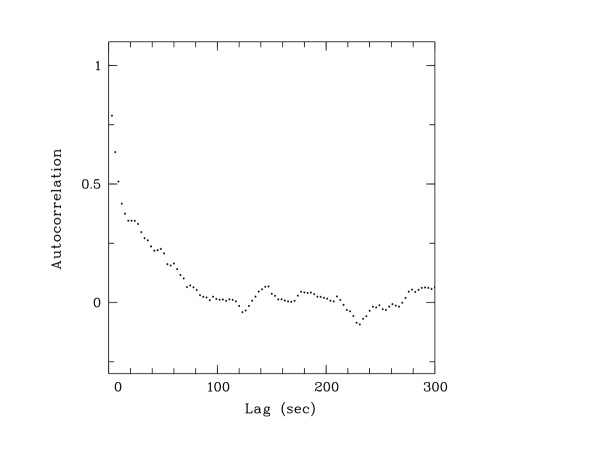
Most of the individual flares are well-separated with average rise and decay times of 10 sec. This time-scale corresponds to the first part of the auto-correlation function which steeply falls off with an e-folding time of 7 s (Fig. 3). The correlations remain positive for larger lags up to the zero-crossing time of s, which is interpreted as the average time between two consecutive flares. For a dozen well isolated flares we measured the integrated fluxes as well as the corresponding peak flux. This sample includes a characteristic set of faint and bright events ranging between erg cm-2 and erg cm-2 s-1 and should be representative for the majority of flares seen in Fig .2.
Perhaps the greatest surprise are the spectral properties of the flaring emission best seen in the hard X-ray light curve taken in the 1–8 keV band (Fig. 1b). While a constant source of faint, hard X-ray flux (see Sect. 3.2) is observed at all phases apart from the eclipse, there are no X-ray photons with energies larger than 1 keV that can be uniquely attributed to the soft X-ray flares. We derive an upper limit for the hard X-ray flux from the flares using the counting statistics of the residual faint flux. In the bright-phase interval 0.43–0.6, 650 source and background photons with energies keV have been detected. This corresponds to a detection limit of 25 photons or 0.0033 cts/s for the hard X-ray count rate related to the soft X-ray flares. A similar conclusion is reached if we assume that the 25 photons from the hard mini-flare observed at = 0.46 are associated with a soft flare event. Assuming a bremsstrahlung spectrum with = 20 keV the upper limit to the count rate is translated into a bolometric flux limit erg cm-2 s-1 . We also supply the equivalent value for the ROSAT band erg cm-2 s-1 to aid comparison with the studies of Beuermann & Burwitz (1995).
A few isolated soft flare events are observed outside the bright-phase interval. For example, there is a series of six mini-flares seen shortly prior to the eclipse at = 0.94 for a duration of 400 sec. The highly instationary nature of the accretion process makes it difficult to clearly differentiate between geometrical aspects and instantaneous variations of the mass transfer rate. The smooth UV light curve indicates that V1309 Ori was permanently accreting at a high rate and we conclude that the entire bright interval was not due to an isolated, long-lasting accretion event. Assuming that the duration and the center of the bright phase reflect the geometrical constraints on the visibility of the accretion region, would imply an unusual location of this region at an azimuth and a colatitude (see discussion in Sect. 5.5).
Additional information on the duration and the center of the phase interval during which strong flares occur is provided by various ROSAT light curves (Fig.1c) of V1309 Ori obtained from pointed observations at different epochs. Compared to the XMM-Newton pointing, flare intervals are distributed over a larger phase range 0.45–0.87 and shifted towards phase zero. The brightest episodes are observed around , i.e. in the faint-phase interval of the XMM-Newton observation indicating a possible migration of the accretion spot. The general occurrence of the bright intervals is consistent with an accretion region located at an azimuth and at a colatitude . All available ROSAT and XMM-Newton data agree that flares do not occur in the post-eclipse interval, 0.05–0.45.
3.2 Faint phase and eclipse profile
Throughout the orbit we detect a persistent, faint (0.1cts s-1) source of emission (Fig. 1b). The spectrum of this emission is significantly harder than the spectrum of the flaring component and about 50% of all photons are detected at energies greater than 1 keV.
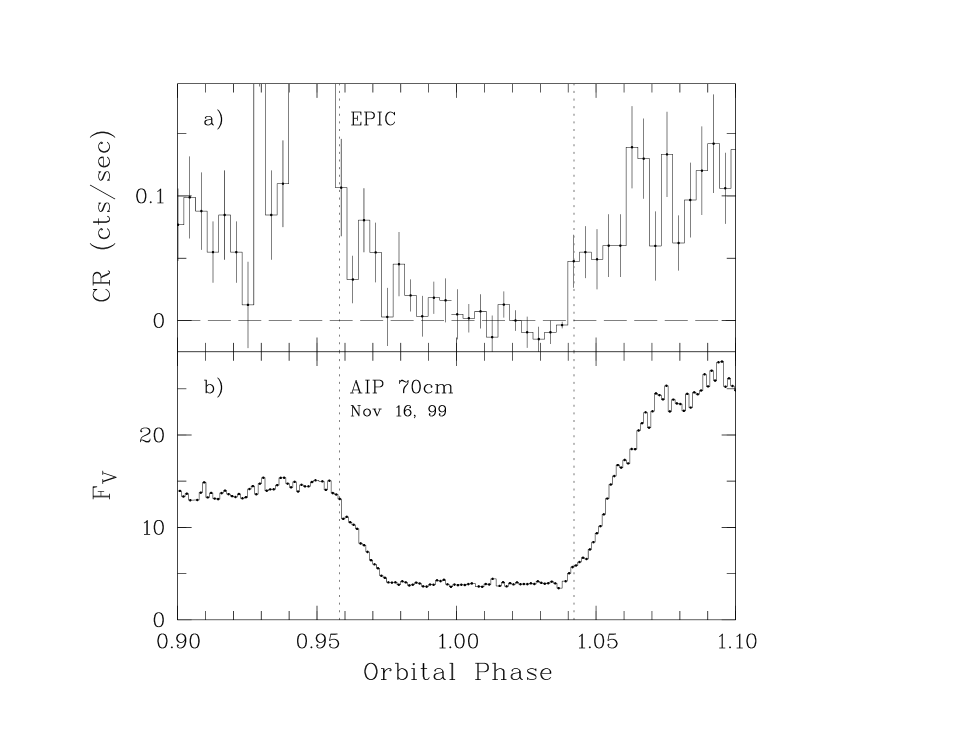
During the eclipse by the secondary star the source of the faint emission is occulted (Fig. 4). The beginning of X-ray ingress coincides with that of the white dwarf observed at in the UV (Staude et al., 2001; Schmidt & Stockman, 2001). Surprisingly, the ingress is prolonged to phases beyond the geometrical occultation of the white dwarf. In total, a significant excess emission of photons has been detected during the eclipse above the background level of one photon. A rough estimate of the spectral characteristics of the ingress flux can be made from the ratio of photons above and below 1 keV which is 0.5. From spectral analysis (Sect. 4.2) we find a similar value 0.36 for the intermediate temperature (0.7 keV) component of the faint emission.
The estimated egress duration of 15–20 minutes is much longer than 45 sec expected for the occultation of an 0.7 white dwarf, and is difficult to reconcile with a compact emission region. A similar, corresponding behaviour for eclipse egress is hard to confirm, due to the low counting statistics and the intrinsic variability of the source.
3.3 The UV light curve
The UV light curve shown in Fig. 1d is similar to the optical light curves (Shafter et al., 1995) with a primary maximum around and a secondary brightening at phase . Such asymmetric double-humped shape is interpreted as the result of the changing projection of the accretion flow. During the rise of the X-ray bright phase the UV flux is actually decreasing, indicating that the accretion spot itself contributes only a minor fraction in the UV range. With the sparse sampling, eclipse ingress and egress are not resolved. For the single OM exposure centred at 0, the eclipse is total. The flux levels before and after eclipse are comparable to that of an HST FOS observation of V1309 Ori taken in 1996 (Staude et al., 2001). We conclude, therefore, that V1309 Ori was in a normal high state of accretion during the XMM-Newton observation.
4 X-ray spectroscopy
4.1 Flare phase
| Data | Model | ||||||||
|---|---|---|---|---|---|---|---|---|---|
| (1020 cm-2) | (eV) | (eV) | (keV) | (keV) | |||||
| Faint phase | |||||||||
| pn | bb+br | 32 | – | 1.2 | – | – | 1.4 | ||
| pn | bb+mek | 68 | – | 1.1 | – | – | 1.8 | ||
| pn | 2mek | – | 2.7 | – | – | 1.7 | |||
| pn | 3mek | – | 0.7 | 2.9 | 0.96 | ||||
| pn | cmekal | – | – | – | 7.1 | 0.7 | 3.1 | ||
| pn | bb+cmekal | 47 | – | – | 5.5 | 1.0 | 0.86 | ||
| Bright phase | |||||||||
| MOS1 | bb+3mek | 8.10.3 | 42 | 65⋆ | 0.7⋆ | 2.9⋆ | – | 0.87 | |
| MOS2 | bb+3mek | 6.00.3 | 42 | 65⋆ | 0.7⋆ | 2.9⋆ | – | 0.97 | |
| pn (outer psf) | bb+3mek | 5.00.2 | 46 | 65⋆ | 0.7⋆ | 2.9⋆ | – | 0.86 | |
| pn (CR s-1) | bb+3mek | 3.70.7 | 44 | 65⋆ | 0.7⋆ | 2.9⋆ | – | 1.04 |
⋆ These parameters were fixed.
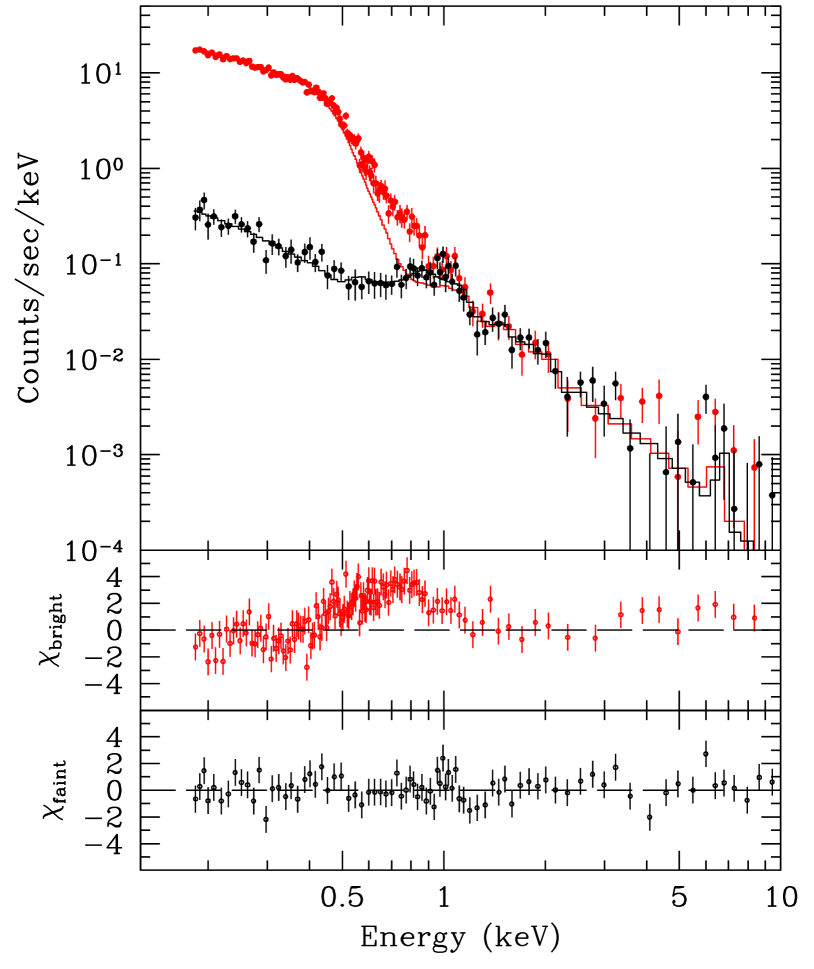
The spectrum of the X-ray emission seen in the flaring phase can be adequately fitted by a single blackbody and an extra component representing the unrelated hard X-ray emission (Fig. 5). For the latter we have adopted the 3-temperature mekal model determined in Sect. 4.2 with fixed best-fit parameters. The blackbody temperatures derived from the data of the two MOS CCDs, eV, and from the pile-up free pn spectrum, eV, agree within the error bars (Table 1). The temperature is comparable with values observed in other polars with a pronounced blackbody component, which roughly cover the range of 20–60 eV. The hydrogen column density of 1020 cm-2 towards V1309 Ori is in agreement with previous ROSAT and BeppoSAX measurements (Beuermann & Burwitz, 1995; El Kholy, 2004; de Martino et al., 1998) and slightly lower than the total interstellar galactic column of 1021cm-2 in this direction. The remaining uncertainties in and imply a corresponding uncertainty in the unabsorbed bolometric soft X-ray flux , which averages erg cm-2 s-1 for the two MOS CCDs and erg cm-2 s-1 for the pn. In addition to calibration issues of the low energy detector response, the pn flux may still be somewhat influenced by the photon pile-up and we will adopt the MOS flux for later considerations.
We have searched for possible changes of the blackbody temperature as a function of count rate. Bright phase X-ray spectra selected for intervals with count rates lower or higher than 5 cts sec-1 have indeed different parameters, but these variations are only significant at the 3 level and not consistent between the different detectors. For the MOS1 and the pn CCD, the low count rate spectra have lower temperatures of 35 and 42 eV, respectively, compared with 45 eV for the bright flare measurements with all instruments. The fits of the MOS2 data on the other hand differ only in the hydrogen column density.
4.2 Faint phase
The faint phase spectrum was extracted for phase ranges 0.03–0.41 and 0.68–0.97 carefully
excluding the eclipse interval as well as a few intermittent
flares. Since the signal-to-noise ratio of the MOS faint phase
spectra was too low to constrain different models only the pn data
were considered further. The spectrum shown in Fig. 5 is
much flatter and harder compared with that of the bright phase,
and can not be fitted by (i) a single blackbody,
(ii) a single temperature optically thin thermal emitter, and
(iii) a combination of both.
The spectral shape rather suggests an optically thin plasma
emitter with a range of comparatively low temperatures. A good fit was
obtained with Mewe models
(ekal }, \citealt{ewe85) with temperatures ,
0.7, and 2.9 keV, yielding
. The total bolometric flux of the
faint emission is erg cm-2 s-1 ,
with the largest fraction ( 90%) coming from the component with
the lowest temperature. Since the emission measure in the cooling
flow of a bremsstrahlung-dominated plasma shock-heated to varies approximately as it is obvious that the
parameter set for a single cooling flow can not match the
observation. Attempts to fit the faint-phase emission with the
multi-temperature model (mekal }, \itealtDone98), in which
the emission measure for a given temperature is scaled by the
expression , were in fact unsuccessful
( for any possible combination of and .
The residuals for this model are confined to energies below 0.5 keV, indicating the presence of an independent low temperature component. Adding a blackbody component to the
mekal } {\iii model yields an
a
ceptable fit , but also an optically thin
thermal model cannot be excluded. The temperature of the blackbody
is eV and agrees within the errors with that of the primary soft
bright phase emission.
5 Discussion
5.1 The accretion rate of V1309 Ori
The bolometric time-averaged bright-phase luminosity of the flare emission is erg s-1 calculated for a distance of 625 pc111We update the distance estimate by Staude et al. (2001) using the more accurate Hipparcos distance of the comparison star YY Gem.. With , this luminosity refers to the emission received from a plane surface element viewed face-on. If the plane surface element is located at co-latitude in a system seen at inclination , C=1/cos at the best visibility of the element and larger if closer to the limb of the star. With and (Staude et al., 2001), a correction by a factor as large as would be required. There is evidence, however, from various studies that the blackbody emission arises from thermally or dynamically elevated mounds of hot photospheric matter rising up to a couple of percent of the white dwarf radius (Schwope et al., 2001). In their early study, Heise et al. (1985) noted that the individual (and transient) mounds are about as high as wide. As a compromise, we use a factor , which corresponds to isotropic emission into the half sphere. The soft X-ray blackbody luminosity then is . Neglecting, for simplicity, any additional contribution to the accretion luminosity, e.g., from cyclotron radiation, corresponds to a time-averaged accretion rate . Assuming a standard white dwarf of mass and radius cm, we obtain yr-1. For , yr-1, comparable to the yr-1 estimated by Beuermann & Burwitz (1995) from the ROSAT All-Sky-Survey observation of V1309 Ori if one corrects for their lower (assumed) value of . It is also close to the yr-1 derived by El Kholy (2004) from the ROSAT pointed observation. Our value of , however, falls substantially below the rates which seem to be typical of dwarf novae and novalike variables as estimated by Patterson (1984) and implied by the effective temperatures of accreting white dwarfs if interpreted in terms of compressional heating (Araujo-Betancor et al., 2005; Townsley & Bildsten, 2004). This seems to support the notion that long-period polars have lower accretion rates than other CVs (Araujo-Betancor et al., 2005).
5.2 The case for pure blobby accretion
Our XMM -Newton observation revealed V1309 Ori as extreme among polars in its dominance of soft over hard X-ray emission. From the bolometric flux of the soft X-ray blackbody and the upper limit to the bremsstrahlung flux (Sect. 3.1) we derive a lower limit to the soft-to-hard bolometric X-ray flux ratio, . An even larger value, , is obtained if the fluxes are restricted to the ROSAT band (Beuermann & Burwitz, 1995). No other polar shows such a weak hard X-ray component. The best explanation for the lack of hard X-ray emission in polars is the accretion of blobs, or rather field-aligned filaments, of matter which penetrate to sub-photospheric layers releasing their energy in shocks which are entirely submerged in the photosphere (Kuijpers & Pringle, 1982; Frank et al., 1988; Beuermann, 2004). Shock heating of the infalling matter can not be avoided in the super-sonic flow, but burying of the shock and complete thermalization can render the hard X-rays undetectable.
As noted already by Walter et al. (1995), the soft X-ray emission in V1309 Ori consists of individually identifyable flares. The spectral properties of V1309 Ori suggest a high density of the infalling matter and the temporal structure of the emission suggests the infall of blobs or filaments of matter. The detection of individual flares provides the opportunity to estimate the physical parameters of these filaments. While several causes may be responsible for the high density of the matter, an obvious one is the compression of the filaments perpendicular to the field as , with the radial distance (Beuermann et al., 1987). The surface field strength in the accretion spot has been measured by Shafter et al. (1995) and Schmidt (2004) from the spacing of the, admittedly weak, cyclotron harmonics, yielding MG.
The stagnation radius obtained by equating the pressure of the equatorial magnetic field and the free-fall ram pressure of the accretion stream expressed in units of the white dwarf radius is
(Beuermann et al., 1987), where , , and are the polar field strength, the electron density near the stagnation point, and the radius of the white dwarf in units of G, cm-3, and cm, respectively. Starting from a typical electron density in the threading region 0.1–10 we obtain 10–24 for MG and a white dwarf of 0.7 . The pre-shock density at the white dwarf is a factor of 300–2800 times higher and the mass density becomes g cm-3. The specific accretion rate then is 28–280 g cm-2s-1. This is much higher than the value g cm-2s-1 (Beuermann, 2004, his Fig. 4), at which the shock is depressed to the level of the photosphere. Hence, we expect the shocks associated with the infall of the flare-producing blobs in V1309 Ori to be deeply buried in the atmosphere of the white dwarf.
In addition, the production of hard X-rays from the low density part of the -distribution is diminished by the dominance of cyclotron emission over thermal bremsstrahlung as the primary coolant in a high field plasma (Woelk & Beuermann, 1996), like in V1309 Ori. Furthermore, the viewing geometry towards moderately buried shocks may play a role. Reprocessing of hard X-rays occurs already for moderate suppression of the shock if the accretion spot is located sufficiently close to the limb of the star. For a geometry as in V1309 Ori with a minimum viewing angle the actual path length through atmospheric matter will exceed that for a face-on view by a large factor and shield shocks that would be directly visible in a face-on view (Frank et al., 1988; Beuermann, 2004). Another constraining parameter is the number of blobs simultaneously impinging on the white dwarf. The visibility of shocks will also be influenced by the interaction of the individual impact spots and the splashes caused by them, an effect which increases with the number N of such impact regions present simultaneously. The structured X-ray light curve of V1309 Ori suggests that this number is small, of the order of unity, and certainly less than estimated for AM Her by Hameury & King (1988).
Several complications may disturb the simple picture presented above. E.g., the density in the threading region at the start of the quasi-free fall may vary between different objects because it depends on the balance between cooling and heating experienced by the matter in the accretion flow, processes which are difficult to assess observationally and theoretically. Break-up of the stream into separate blobs may occur already near the inner Lagrangian point or be effected by instabilities in the magnetosphere (Hameury et al., 1986). As a tendency, we presume that the extended path lengths in the long-period system V1309 Ori favour cooling and higher densities.
While the ratio tends to increase with the magnetic field strength (Beuermann & Schwope, 1994; Ramsay et al., 1994), there is no simple one-to-one relationship. In the polar sample studied during the ROSAT All-Sky-Survey, the highest ratios are observed for systems with a field strength similar to that of V1309 Ori (Beuermann & Burwitz, 1995). There are some exceptions, however, suggesting that compression in the magnetic field is not sufficient to suppress all hard X-ray emission. The complex observational relation between and is most easily explained if there are sources of keV X-rays which are not associated with buried shocks. Such source is present also in V1309 Ori and is addressed in the Section 5.4.
In summary, we consider it plausible that a number of reasons combine to cause the observed dominance of soft X-rays observed in V1309 Ori.
5.3 Blob properties
In contrast to many other polars, the number of simultaneously impacting filaments is small and a large fraction of the soft X-ray flares can be individually resolved, thus providing imminent clues on the temporal behaviour and the impact energetics. On average, the flare profiles are symmetric with rise and decay times of about 10 sec. The lack of obvious temperature changes throughout individual bursts suggests that the intensity profile of the flare is determined by a corresponding profile of the local mass flow rate per unit area and instantaneous thermalization. A finite cooling time of the heated surface elements is not discernible in the data. The individual flares in V1309 Ori release energies in the range of erg, which we estimate using a distance of 625 pc and a geometry factor of . For a white dwarf of 0.7, this range of energies corresponds to a range of blob masses g.
At flare maximum, the blackbody emitting areas computed from
are typically in the range of cm2. With a typical flare duration sec, the characteristic length of an accreted filament is cm. Combined with the emitting area , we deduce an upper limit for the volume of the infalling filament of , where the limit derives from the fact that the area over which accretion occurs since the heat flow will spread sideways from the column. For a typical flare produced by a blob mass g, the lower limit on the density of the infalling matter before shock compression is
which translates into a specific accretion rate
about two orders of magnitude higher than the at which the shock is depressed to the level of the photosphere (Beuermann 2004). Hence, the hard X-ray emission region is likely to be completely engulfed by atmospheric and infalling matter and hard X-rays are suppressed at practically any viewing angle. This limit on of the flare-producing accretion events compares favourably with the value estimated above from the density in the threading region and the compression in the magnetic funnel.
5.4 Origin of the faint-phase emission
Besides the blackbody-like soft X-ray component visible only during the flares, significant excess emission is detected at energies up to 3 keV during almost all orbital phases. The spectral and temporal behaviour of this faint-phase emission is complex and atypical of the hard X-ray emission which is seen from other magnetic CVs and usually attributed to bremsstrahlung from the accretion shock. The shock temperature is expected to be (Aizu, 1973)
where is the unit mass and for solar composition has been used. The absence of a bremsstrahlung component with 20 keV is compliant with our finding that in V1309 Ori the shocks in the accretion plasma are deeply buried in the white dwarf photosphere and a different origin is required for the two components distinguishable in the faint-phase emission.
1) Soft component: The softest part with plasma temperature eV comprises the largest fraction of the bolometric flux of the faint-phase emission. In contrast to the hard X-ray flux, this component shows an orbital modulation with increasing flux towards the bright phase. The similar temperature and orbital variations of the soft component and the flaring component suggest that both have a similar origin from the primary accretion region. Scattering and reflection of soft X-rays in the accretion column above the impact site is a viable mechanism that could explain the basic spectral and temporal properties of the soft component in the faint phase. For any accretion geometry it can not be avoided that part of the photons from the blackbody-like soft X-ray component are scattered in the infalling material. As this material extends to several white dwarf radii, scattered X-ray photons will still be visible when the accretion region itself is occulted by the white dwarf. Scattered emission is largely outshone in systems which show a strong bremsstrahlung component and it is, therefore, not surprising to find such a component specifically in V1309 Ori.
2) Hard component: About 10% of the bolometric flux of the faint-phase emission arises from an additional hard X-ray component with 1–3 keV showing no significant orbital variation besides a gradual decrease during the eclipse by the secondary star. Ingress appears to be prolonged after the nominal eclipse of the white dwarf. The estimated duration of the ingress is 15–20 minutes and corresponds to a linear extent of cm or 40 at the location of the white dwarf. The comparably low plasma temperature and the large geometrical extension of this emission component provide strong arguments against an origin from a compact accretion region.
A possible source for the observed emission could be plasma heated by shocks in the coupling region where the ballistic stream is captured by the magnetic field. At the typical coupling radius of 10–30 the kinetic energy of the free-falling material amounts to 3-10 % of the total gravitational energy and a certain, but yet unknown fraction of this energy is likely to be dissipated at that point. If a shock arises at 10–30 , a shock temperature in the range 0.9–2.8 keV is expected in agreement with our X-ray spectroscopy. The bolometric luminosity of the hard component is erg s-1 for a distance of 625 pc and a geometry factor of . For a mass accretion rate yr-1, an accretion luminosity in the range of (1.3–4.0) erg s-1 is expected at a radial distance 10–30 , demonstrating that there is no energy problem in providing the observed faint-phase X-rays.
5.5 Accretion geometry
Modelling of low level variations of the optical circular polarisation indicates a two-pole geometry (Buckley & Shafter, 1995; Katajainen et al., 2003) with the two poles located at and . Because of the strong stream emission, however, the polarised emission is faint and conclusions on the accretion geometry should be considered with some caution.
Our X-ray observations provide some additional insight. The flaring soft X-ray emission seen between phases 0.4 and 0.95 in the ROSAT and XMM data are in general agreement with the azimuth of the second optical spot. The large variation of the phase intervals during which soft X-ray emission is seen at different epochs indicates either real changes of the accretion geometry or fluctuations in . The latter possibility is supported by small scale flaring which continues between phases 0.7 and 0.95 during the XMM-Newton pointing. If on the other hand, the XMM-Newton bright phase between 0.41–0.68 indicates the location of the X-ray emitting region then its position would be quite peculiar. The centre of this bright interval would be consistent with a spot at an azimuth which is almost antipodal to the direction towards the secondary star (). Only the polar HY Eri (Burwitz et al., 1999) has a main accretion region at such extreme position, whereas the primary accretion pole seems to be generally confined in the range (Cropper, 1988).
Because of the pronounced time variability a final conclusion cannot be drawn. The second optically derived accretion spot, , is visible after the eclipse during orbital phases 0.05–0.39. In principle, this pole could be responsible for the post-eclipse faint-phase X-ray emission. The spectral properties of this component do not correspond to the known characteristics of shock emission, however. We consider, therefore, the scattering scenario described above as more likely and conclude that the second optical pole is not seen in X-rays.
6 Conclusions
Our XMM-Newton and ROSAT observations of V1309 Ori have revealed the most extreme example of a soft X-ray excess yet found in any magnetic CV. Our density estimate and constraints from the observation itself show that the bulk of the mass flow will be buried to sufficiently deep sub-photospheric layers. Other mechanisms (cyclotron cooling, geometry) may be responsible for the quenching of additional hard X-ray emission from any residual low density material.
The soft X-ray emission is seen between orbital phases 0.4 and 0.95 consistent with an origin from one of the polarimetrically defined accretion spots. Further observations that will provide a much better definition of the mean orbital light curve are required to clarify the yet uncertain accretion geometry of V1309 Ori.
The softness of the X-ray emission of the primary accretion region and its favourable geometry allowed us to disentangle two other emission components which have not been resolved in any other polar so far. The softer of these components has been interpreted as scattering or reflection of primary soft X-ray photons in the column closely above the impact region.
The prolonged eclipse on the other hand, indicates the presence of a much more extended emitting source for the harder faint phase emission, most likely the accretion stream. A possible mechanism for this component is shock heating at the stagnation region in the magnetosphere. It appears, however, that further progress and a definite conclusion on this interesting possibility require a much better definition of the mean orbital light curve and an improved statistical definition of the decreasing X-ray emission during the eclipse.
Acknowledgements.
RS was and is supported by the Deutsches Zentrum für Luft- und Raumfahrt (DLR) GmbH under contracts No. FKZ 50 OR 0206 and 50 OR 0404.References
- Aizu (1973) Aizu, K. 1973, Progress of Theoretical Physics, 49, 1184
- Araujo-Betancor et al. (2005) Araujo-Betancor, S., Gänsicke, B. T., Long, K. S., et al. 2005, ApJ, 622, 589
- Beuermann (2004) Beuermann, K. 2004, in ASP Conf. Ser. 315: IAU Colloq. 190: Magnetic Cataclysmic Variables, 187
- Beuermann & Burwitz (1995) Beuermann, K. & Burwitz, V. 1995, in ASP Conf. Ser. 85: Magnetic Cataclysmic Variables, 99
- Beuermann & Schwope (1994) Beuermann, K. & Schwope, A. D. 1994, in ASP Conf. Ser. 56: Interacting Binary Stars, 119
- Beuermann et al. (1987) Beuermann, K., Stella, L., & Patterson, J. 1987, ApJ, 316, 360
- Buckley & Shafter (1995) Buckley, D. A. H. & Shafter, A. W. 1995, MNRAS, 275, L61
- Burwitz et al. (1999) Burwitz, V., Reinsch, K., Beuermann, K., & Thomas, H. 1999, in ASP Conf. Ser. 157: Annapolis Workshop on Magnetic Cataclysmic Variables, 127
- Cropper (1988) Cropper, M. 1988, MNRAS, 231, 597
- de Martino et al. (1998) de Martino, D., Barcaroli, R., Matt, G., et al. 1998, A&A, 332, 904
- Done & Magdziarz (1998) Done, C. & Magdziarz, P. 1998, MNRAS, 298, 737
- El Kholy (2004) El Kholy, E. 2004, Ph.D. Thesis, University Göttingen
- Frank et al. (1988) Frank, J., King, A. R., & Lasota, J.-P. 1988, A&A, 193, 113
- Frank et al. (1995) Frank, J., Lasota, J.-P., & Chanmugam, G. 1995, ApJ, 453, 446
- Gänsicke et al. (1995) Gänsicke, B. T., Beuermann, K., & de Martino, D. 1995, A&A, 303, 127
- Hameury & King (1988) Hameury, J. M. & King, A. R. 1988, MNRAS, 235, 433
- Hameury et al. (1986) Hameury, J.-M., King, A. R., & Lasota, J.-P. 1986, MNRAS, 218, 695
- Heise et al. (1985) Heise, J., Brinkman, A. C., Gronenschild, E., et al. 1985, A&A, 148, L14
- Heise & Verbunt (1988) Heise, J. & Verbunt, F. 1988, A&A, 189, 112
- Katajainen et al. (2003) Katajainen, S., Piirola, V., Ramsay, G., et al. 2003, MNRAS, 340, 1
- King & Lasota (1979) King, A. R. & Lasota, J. P. 1979, MNRAS, 188, 653
- Kuijpers & Pringle (1982) Kuijpers, J. & Pringle, J. E. 1982, A&A, 114, L4
- Lamb & Masters (1979) Lamb, D. Q. & Masters, A. R. 1979, ApJ, 234, L117
- Litchfield & King (1990) Litchfield, S. J. & King, A. R. 1990, MNRAS, 247, 200
- Mewe et al. (1985) Mewe, R., Gronenschild, E. H. B. M., & van den Oord, G. H. J. 1985, A&AS, 62, 197
- Patterson (1984) Patterson, J. 1984, ApJS, 54, 443
- Ramsay & Cropper (2004) Ramsay, G. & Cropper, M. 2004, MNRAS, 347, 497
- Ramsay et al. (2004) Ramsay, G., Cropper, M., Wu, K., et al. 2004, MNRAS, 350, 1373
- Ramsay et al. (1994) Ramsay, G., Mason, K. O., Cropper, M., Watson, M. . G., & Clayton, K. L. 1994, MNRAS, 270, 692
- Rothschild et al. (1981) Rothschild, R. E., Gruber, D. E., Knight, F. K., et al. 1981, ApJ, 250, 723
- Schmidt (2004) Schmidt, G. 2004, in ASP Conf. Ser. 315: Magnetic Cataclysmic Variables (IAU 190), 22
- Schmidt & Stockman (2001) Schmidt, G. D. & Stockman, H. S. 2001, ApJ, 548, 410
- Schwope et al. (2001) Schwope, A. D., Schwarz, R., Sirk, M., & Howell, S. B. 2001, A&A, 375, 419
- Shafter et al. (1995) Shafter, A. W., Reinsch, K., Beuermann, K., et al. 1995, ApJ, 443, 319
- Staude et al. (2001) Staude, A., Schwope, A. D., & Schwarz, R. 2001, A&A, 374, 588
- Stella et al. (1986) Stella, L., Beuermann, K., & Patterson, J. 1986, ApJ, 306, 225
- Townsley & Bildsten (2004) Townsley, D. M. & Bildsten, L. 2004, ApJ, 600, 390
- Walter et al. (1995) Walter, F. M., Wolk, S. J., & Adams, N. R. 1995, ApJ, 440, 834
- Watson et al. (1987) Watson, M. G., King, A. R., & Williams, G. A. 1987, MNRAS, 226, 867
- Woelk & Beuermann (1996) Woelk, U. & Beuermann, K. 1996, A&A, 306, 232
- Zimmermann et al. (1994) Zimmermann, H. U., Becker, W., Belloni, T., et al. 1994, in MPE report, Vol. 257