A Comparison of H and Stellar Scale Lengths in Virgo and Field Spirals
Abstract
The scale lengths of the old stars and ionized gas distributions are compared for similar samples of Virgo Cluster members and field spiral galaxies via H and broad R–band surface photometry. While the R–band and H scale lengths are, on average, comparable for the combined sample, we find significant differences between the field and cluster samples. While the H scale lengths of the field galaxies are a factor of 1.14 0.07 longer on average than their R–band scale lengths, the H scale lengths of Virgo Cluster members are on average 20% smaller than their R–band scale lengths. Furthermore, in Virgo, the scale length ratios are correlated with the size of the star-forming disk: galaxies with smaller overall H extents also show steeper radial falloff of star formation activity. At the same time, we find no strong trends in scale length ratio as a function of other galaxy properties including galaxy luminosity, inclination, morphological type, central R–band light concentration, or bar type. Our results for H emission are similar to other results for dust emission, suggesting that H and dust have similar distributions. The environmental dependence of the H scale length places additional constraints on the evolutionary process(es) that cause gas depletion and a suppression of the star formation rate in clusters of galaxies.
Subject headings:
galaxies: spiral, galaxies: star formation, galaxies: clusters: general, galaxies: clusters: individual name: Virgo, galaxies: fundamental parameters, galaxies: structure1. Introduction
A quantitative comparison of the distribution of current star formation sites to that of the older stellar population in normal spiral galaxies can place important constraints on the laws of star formation in spiral disks and the star formation history of the universe.
Stellar disks of spiral galaxies follow an exponential distribution in their surface brightness but what of the star formation? Schmidt (1959) suggested that the radial trend of star formation could be described by a power law of the gas density. According to such “Schmidt laws”, the distribution of star formation should follow the distribution of gas. Kennicutt (1989) and Martin & Kennicutt (2001) found that the gas surface density, normalized by disk area, is correlated with the star formation rate, as long as the gas surface density exceeds a critical value set by gravitational instability. The radial distributions of molecular (e.g., Nishiyama, Nakai, & Kuno 2001; Regan et al. 2001; Young et al. 1995) and atomic (e.g., Warmels 1988; Cayatte et al. 1994; Thomas et al. 2004) gas have been shown for many galaxies to be approximately exponential over much of a galaxy’s disk. Molecular and atomic gas scale lengths have been shown to correlate with stellar scale lengths (Regan et al. 2001), with dust scale lengths (Thomas et al. 2004) and with each other (Nishiyama et al. 2001), although the sample sizes are small and the scatter large. The main issues discussed in this paper are (a) whether the radial behavior of the sites of on-going massive star formation is similar to that exhibited by the older stellar disk, under the assumption that both are fairly approximated by exponential functions, and (b) whether their distributions depend on the galaxy environment.
A common tracer of massive star formation arising from the youngest stellar population (age Myr) is the H emission line, which can be used to estimate the total star formation rate in relatively dust-free regions by making standard assumptions about the initial mass function (Kennicutt 1983). It is relatively easy to acquire H observations for large samples of galaxies, and therefore the comparison of H and broadband scale lengths can be used to probe the linkage between the young, massive stars and the older, more evolved stellar population.
Previous studies have found that the radial distribution of massive star formation as traced by H is indeed exponential over large areas of the disk, but they have often presented conflicting results on the relative values of H and stellar exponential scale lengths. Hodge & Kennicutt (1983) found for 14 spirals that H scale lengths, measured from HII region distributions, are comparable to broadband scale lengths. Athanassoula, García Gómez, & Bosma (1993), also using HII region distributions, found that H scale lengths are on average 10% (20%) shorter than those of stellar scale lengths, as measured in the red (blue), for their sample of 64 spiral galaxies. Ryder and Dopita (1994; hereafter RD94) fit scale lengths to H surface brightness profiles derived from CCD imaging for a sample of 34 nearby spirals, finding H scale lengths 75% and 60% longer on average than those in broadband I and V, respectively. The observation of longer H scale lengths is consistent with a number of studies documenting color gradients in spiral disks, such that spirals become bluer with increasing radius (e.g., de Jong 1996b) due to dust and/or age/metallicity effects (de Jong 1996b; Peletier et al. 1994; de Grijs 1998; Cunow 1998, 2001). However, it is surprising that the difference in relative H scale lengths as measured by different authors should be so large. In addition, broadband scale length ratios tend to be significantly smaller than the H:I ones found by RD94; for example, literature values for the B:I ratio range from 1.12 to 1.36 for galaxies of low to high inclination, respectively (de Jong 1996b; de Grijs 1998).
In the hopes of resolving this conflict, we compare in this paper H and R–band scale lengths for a sample of 103 spiral galaxies. The sample of galaxies is summarized in Section 2. Section 3 presents a description of the fitting procedures used to extract both R–band and H scale lengths from imaging data. The comparison of the scale lengths is discussed in Section 4, while Section 5 investigates the relationship between H scale lengths and other galaxy properties, including the size of the star-forming disk, HI content, and the distributions of molecular gas and dust. Section 6 provides a summary and discussion of our results.
2. Sample of Galaxies
For this study, we have made use of existing imaging and spectroscopic data for two sets of galaxies: a sample of 52 Virgo cluster spirals and a complementary set of 51 similar field galaxies. Broadband R and H imaging data for the cluster sample were extracted from Koopmann et al. (2001), who selected bright ( 13.5) members from the Virgo Cluster Catalog (Binggeli et al.1985). The field sample is made up of spirals outside of clusters (based on studies such as Tully 1987) and was compiled from several sources of broad– and narrow–band imaging data available to us. It includes 24 spirals from the isolated galaxy sample of Koopmann & Kenney (2005), 14 from the studies of van Zee et al. (1998) and Jore (1997; see also Haynes et al. 2000), and 13 from the Palomar/Las Campanas Atlas of Nearby Galaxies (Koopmann, R. A. et al., in prep.). Details of the image reduction procedures are given in the cited papers. We note that no correction was made for contamination by the 2 [NII] 6548, 6584 Ålines that also lie within the bandpasses of the H filters. Thus H in this paper should be read as H+[NII] (see also Koopmann & Kenney 2005). For the Koopmann et al. (2001) and Koopmann & Kenney (2005) datasets, surface photometry was obtained from the R–band and continuum-subtracted H images using fixed center, inclination, and position angle elliptical apertures, following techniques discussed in Koopmann et al. (2001). The H images from the van Zee et al. and Jore datasets were constructed from ON– and OFF–line narrow band images which were then analyzed following procedures identical to those used for the Koopmann ones.
Table 1 provides a comparison of the mean distances, luminosities, axial ratios, Hubble types, and bar fractions of galaxies in the two environments. The Virgo objects are placed at the mean cluster distance of 16.6 Mpc, while distances to the field objects were calculated adopting the local flow model of Tonry et al. (2000) using a program kindly provided by K.L. Masters. Based on this model, the field galaxies have a mean distance of 21.4 1.4 Mpc. Because distance errors calculated from such a model carry a large error for individual objects located in the local volume, most of the analysis performed in this work relies on distance-independent relative quantities.
Face-on total blue magnitudes, B, were extracted from the Third Reference Catalog (de Vaucouleurs et al. 1991, hereafter the RC3) and values were calculated using the derived distances. The luminosity ranges of the two samples are similar, but the field sample is brighter in the mean by 0.7 mag. The inclination range and mean of the two samples are similar, as can be seen from the values of the mean axial ratios.
Hubble types are extracted from two sources: (i) the RC3 and (ii) the Revised Shapley Ames Catalog (Sandage & Tammann 1987, hereafter RSA) supplemented by the Binggeli et al. (1985) and Sandage & Bedke (1994) catalogs. We will collectively refer to types extracted from the latter 3 references as ‘RSA’ types. Both samples span a range across the Hubble spiral sequence but have comparable mean values of the RC3 type index T and a similarly calculated RSA type index. The bar fractions, derived from the RC3 and given as a ratio of percent of sample in Table 1, are similar for the two sets, although the field sample contains a relatively higher number of strongly barred galaxies.
| Property | Field | Virgo |
|---|---|---|
| Distance (Mpc) | 16.6 | |
| B | ||
| Axial Ratio | ||
| RSA T | ||
| RC3 T | ||
| SA:SAB:SB (%) | 27:37:35 | 36:36:27 |
3. Derivation of R–band and H Scale Lengths
In this section, we discuss how the scale lengths were derived, particularly in the case of the H surface distributions which, by their patchy nature, are more complicated to fit.
3.1. R–band Scale Lengths
R–band disk scale lengths, , were determined using the bulge-disk decomposition utility within the IRAF routine nfit1d. Since we were most interested in disk scale lengths, no attempt was made to determine best-fit bulge parameters. This approach is based on the observation that the disk scale length is the most stable parameter derived in a bulge-disk decomposition (de Jong 1996a). The exponential disk fit was made over as large a range in galaxy radius as possible while avoiding the bulge region. We estimate the uncertainty in R–band scale lengths derived in this way to be 10-15% (see Koopmann et al. 2001).
While more stable than bulge parameters, disk scale lengths are known to be dependent on the fitting process. Knapen & van der Kruit (1991) find that scale lengths are extremely sensitive to the radial range fit and that literature values for the same galaxy differ on average by 23%, with a scatter of 20%. Möllenhoff (2004) provides an example of the scatter for the spiral NGC 4321. Scale lengths are also dependent on extinction within galaxies (Giovanelli et al. 1994). The galaxies in both our Virgo and field samples are of moderate inclination (mostly ), and thus we make no corrections for extinction in this paper, but compare our results as a function of inclination to check for extinction effects.
When we compare our R–band scale lengths to those of Grosbl (1985) for 21 field and 24 Virgo galaxies in common, we find that our R–band scale lengths are the same on average as those of Grosbl (1985) with a scatter of 25%. (Two very discrepant Virgo galaxies, NGC 4321 and NGC 4698, were removed from the sample because Grosbl’s much smaller values were obviously measured from a steeper inner portion of the radial profile.)
3.2. H Scale Lengths
Because H emission traces the youngest stellar population, at an age of less than 10 Myr, the HII region distribution is expected to strongly reflect the spiral arm pattern in grand-design spirals and to be quite patchy in more flocculent systems. In many objects, the H emission peaks in ring structures corresponding to spiral resonances and is often not traceable away from the localized star formation sites. Because of the irregular nature of the HII distribution, even the azimuthally averaged surface brightness profiles of the H emission are characteristically less smooth than those traced by the significantly older stellar population responsible for the R–band isophotes. Hence, deriving the scale length from the H images is substantially more difficult than the similar task for the relatively smooth stellar ones.
We start from the basic assumption that the star-forming disk has an underlying exponential distribution, albeit locally modified by the patchy nature of the massive star formation process. Ideally the H scale length, , should be fit over as much of a galaxy’s star-forming disk as possible. Yet a more limited radial range must be adopted to insure a consistent fit for all galaxies in the sample and to avoid systematic errors from inner regions, which are subject to uncertainties resulting from active nuclei, bulge continuum subtraction, dust, and clearing of gas by the presence of a bar, and outer regions, which are measured at lower sensitivity. We therefore use the scale lengths derived from the broadband images, , to set the inner and outer limits for the H fits. The radial fitting range was based on R–band scale lengths rather than isophotal radii because photometrically calibrated observations were not available for a large portion of the field sample. We note that the broadband scale length is correlated with isophotal measures of galaxy extent, such that the characteristic isophotal radii in various bands (i.e., r25 in B, r24 in R, r23.5 in I) typically lie between 3-4 scale lengths (e.g., Giovanelli et al. 1995; Koopmann et al. 2001). For galaxies with absolute photometry, fits were made within radial ranges defined by the isophotal radii, e.g., 0.3-0.9r24, and compared to the results obtained using ranges defined by the R–band scale length. There were no significant differences in the results.
To avoid contamination from the bulge, the inner regions
of the galaxy at are excluded from the fits.
As for the choice of the outer boundary for the fitting range, we
adopted three different options.
(1) –
Most of the field galaxies exhibit H emission of sufficiently
high S/N out to , so we use this as a first outer boundary.
However, a large number of the galaxies in our sample,
especially those in the Virgo
sample, have star-forming disks that are truncated
near or within 3
(e.g., Koopmann et al. 2001; Dale et al. 2001; Koopmann & Kenney 2004a).
There are also several galaxies, mostly Virgo,
that have resolved HII regions extending to or beyond 3, but because
of a small number of HII regions, the
azimuthally-averaged H surface brightness
profile approaches or is below the estimated sky uncertainty over the
outer part of the 1-3 range.
We elected to include these latter galaxies in the sample fit between
1-3. To test the effect of including these galaxies, we also
performed fits over the radial interval specified next.
(2) – In this case we fit all the H profile
points between and , the radius at which the uncertainty is
equal to the uncertainty in the sky.
This fit also had the advantages of
(i) allowing a wider radial fitting range in the case of many galaxies,
(ii) including several more Virgo galaxies in which the H
emission is truncated at a radius between 2 and 3 , and
(iii) allowing a comparison to previous measurements of H scale length
(e.g., RD94).
(3) –
Finally, we also made a fit to the more limited range of 1-2
for all the galaxies with H emission over this region, in order
to test for differences between the inner and outer disk scale lengths.
H profiles tend to be “bumpy” due to the presence of bright HII regions, rings of star formation, and regions swept of gas by a bar. These features can systematically affect fits made over a limited radial range. Thus we also fit scale lengths to profiles that had been radially smoothed. Smoothing was done within IDL using a multiple boxcar smoothing technique (smooth2) from the Johns Hopkins University library of IDL routines. A disadvantage of the smoothing process is that information from regions outside the 1-3 range, i.e., bulge, bar, and outer (often truncated) disk, is included. For galaxies with approximately exponential profiles, the unsmoothed and smoothed fits are similar. For those that deviate from exponential profiles, the unsmoothed and smoothed fits can be significantly different. The fitting range and degree of smoothing then become critical to the scale length estimate.
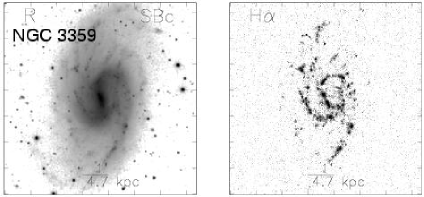
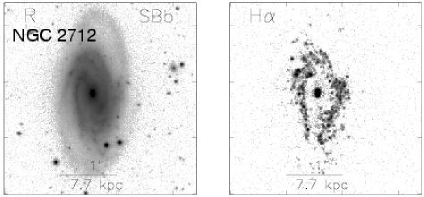
Figure 1 illustrates these points for two example galaxies in our field sample, NGC 3359 (upper) and NGC 2712 (lower). The R–band and H (continuum-subtracted) images of the galaxies are shown on the left, next to the derived surface brightness profiles (right panels, solid lines; the H profile is displaced by an arbitrary offset for display purpose). As mentioned above, the patchy H emission yields a profile that is significantly less smooth than the corresponding R–band one. For both galaxies, the R–band profile outside the innermost 1-2 kpc is well described by an exponential function (dashed). The situation is more complicated for the H profiles, which are shown in both smoothed (dotted) and unsmoothed (solid) version. Also shown are the exponential fits in the radial intervals 1-3 (solid) and (dashed) from which two of the three types of H scale lengths discussed above are derived. In the case of NGC 2712 (as well as in other, similar figures presented in this paper), the fitting range does not include the outermost points of the profile, since their uncertainties are above the sky noise fluctuations. For objects like NGC 3359, with a fairly exponential H profile, the derived scale length is similar no matter the smoothing or fitting range. The H radial profile of NGC 2712, on the other hand, has a shape reminiscent of a Freeman Type II profile, caused by the ring of star formation and bar region cleared of H emission. The derived scale lengths depend strongly on the range chosen for the fit and the degree of smoothing. We judge that it is better to exclude such galaxies from our sample than to guess at a best fit. Galaxies like NGC 2712, in which the fit either produced a positive slope or which otherwise obviously deviated from exponential, were therefore eliminated. The fits to all galaxies were examined by eye and best-fit scale lengths and errors assigned. In most cases, the value of the best fit was close to the average of the smoothed and unsmoothed fit and the error encompassed the values from the smoothed and unsmoothed fits. In some cases, either the smoothed or unsmoothed fit was deemed to be more reliable and was therefore weighted more heavily in the final result. In the comparisons of H and R–band scale lengths, galaxies with errors larger than 20% were rejected, thus effectively eliminating the objects with the least exponential profiles.
4. Comparison of Stellar and H Scale Lengths
The results of the disk scale length measurements described in Section 3 are presented in Table 3, along with a few quantities that will be used in the subsequent analysis. The galaxies are ordered by increasing Right Ascension. The parameters listed are:
Col. 1: NGC or IC designation.
Col. 2: other name, from the UGC (Nilson 1973), ESO (Lauberts 1982),
or MCG (Vorontsov-Velyaminov & Arhipova 1968) catalogs. MCG
designations are abbreviated to eight characters.
Col. 3: RSA morphological type (from Sandage & Tammann 1987, or
Binggeli et al. 1985, or Sandage & Bedke 1994). We list
here only the basic type, i.e. we drop from the name luminosity class and
other details.
Col. 4: RC3 morphological type (from de Vaucouleurs et al. 1991). Again, only the basic type is provided.
Col. 5: B, total, face-on blue magnitude from the RC3 catalog.
Col. 6: b/a, galaxy axial ratio used for the surface photometry,
and, in parentheses, inclination to the line of sight in degrees, calculated
using the Hubble (1926) conversion.
Col. 7: distance, in Mpc. A mean Virgo distance of 16.6 Mpc is
assigned to all
cluster members; for field objects, the distance is calculated from the Virgo
infall model of Tonry et al. (2000).
Col. 8: , HI content parameter, calculated following the
prescription of Giovanelli & Haynes (1984; see Section 5.3).
Col. 9: , radius containing 95% of the total
H flux (Section 5.2), in arcseconds.
Col. 10: , R disk scale length, and corresponding error,
in arcseconds.
Cols. 11-13: H disk scale lengths measured in the
radial intervals 1-3, 1-2, and , respectively, and
corresponding errors, in arcseconds. Entries are given only for those
objects for which satisfactory fits could be obtained. Scale lengths
with measurement errors larger than 20% are marked with a dagger.
Galaxies with sufficient emission over the given fitting range, but
for which the fit produced a negative or zero value (clearly
unphysical) are marked with an asterisk (to distinguish them from cases where a
measurement of the scale length could not be obtained due to lack of
H emission in the radial range considered).
An example of this situation was
presented in Figure 1, where the exponential fit to the H
profile of NGC 2712 over the 1-3 interval has a positive slope.
Col. 14: , maximum extent of the H rotation
curve (Section 5.2), in arcseconds.
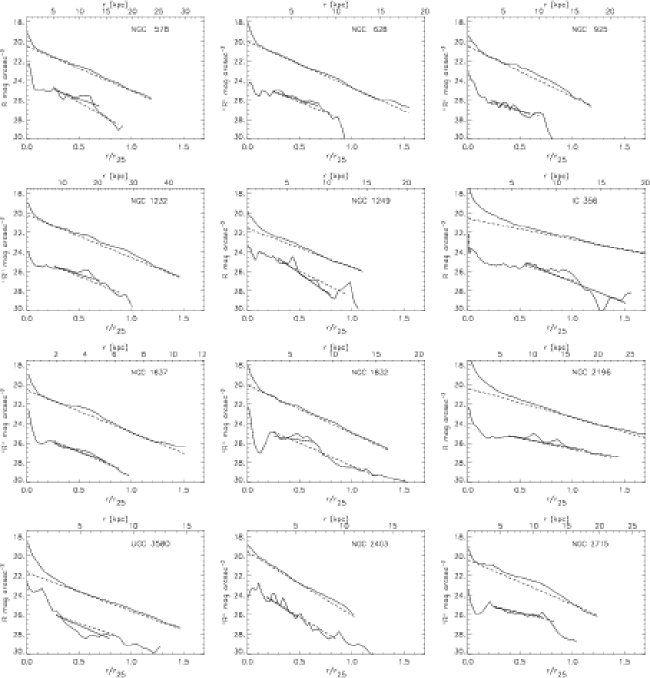
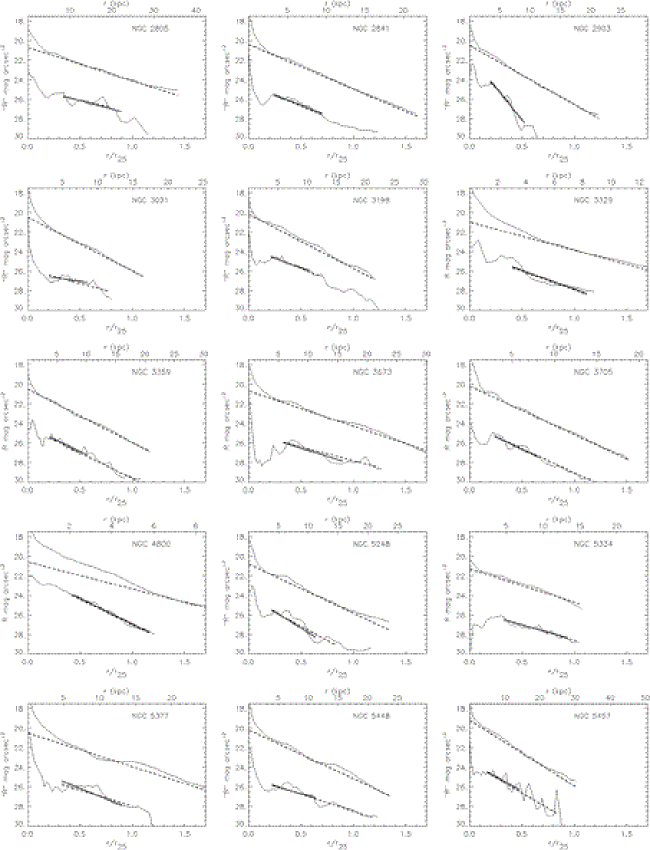
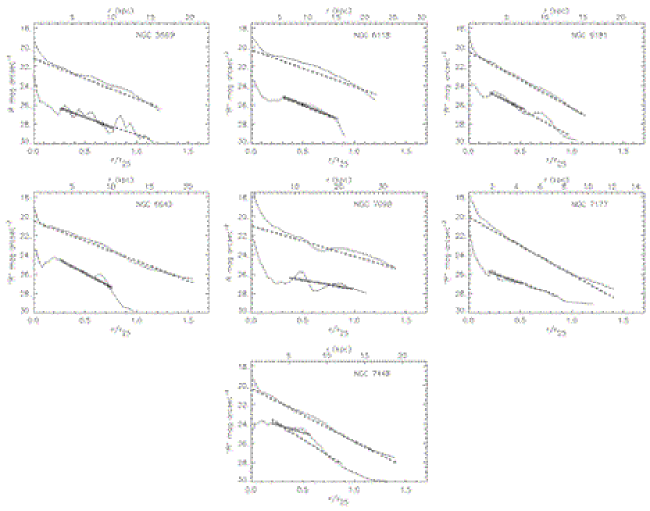
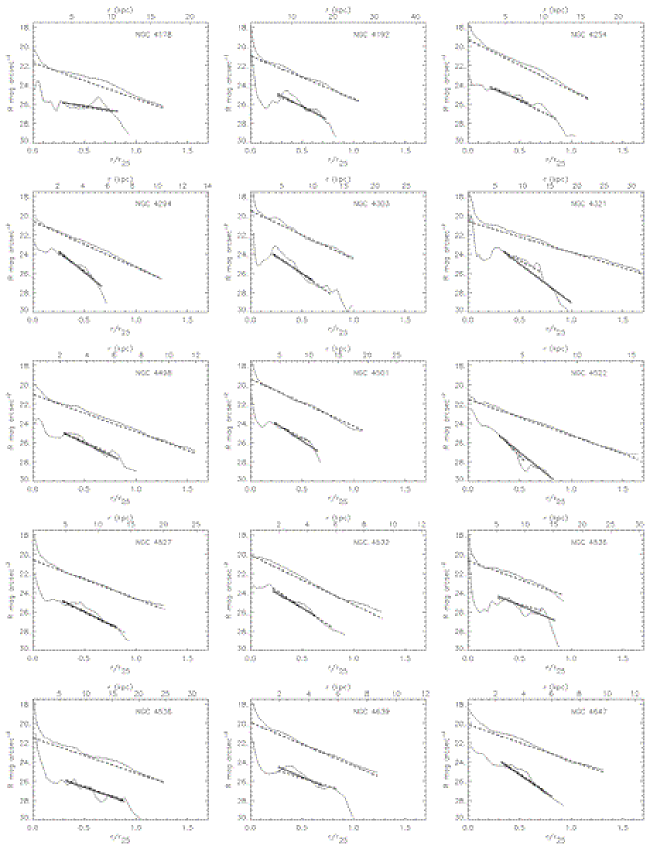
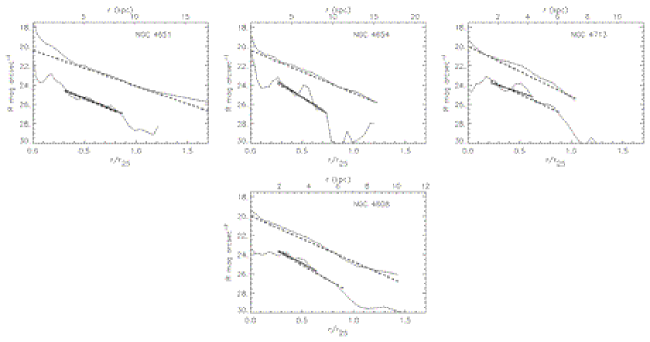
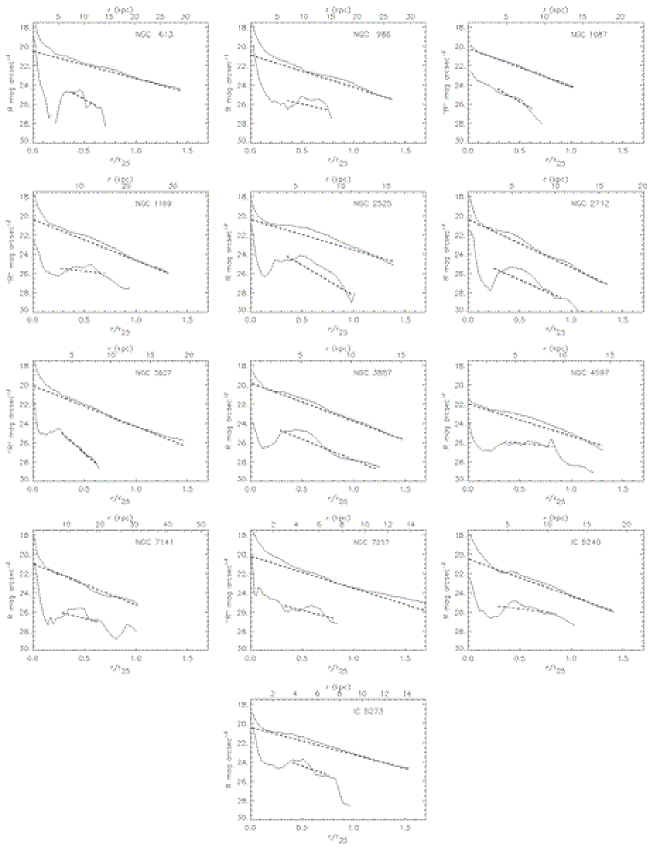
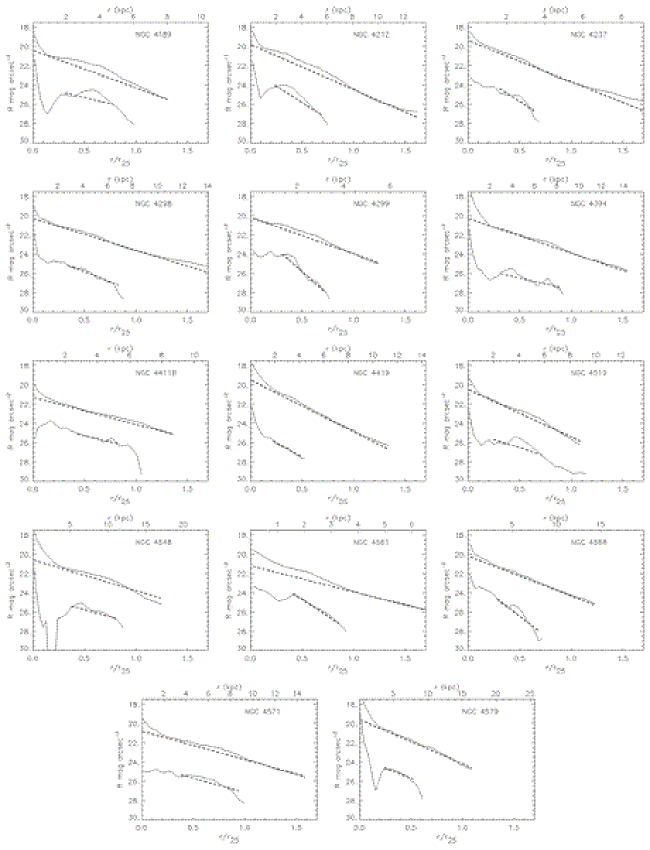
R–band and H surface brightness profiles are depicted for all sample galaxies for which an H scale length could be determined in the figures in the Appendix. For display purposes we divided the sample into: (a) 34 field galaxies and 19 Virgo cluster members with H emission that can be traced to r and have exponential profiles over 1-3 (Figures 1 and 2, respectively); and (b) 13 field and 14 Virgo cluster galaxies with H emission that could not be fit within 1-3 because their profiles were either not sufficiently exponential (see Figure 1) or were less extended than (Figures 3 and 4, respectively). The remaining galaxies (4 in the field sample, 19 in the Virgo cluster) do not have entries in columns 11-13 of Table 3 and are not shown. The H profiles are displaced by arbitrary amounts for clarity; the radial coordinate is expressed both in kpc (top of each panel) and in units of the B-band isophotal radius . Profiles are plotted out to the radius containing the outermost resolved HII region. Exponential fits are overplotted on the R–band and H profiles; in the latter case the fitting ranges adopted are also shown as solid (1-3, Figures 1 and 2) or dashed (, Figures 1–4) lines. As mentioned in Section 3.2, scale lengths are obtained from exponential fits to the H profiles that include only points with an uncertainty smaller than the sky noise (whereas this restriction does not apply to the two other definitions of H scale length adopted in this work). As a result, the corresponding dashed lines in the figures in the Appendix do not always reach the outermost points of the H profiles, and, in the case of Figures 1 and 2, they are sometimes even shorter than the solid lines (traced over the 1-3 interval).
A quick inspection of Table 3 reveals a first result: despite the fact that the luminosity and morphological type distributions of the Virgo and field samples are comparable, a much larger fraction of the Virgo galaxies does not exhibit star formation over the outer disk. Because of the absence of HII regions in their outer disks, we are obviously unable to measure H scale lengths for those galaxies with truncated star forming disks.
A detailed comparison between the R–band and the various types of H scale lengths defined in Section 3.2 has been made using measurements with fitting errors of 20% or less. Our results are summarized in Table 2 for the field and Virgo samples separately. In the case of H scale lengths measured over , we show also the results obtained using the whole samples, without error constraints. As Table 2 clearly shows, the scale length ratio is significantly different for the field and cluster galaxies: regardless of the method used to measure , the H emission is on average more extended than that traced in the R–band for the field sample, and less extended for the Virgo members. This is illustrated in more detail in Figures 2-4, as discussed below.
| Fitting Range | # of | % of | Average | |
|---|---|---|---|---|
| Galaxies | Sample | rα/rR | ||
| Field Results | ||||
| 1-3 (20% err) | 29 | 57 | 1.14 0.07 | 0.39 |
| 1-2 (20% err) | 24 | 47 | 1.18 0.10 | 0.48 |
| (20% err) | 39 | 76 | 1.06 0.06 | 0.36 |
| 48 | 94 | 1.20 0.09 | 0.65 | |
| Virgo Results | ||||
| 1-3 (20% err) | 18 | 35 | 0.79 0.06 | 0.27 |
| 1-2 (20% err) | 20 | 38 | 0.91 0.05 | 0.23 |
| (20% err) | 26 | 50 | 0.86 0.06 | 0.29 |
| 35 | 67 | 0.88 0.07 | 0.39 | |
Figure 2 shows the relationship between R–band and H scale lengths, obtained from exponential fits to the H profiles over 1-3, for the two samples separately. For the field sample (upper), there is some evidence that galaxies with larger stellar scale lengths have proportionately larger H ones. For Virgo galaxies (lower), it is clear that the star formation is more centrally concentrated (smaller ) than the stellar disk is. As seen in Table 2, H scale lengths are, on average, 14% longer than the R–band ones in field galaxies, and 20% shorter in cluster objects. Figure 3 provides a histogram representation of the same data subset. The scatter for both samples is large, but the difference between the field and Virgo sample is significant at the 99.8% level according to a K-S test. When the Virgo and field samples are combined, the H and R–band scale lengths are the same on average. The results show no significant difference if either the unsmoothed or the smoothed H profiles are adopted for the fitting process.
As noted in Section 3.2 and evident in Figures 1 and 2, some galaxies with HII regions beyond 3 have H surface brightness within 3 comparable or below that of the sky. The fits can be used to test the effect of including these galaxies in the 1-3 fitting results. The difference in 1-3 and fitted scale lengths is greater than the uncertainties in the fits for 1 field galaxy (NGC 2805) and 5 Virgo galaxies (NGC 4192, NGC 4321, NGC 4501, NGC 4535, and NGC 4639). If these galaxies are eliminated from the sample, the results are not significantly different (Field: 1.13 0.07; Virgo: 0.81 0.08).
It is also interesting to further consider H scale lengths determined from exponential fits to all points in the surface brightness profiles beyond that had an uncertainty less than the sky uncertainty. This fitting method is in fact more similar to that of RD94, who made their fits to the outer disk and did not adopt a radial range. Figure 4 is analogous to Figure 3, except for the H scale length adopted. The comparison between these two figures shows that the results for the larger fitting range are similar to those of the more limited radial range (see also Table 2). The difference between the field and Virgo samples is at the 92% level. If we include all 83 galaxies without an error cut (maximum error 50%), we find similar results with larger dispersion, as given in Table 2.
Finally, we use the H scale lengths that correspond to fits in the 1-2 range to investigate the effect of truncation of the outer disk. We first compare the 1-2 and 1-3 H scale lengths. For an exponential dust-free disk, we would expect these two scale lengths to be the same. We tested this for a total of 34 galaxies (21 field and 13 Virgo galaxies) with good measurements in both intervals, and found that the 1-2 are, on average, 13% and 29% longer than the 1-3 ones for the field and Virgo samples, respectively. There is no significant difference between the two samples according to a K-S test. An inspection of the individual plots presented in Figures 1 and 2 reveals that several of the Virgo galaxies with the most deviant ratios have H profiles that begin to decline sharply between 2 and 3, as a result of the truncation of the disk, therefore leading to the larger factor for the Virgo sample. As we will show in Section 5, there is a strong correlation between the maximum extent of the star forming region and the H scale length, which causes a bias in the scale lengths measured for truncated disks (they are systematically smaller than those of similar, non-truncated disks). We also compared (1-2) and R–band scale lengths, as summarized in Table 2. Note that 1-2 scale lengths could not be fit to 1/3 of the Virgo Cluster sample and two isolated/field galaxies (NGC 4395 and NGC 4984) that have H profiles truncated within 2. We find again that the Virgo H scale lengths are systematically smaller than the field sample, a result that is significant at the 99% level.
As a check on the importance of the radial range used to fit R scale lengths, we refit R scale lengths over the same radial ranges used to determine the H ones and recalculated all scale length ratios. All results were the same within the uncertainty.
In the rest of this paper we will adopt (1-3) as our measure of H disk scale length (unless otherwise noted), and will no longer specify the fitting range.
4.1. Comparison with Previous Results
Our results for the field galaxies suggest that H scale lengths are longer than stellar scale lengths, but our value differs from RD94 significantly. In fact our value of = 1.14 0.07 is closer to the value of unity, as measured by Hodge & Kennicutt (1983), than it is to the = 1.6 0.1 measured by RD94. A Student t-test shows differences at the 95% and 99% confidence levels respectively. This is surprising, given that our results and those of RD94 are both derived from CCD images and surface photometry, while those of Hodge & Kennicutt (and Athanassoula et al. 1993) are derived from the different method of HII region counting. In this section, we discuss possible reasons for the discrepancy between our result and that of RD94.
There are only four galaxies in common between our sample and the RD94 sample. We agree on the R–band scale lengths for NGC 1637, but are our values for NGC 4192, NGC 4548, and NGC 6118 are 6-16% longer
RD94 are able to measure H scale lengths for all of these galaxies except NGC 1637. We find the largest H scale length discrepancy between our results for NGC 6118. While RD94 measure an H scale length of 10.7 kpc, we find 4.2 kpc (1-3) or 4.5 () kpc. We do not reproduce the outer extent of the H profile given in Ryder & Dopita (1993) and examination of their image and profile suggests that their outer profile may be contaminated by sky. We note that NGC 6118 has the third longest H scale length measured in the RD94 sample. In the case of NGC 4192, we find a shorter H scale length of 4.7 kpc (1-3) or 5.8 kpc (), compared with RD94’s value of 7.8 kpc. Our H scale lengths are in closer agreement for NGC 4548, where we find 4.8 kpc (), compared to RD94 5.1 kpc.
It is hard to draw a general conclusion from the comparison of 3-4 galaxies. It is perhaps suggestive that we tend to find longer R–band and shorter H scale lengths. RD94 note in their paper that their R–band scale lengths could be systematically low, due to the use of the mode rather than the median/mean in the derivation of the azimuthally-averaged radial profile. They find that trial mean surface photometry profiles produced somewhat longer V-band and I-band scale lengths that were more similar to the H scale lengths. As noted above, we do indeed find that our R–band scale lengths are longer for 3 galaxies. It is interesting that Athanassoula et al.(1993) account for their shorter scale length ratios compared to Hodge & Kennicutt (1983) as due to systematically longer stellar scale lengths, rather than shorter HII region scale lengths. It is therefore possible that the well-known difficulty of measuring R–band scale lengths contributes to the discrepancy between our results.
RD94 did not specify a fitting range, rather they fit the outer disk points above the noise. This does not seem to explain the difference in our results, since we obtain similar results whether we use the 1-3 fitting range or the range. We do however note that RD94’s spiral sample is comprised of somewhat later type (by 0.25 in the RC3 type parameter) and brighter spirals (by 0.4 blue magnitudes), on average, than even our field sample, both of which might lead to some expectation of larger H distributions as suggested in Figure 5 (see below).
We have 7 galaxies in common with Hodge and Kennicutt (1983). Our H scale lengths are similar, on average, to theirs, but differ individually by factors up to 2.
5. Comparison with Galaxy Properties and other Disk Constituents
In this section, we examine how the relative distributions of the older stellar population as characterized by the R–band scale lengths and the young massive star forming disk traced by the H line emission are related to other galaxy properties and disk constituents. We find no strong dependence of H to R–band scale length ratio on luminosity, inclination, Hubble type, or de Vaucouleurs bar type, as shown in Figure 5 for separately the field (upper) and Virgo cluster (lower) galaxies. We also find no dependence on R–band concentration parameter, for the more limited sample of galaxies with absolute photometry (Koopmann et al. 2001 and Koopmann & Kenney 2005, provide concentration values.) The lack of a dependence on inclination argues that differences in extinction are not significant, at least in this relatively limited inclination range (mostly between 40∘ and 70∘). Alternatively the H and R-band scale lengths could be affected in a similar way by extinction.
Although the number of objects included in Figure 5 is quite small, the figure nonetheless suggests several interesting aspects of the present sample. The leftmost panels suggest a weak tendency for brighter field galaxies to have more extended star forming disks relative to the old stellar population; the same effect is not evident in the cluster objects, which, except perhaps for the faintest objects studied here, show systematically small scale length ratios. The contrast between the number of resultant cluster and field objects of different Hubble types, when the H surface brightness selection is applied is clear. No spirals classified as early types among the Virgo cluster sample are characterized by the necessary star formation rate to yield sufficiently extended H emission. Therefore, they appear in Table 3, but are absent from this figure. In contrast, in the field, the spirals classified as Sa-Sab do exhibit spatially extended star formation. This result is consistent with models in which the star formation rate in spirals classified as early-type is more strongly quenched by the cluster environment than in their later type spiral counterparts, possibly because they lie on more radial orbits (Dressler 1986; Solanes et al. 2001). Note that the Hubble classification itself is likely influenced by the star formation rate, in that HI deficient spirals with low star formation rates are more likely to be classified as early-type regardless of their bulge-to-disk ratio (Koopmann & Kenney 1998).
5.1. Comparison with I-Band Scale Lengths
As a comparison with an even older stellar population and a confirmation of our surface brightness profile extraction process, we compare the R–band scale lengths derived above to ones derived from photometric I–band images available to us for 23 field and 22 Virgo galaxies from the SFI++ Cornell archive (Masters, K. L. et al., in prep.). On average = 1.17 0.03 (dispersion: 0.20), with no difference between the field and Virgo samples. This value is similar to the value of 1.10 0.02 found by Cunow (2001), who also found that the ratio increased from 1.0 for face-on to 1.2 for edge-on galaxies. Other studies (e.g., Peletier et al. 1994; Cunow 2004) also find an inclination dependence when comparing galaxies of more extreme edge-on and face-on orientations. We find no strong correlations with inclination, but again, since our sample is not constructed to sample the extremes of inclination, it is not sensitive for this test.
Combining our average R:I-band and H:R-band ratios, we find that the H scale length is a factor of 1.33 0.08 (dispersion 0.52) longer than I-band scale lengths in field samples. This result compares to of 1.12 for face-on spirals (de Jong 1996b) and 1.36 0.03 for edge-on spirals (de Grijs 1998). The ratios measured in this study are thus very similar to the ones, reflective of the similarity of stellar population sampled by both B-band and H emission.
5.2. Comparison with the Maximum H Extent
As noted above, we find in this study that Virgo Cluster scale length ratios are systematically smaller than those of field galaxies. To determine if this is due to the smaller size of Virgo star-forming disks (e.g., Koopmann & Kenney 2004a), we also derive estimates of the maximum extent of star formation from available imaging and spectroscopic data.
First, using the imaging data, we characterize the size of the H disk as , the radius containing 95% of the H emission (see Koopmann et al. 2001). The results are shown in the leftmost panels of Figure 6. There is a large scatter, but the H scale lengths in the Virgo Cluster sample are systematically shorter for galaxies with smaller H disks (smaller ). The correlation is weaker in the field sample. Again, we emphasize that, unlike the field population, there are no Virgo galaxies with ratios of , whereas a significant fraction of the field galaxies show star formation extending well out into the stellar disk.
As a second comparative test, we also exploit a measure of the maximum extent of the H rotation curve, , making use of the high sensitivity long-slit optical rotation curves described in Catinella et al. (2005). Following those authors, is simply the radius of the outermost radial point with detectable H emission, as measured from the folded rotation curve. As evident in the central panels of Figure 6, this measure also reveals the truncation of star formation in Virgo spirals, confirming the result found from the imaging dataset.
These results are somewhat surprising because the Virgo galaxies with H scale lengths measured in the 1-3 range are among the most ‘normal’ in the cluster - they have normal HI contents (Section 5.3) and their disks are not severely truncated. While even ‘normal’ Virgo galaxies do show a tendency to smaller H disks outside of r24 in R (as can be seen in Figure 2 of Koopmann & Kenney 2004b), this analysis considers only the star formation rates within 3. This suggests that the reduction in H scale length is due not only to a simple truncation in the star-forming disk, but also to an increase in the central concentration of star formation. Evidence that this is the case can be seen in Figures 2 and 6: the stellar disks of both Virgo and field galaxies span a similar range, but the Virgo HII disks are clearly truncated, exhibiting not just a cutoff in the extent of the star forming regions, but also a change in the slope of the exponential decline of the H surface brightness. In fact, Koopmann & Kenney (2004a) show that Virgo spiral galaxies tend to have normal – enhanced inner disk (0-0.3r24) star formation rates compared to isolated counterparts. We calculated the star formation rates over the 0-0.3r24 range for our sample of Virgo Sc-Scd and found that these rates are 30% higher in the median than those of isolated Sc-Scd galaxies (as given in Koopmann & Kenney 2004a). Thus star formation in Virgo spirals is quenched by processes that affect the disk from the outside in, and act in at least some cases to increase inner disk star formation rates, yielding more centrally concentrated star formation compared to similar galaxies found in the field.
5.3. Comparison with HI content
Several studies have shown a dependence of star formation rates and extent on the HI content (e.g., Gavazzi et al. 2002; Koopmann & Kenney 2004a; Catinella et al. 2005), and it is well known that Virgo cluster spirals are relatively gas-poor compared to their field counterparts. Here, we reexamine this relationship comparing the field and cluster samples, but first note that the majority of the Virgo galaxies for which the H emission is both strong and extended enough for a scale length determination are relatively HI-normal. Hence, rather than concentrating on the degree of HI deficiency, (e.g., Solanes et al. 2002), we concentrate on the relative HI content of the gas-bearing population. The HI content parameter tabulated in Table 3, adopts the commonly-used definition of relative HI content which compares the observed HI mass for a given galaxy with that expected for the average, isolated galaxy of similar optical linear size and morphological type. Note that this definition of corresponds to the “HI deficiency” parameter (Haynes & Giovanelli 1984); positive values indicate relative gas poorness. Here, we use HI fluxes from the digital compilation of Springob et al. (2005) where available, or else from the literature. Values of were calculated following the relations given in Solanes et al. (1996) (and as described in Koopmann & Kenney 2004a). Indeed, there is only one object in each sample depicted in Figure 6 that is truly HI deficient, with greater than 0.5, that is, containing less than 1/3 of the HI mass expected for a “normal”, isolated galaxy of comparable linear diameter and morphological type. As evident in Table 3, many more Virgo spirals are strongly HI deficient, but their H extents are too truncated to permit even the determination of . At the same time, the right panels of Figure 6 exhibit a weak trend of smaller ratios with decreasing HI content (larger values. Notice that since both and are normalized quantities, this correlation is not a simple scaling relation). In other words, at fixed R-band disk scale length, galaxies with smaller HI content have, on average, less extended on-going star formation, a result that holds for both field and Virgo objects that are not HI-deficient. This is also in agreement with the results of Catinella et al. (2005), who find, for a much larger sample of some 700 HI-normal objects, that galaxies with higher than average HI content have larger than average H extent, and vice versa. In conclusion, these results are consistent with previous findings of H truncation in HI-stripped cluster galaxies (Gavazzi et al. 2002; Koopmann & Kenney 2004a), and show that the correlation between massive star formation as traced by H emission and HI content holds also for HI-normal spirals and is not limited to the cluster environment.
Vogt et al. (2004) find that HI-deficient galaxies in clusters are offset in the fundamental plane, consistent with a 25% decrease in I–band scale lengths. We directly compared our R–band scale lengths for HI normal and HI deficient spirals in the Virgo Cluster, but find no significant difference.
5.4. Comparison with the Scale Length of Molecular Gas
Scale lengths measured from CO radial profiles, , were compiled from the studies of Regan et al. (2001) and Nishiyama et al. (2001) for 9 sample galaxies (4 field and 5 Virgo) with measured 1-3 H scale lengths. Two of the field galaxies and one of the Virgo galaxies are measured in both studies. The scatter between sources is large, e.g., NGC 4321 has values of 3.89 kpc (Regan et al. 2001) and 5.29 kpc (Nishiyama et al. 2001). There is a correlation between the H and CO scale lengths, but large scatter, as shown in Figure 7. In the mean / = 0.79 0.08 (dispersion 0.24). This result appears to be somewhat biased by shorter Virgo H scale lengths, since the average for the Virgo galaxies is 0.67 0.07, while that of field galaxies is 0.90 0.13. Regan et al. (2001) find that CO and stellar disk (K) scale lengths for a sample of 15, mostly field galaxies are correlated, with a mean ratio of 0.88 0.14 (dispersion 0.52). Combining this result and our own result for the field, we would expect the H to CO ratio to be closer to 1.5 - 1.6, taking into account the conversion between I and K scale lengths (e.g, de Jong 1996b).
5.5. Comparison with the Scale Length of Dust
Thomas et al. (2004) find that the ratio of the dust scale length, as measured at 850m, to the blue isophotal diameter has a mean value of 0.33 0.04 for a sample of 29 near-infrared bright spiral galaxies imaged in the SCUBA Local Universe Galaxy Survey (Dunne et al. 2000). We find a similar value of 0.28 0.02 (dispersion 0.11) for the ratio of the H scale length to the blue isophotal diameter for the field sample. In the Virgo sample, the ratio is 0.20 0.03 (dispersion 0.12). Xilouris et al. (1999) derive dust scale lengths for 7 galaxies, using broadband visible and near-infrared (I–band) imaging and a model which assumes that the dust is smoothly distributed within a 3-D axisymmetric exponential disk. The resulting dust scale lengths are a factor 1.4 0.2 longer than the stellar scale lengths. This is similar to our result of /= 1.33 0.08. Thus we conclude that H seems to be distributed similarly to the dust in field spirals.
6. Discussion
We have compared exponential scale lengths of the stellar and massive star-forming populations for a large sample of field and Virgo Cluster galaxies. We find that exponential scale lengths of massive star formation, as traced by H, are correlated with stellar exponential scale lengths. In the field, H scale lengths are on average a factor of 1.14 0.07 longer than those measured in R–band and their ratio is not strongly dependent on luminosity, inclination, morphological type, central R–band light concentration, or bar type. For these field spirals, H appears to be distributed in a similar way as broadband B and dust emission, as measured at 850 m and near-infrared wavelengths.
Scale length ratios are strongly dependent on the environment of the galaxy. The H scale lengths of Virgo Cluster spiral galaxies are typically 20% smaller than R–band scale lengths, and their ratio is strongly correlated with the size of the star-forming disk. In at least some cases, an increased central concentration of star formation has contributed to the decreased H scale length.
Environmental processes that affect the gas content of galaxies are likely responsible for the shortening of the H scale length in Virgo cluster galaxies. Modeling of these processes has become more realistic in recent years and may provide some insight into our observed results.
Intracluster medium - interstellar medium (ICM-ISM) interactions (Gunn & Gott 1972; Nulsen 1982; Vollmer et al. 2001; van Gorkom 2004) remove gas from galaxies that pass through the intracluster medium of the cluster. Ram pressure stripping causes truncation of the gas disk (e.g., Abadi et al. 1999) and, in the case of high ICM density, can remove much of a galaxy’s gas within 10-100 Myr (Abadi et al. 1999; Quilis et al. 2000; Roediger & Hensler 2004). Stripping significant enough to truncate a massive galaxy to 15-20 kpc may happen even in the low ICM density outskirts of clusters (Roediger & Hensler 2004). The ram pressure model of Vollmer et al. (2001), which is based on the relatively low density ICM case of the Virgo Cluster, predicts that stripping may occur over more than one orbit of the cluster, depending on the orbit and the galaxy orientation. Many of these models also predict that star formation in the bound gas can be enhanced, either through a compression directly due to the ICM gas (e.g., Dressler & Gunn 1983; Gavazzi et al. 2001) or by displaced gas falling back into the disk (e.g., Vollmer et al. 2001). The models of Vollmer et al., for example, predict an enhancement of the star formation rate within the central 0.25 of the disk, caused by a passage close to the cluster center. These models can account for the many HI deficient galaxies in the Virgo Cluster, but they may also provide an explanation of why relatively HI normal galaxies could show a steepening/truncation of the H profiles, indicating a modification in their gas content within the last 10 Myr. The galaxies in our sample that are HI-normal but H-small could be those that have passed previously through the core but were not completely stripped (Vollmer et al. 2001). Of the Virgo cluster galaxies in this sample, at least two show signs of a recent ICM-ISM interaction, including NGC 4522 (Kenney & Koopmann 1999; Kenney, van Gorkom, & Vollmer 2004) and NGC 4654 (Phookun & Mundy 1995). Galaxies that are located relatively far from the Virgo core, however, are likely more strongly affected by other environmental processes.
Another process that selectively removes gas is starvation or strangulation, i.e., the stripping of gas from a galaxy’s surroundings that might otherwise have accreted onto the galaxy (Larson, Tinsley, & Caldwell 1980; Balogh, Navarro, & Morris 2000). This mechanism could operate far from the cluster core. However, simulations of Bekki et al. (2002) show that starvation leads to gas and star formation distributions that closely resemble anemic spirals, with lowered rates of star formation throughout the disk. It is thus not clear how starvation/strangulation might produce a shorter H scale length.
Gas contents and distributions can also be affected by gravitational effects (Toomre & Toomre 1972; reviews by Struck 1999 and Mihos 2004) that can occur throughout a cluster, including (i) relatively slow interactions within cluster substructures, (ii) galaxy harassment due to high-velocity tidal interactions and collisions (e.g., Moore, Lake, & Katz 1998), or (iii) tidal interactions between galaxies and the cluster as a whole (Byrd & Valtonen 1990). Models of galaxy tidal interactions predict significant relocations of gas, both toward inner and outer radii (e.g., Barnes & Hernquist 1991). Lake, Katz and Moore (1998) show that galaxy harassment tends to drive gas towards the central regions. A resulting increase in star formation in the central regions due to an enhanced rate of cloud-cloud collisions would cause a steepening of the H profile. In agreement with the models, star formation rates have been observed to be statistically higher for interacting galaxies (e.g., Kennicutt 1998). Tidal interactions, in fact, appear to be fairly common in the Virgo Cluster, as shown by a number of kinematic (Rubin et al. 1999; Dale et al. 2001) and imaging (e.g., Koopmann & Kenney 2004b) studies.
In the absence of detailed modeling of the evolution of the radial distribution of star formation for the different types of environmental processes, the above comparisons can be viewed as only suggestive. We conclude that the smaller H scale lengths of Virgo cluster galaxies indicate an additional constraint on the types of environmental processes that cause gas depletion and a suppression of the star formation rate in clusters of galaxies.
References
- (1) Abadi, M. G., Moore, B., & Bower, R. G. 1999, MNRAS, 308, 947
- (2) Athanassoula, E., García Gómez, C., & Bosma, A. 1993, A&AS, 229, 249
- (3) Balogh, M. L., Navarro, J. F., & Morris, S. L. 2000, ApJ, 540, 113
- (4) Barnes, J. E. & Hernquist, L. 1991, ApJ, 370, L65
- (5) Bekki, K., Couch, W. J., & Shioya, Y. 2002, ApJ, 577, 651
- (6) Binggeli, B., Sandage, A., & Tammann, G. A. 1985, AJ, 90, 1681
- (7) Byrd, G. & Valtonen, M. 1990, ApJ, 350, 89
- (8) Catinella, B., Haynes, M. P., & Giovanelli, R. 2005, AJ, 130, 1037
- (9) Cayatte, V., Kotanyi, C., Balkowsky, C., & van Gorkom, J. H. 1994, AJ, 107, 1003
- (10) Cunow, B. 1998, A&AS, 129, 593
- (11) Cunow, B. 2001, MNRAS, 323, 130
- (12) Cunow, B. 2004, MNRAS, in press
- (13) Dale, D. A., Giovanelli, R., Haynes, M. P., Hardy, E., & Campusano, L. E. 2001, AJ, 121, 1886
- (14) de Grijs, R. 1998, MNRAS, 299, 595
- (15) de Jong, R. S. 1996a, A&AS, 118, 557
- (16) de Jong, R. S. 1996b, A&A, 313, 377
- (17) de Vaucouleurs, G., de Vaucouleurs, A., Corwin, H. G., Buta, R. J., Paturel, G., & Foqué, P. 1991, Third Reference Catalogue of Bright Galaxies (New York: Springer) (RC3)
- (18) Dressler, A. 1986, ApJ, 301, 35
- (19) Dressler, A.& Gunn, J. E. 1983, ApJ, 270, 7
- (20) Dunne, L., Eales, S. A, Edmunds, M. G., Ivison, R. J., Alexander, P., & Clements 2000, MNRAS, 315, 115
- (21) Gavazzi, G., Boselli, A., Mayer, L., Iglesias-Paramo, J., Vilchez, J.M. & Carrasco, L. 2001, ApJ, 563, L23
- (22) Gavazzi, G., Boselli, A., Pedotti, P., Gallazzi, A., & Carrasco, L. 2002, A&A, 396, 449
- (23) Giovanelli, R. & Haynes, M. P. 1983, AJ, 88, 881
- (24) Giovanelli, R., Haynes, M. P., Salzer, J. J., Wegner, G., Da Costa, L. N., & Freudling, W. 1994, AJ, 107, 2036
- (25) Giovanelli, R., Haynes, M. P., Salzer, J. J., Wegner, G., Da Costa, L. N., & Freudling, W. 1995, AJ, 110, 1059
- (26) Grosbl, P. J. 1985, A&A, 60, 261
- (27) Gunn, J. E. & Gott, J. R. 1972, ApJ, 176, 1
- (28) Haynes, M. P., & Giovanelli, R. 1984, AJ, 89, 758
- (29) Haynes, M. P., Jore, K. P., Barrett, E. A., Broeils, A. H., & Murray, B. M. 2000, AJ, 120, 703
- (30) Hodge, P. W. & Kennicutt, R. C. 1983, ApJ, 267, 563
- (31) Hubble, E. P. 1926, ApJ, 64, 321
- (32) Jore, K. P. 1997, Ph.D. thesis, Cornell University
- (33) Kenney, J. D. P. & Koopmann, R. A. 1999, AJ, 117, 181
- (34) Kenney, J. D. P., van Gorkom, J. H., & Vollmer, B. 2004, AJ, 127, 3361
- (35) Kennicutt, R. C. 1983, ApJ, 272, 54
- (36) Kennicutt, R. C. 1989, ApJ, 344, 685
- (37) Kennicutt RC, 1998, in Galaxies: Interactions and Induced Star formation, Saas-Fee Advanced Course 26, ed. D Friedli, L Martinet, D Pfenniger. (Berlin: Springer)
- (38) Koopmann, R. A. & Kenney, J. D. P. 2004a, ApJ, 613, 851
- (39) Koopmann, R. A. & Kenney, J. D. P. 2004b, ApJ, 613, 866
- (40) Koopmann, R. A. & Kenney, J. D. P. 2005, ApJS, in press
- (41) Koopmann, R. A., Kenney, J. D. P., & Young, J. 2001, ApJS, 135, 125
- (42) Knapen, J. H. & van der Kruit, P. C. 1991, A&A, 248, 57
- (43) Lake, G., Katz, N., & Moore, B. 1998, ApJ, 495, 152
- (44) Larson, R. B., Tinsley, B. M., & Caldwell, C. N. 1980, ApJ, 237, 692
- (45) Lauberts, A. 1982, ESO/Uppsala Survey of the ESO(B) Atlas (Munich: ESO) (ESO)
- (46) Martin, C. L. & Kennicutt, R. C. 2001, ApJ, 555, 301
- (47) Mihos, J. C. 2004, in Clusters of Galaxies: Probes of Cosmological Structure and Galaxy Evolution, ed. J. S. Mulchaey, A. Dressler, & A. Oemler (Cambridge: Cambridge Univ. Press), 278
- (48) Möllenhoff, C. 2004, A&A, 415, 63
- (49) Moore, B., Lake, G., & Katz, N. 1998, ApJ, 495, 139
- (50) Nilson, P. 1973, Uppsala General Catalogue of Galaxies, Acta Univ. Upsal., Ser. V:A, Vol. 1 (UGC)
- (51) Nishiyama, K., Nakai, N., & Kuno, N. 2001, PASJ, 53, 757
- (52) Nulsen, P. E. J. 1982, MNRAS, 198, 1007
- (53) Peletier, R. F., Valentijn, E. A., Moorwood, A. F. M., Freudling, W. 1994, A&AS, 108, 621
- (54) Phookun, B. & Mundy, L. G. 1995, ApJ, 453, 154
- (55) Quilis, V., Moore, B., & Bower, R. 2000, Science, 288, 1617
- (56) Regan, M. W., Thornley, M. D., Helfer, T. T., Sheth, K., Wong, T., Vogel, S. N., Blitz, L., & Bock, D. C.-J. 2001, ApJ, 561, 218
- (57) Roediger, E. & Hensler, G. 2005, A&A, in press
- (58) Rubin, V.C., Waterman, A.H., & Kenney, J.D.P. 1999, AJ, 118,236
- (59) Ryder, S. D. & Dopita, M. A. 1993, ApJS, 88, 415
- (60) Ryder, S. D. & Dopita, M. A. 1994, ApJ, 430, 142 (RD94)
- (61) Sandage, A. & Bedke, J. 1994, The Carnegie Atlas of Galaxies (Washington: Carnegie Inst.)
- (62) Sandage, A. & Tammann, G. A. 1987, A Revised Shapley-Ames Catalog of Bright Galaxies (Washington, DC: Carnegie Institution) (RSA)
- (63) Schmidt, M. 1959, ApJ, 129, 243
- (64) Solanes, J. M., Giovanelli, R., & Haynes, M. P. 1996, ApJ, 461, 609
- (65) Solanes, J. M., Sanchis, T., Salvador–Solé, E., Giovanelli, R. & Haynes M. P. 2002, AJ, 124, 2440
- (66) Springob, C. M., Haynes, M. P., Giovanelli, R., & Kent, B. R. 2005, ApJS, in press
- (67) Struck, C. 1999, Physics Reports, 321, 1
- (68) Thomas, H. C., Alexander, P., Clemens, M. S., Green, D. A., Dunne. L., & Eales, S. 2004, MNRAS, 351, 362
- (69) Tonry, J. L, Blakeslee, J. P., Ajhar, E. A. & Dressler, A. 2000, ApJ, 530, 625
- (70) Toomre, A. & Toomre, J. 1972, ApJ, 178, 623
- (71) Tully, R. B. 1987, Nearby Galaxies Catalog, (Cambridge: Cambridge University Press)
- (72) van Gorkom, J. H., 2004 in Clusters of Galaxies: Probes of Cosmological Structure and Galaxy Evolution, ed. J. S. Mulchaey, A. Dressler, & A. Oemler (Cambridge: Cambridge Univ. Press), 306
- (73) van Zee, L., Salzer, J. J., Haynes, M. P., O’Donoghue, A. A., & Balonek, T. J. 1998, AJ, 116, 2805
- (74) Vogt, N. P., Haynes, M. P., Giovanelli, R., & Herter, T. 2004, AJ, 127, 3325
- (75) Vollmer, B., Cayatte, V., Balkowski, C., & Duschl, W. J. 2001, ApJ, 561, 708
- (76) Vorontsov-Velyaminov, B. A., & Arhipova, V. P. 1968, Morphological Catalog of Galaxies (Moscow: Moscow State Univ.) (MCG)
- (77) Warmels, R. H. 1988, A&AS, 72, 427
- (78) Xilouris, E. M., Byun, Y. I., Kylafis, N. D., Paleologou, E. V., & Papmastorakis, J. 1999, A&A, 344, 868
- (79) Young, J. S. et al. 1995, ApJS, 98, 219


| (1) | (2) | (3) | (4) | (5) | (6) | (7) | (8) | (9) | (10) | (11) | (12) | (13) | (14) |
|---|---|---|---|---|---|---|---|---|---|---|---|---|---|
| NGC/IC | Other | RSA | RC3 | B | b/a() | Dist | rHα95 | rR | rα(1-3) | rα(1-2) | rα() | rmax | |
| — (∘) | (Mpc) | (′′) | (′′) | (′′) | (′′) | (′′) | (′′) | ||||||
| Virgo | |||||||||||||
| N 4064 | U 7054 | SBc: | SBa:pec | 12.30 | 0.391(70) | 16.6 | 1.23 | 25 | 442 | … | … | … | … |
| N 4178 | U 7215 | SBc | SBdm | 11.89 | 0.342(74) | 16.6 | 0.09 | 120 | 454 | 9620† | 12030† | 9530† | 97 |
| N 4189 | U 7235 | SBc | SABcd | 12.53 | 0.695(47) | 16.6 | 0.27 | 58 | 205 | 3010† | 61 | ||
| N 4192 | U 7231 | Sb: | SABab | 10.92 | 0.276(79) | 16.6 | 0.18 | 194 | 724 | 58 5 | 7210 | 228 | |
| N 4212 | U 7275 | Sc | SAc: | 11.86 | 0.643(51) | 16.6 | 0.16 | 55 | 224 | … | 154† | 55 | |
| N 4237 | U 7315 | Sc | SABbc | 12.37 | 0.682(48) | 16.6 | 0.50 | 44 | 164 | … | 103† | 40 | |
| N 4254 | U 7345 | Sc | SAc | 10.43 | 0.839(34) | 16.6 | 0.14 | 123 | 333 | 41 4 | 55 5 | 333 | … |
| N 4293 | U 7405 | Sa pec | SB0/a pec | 11.20 | 0.438(67) | 16.6 | 1.5 | 44 | 605 | … | … | … | … |
| N 4294 | U 7407 | SBc | SBcd | 12.62 | 0.391(70) | 16.6 | 0.37 | 51 | 222 | 12 2 | 15 2 | 141 | 64 |
| N 4298 | U 7412 | Sc | SAc | 12.08 | 0.530:(60) | 16.6 | 0.08 | 71 | 323 | … | 25 2 | 251 | 67 |
| N 4299 | U 7414 | Scd | SABdm: | 12.86 | 0.927:(22) | 16.6 | 0.22 | 28 | 154 | … | 7 2† | 61 | … |
| N 4303 | U 7420 | Sc | SABbc | 10.17 | 0.906(26) | 16.6 | 0.03 | 133 | 423 | 24 4 | 283 | … | |
| N 4321 | U 7450 | Sc | SABbc | 10.11 | 0.875(30) | 16.6 | 0.21 | 148 | 754 | 30 5 | 58 5 | 415 | 129 |
| N 4351 | U 7476 | Sc | SBab:pec | 13.04 | 0.695(47) | 16.6 | 0.37 | 30 | 255 | … | … | … | … |
| N 4380 | U 7503 | Sab | SAb: | 12.36 | 0.530(60) | 16.6 | 0.66 | 63 | 355 | … | … | … | |
| N 4383 | U 7507 | Amorph | SAa pec | 12.68 | 0.643(51) | 16.6 | 0.53 | 91 | … | … | … | … | … |
| N 4394 | U 7523 | SBb | RSBb? | 11.76 | 0.906(26) | 16.6 | 0.39 | 89 | 332 | … | 5010 | … | |
| N 4405 | U 7529 | Sc/S0 | SA0/a | 12.99 | 0.695(47) | 16.6 | 0.85 | 19 | 185 | … | … | … | … |
| N 4413 | U 7538 | SBbc | SBab: | 12.97 | 0.656(50) | 16.6 | 0.26 | 34 | 202 | … | … | … | 34 |
| N 4411B | U 7546 | Sc | SABcd | 12.92 | 1.00(0) | 16.6 | 0.60 | 76 | 292 | … | 30 4 | 323 | … |
| N 4419 | U 7551 | Sa | SBa | 12.13 | 0.391(70) | 16.6 | 0.78 | 46 | 202 | … | 19 2 | 182 | 44 |
| N 4424 | U 7561 | Sa pec | SAB0p | 12.32 | 0.616(54) | 16.6 | 0.79 | 27 | 334 | … | … | … | … |
| N 4450 | U 7594 | Sab pec | SAab | 10.93 | 0.707(46) | 16.6 | 0.99 | 92 | 414 | … | … | … | … |
| I 3392 | U 7602 | Sc/Sa | SAb: | 13.30 | 0.454(65) | 16.6 | 0.96 | 30 | 223 | … | … | … | … |
| N 4457 | U 7609 | RSb | SAB0/a | 11.76 | 1.00:(0) | 16.6 | 0.92 | 33 | 403 | … | … | … | … |
| N 4498 | U 7669 | SBc | SABd | 12.62 | 0.485(63) | 16.6 | 0.16 | 70 | 252 | 19 2 | 23 2 | 203 | 63 |
| N 4501 | U 7675 | Sbc | SAb | 10.27 | 0.50(62) | 16.6 | 0.34 | 112 | 463 | 32 4 | 42 4 | 402 | 105 |
| N 4519 | U 7709 | SBc | SBd | 12.34 | 0.743(43) | 16.6 | 0.18 | 86 | 214 | 3010† | 157 | ||
| N 4522 | U 7711 | Sc/Sb: | SBcd: | 12.73 | 0.276(79) | 16.6 | 0.69 | 54 | 323 | 14 2 | 8 2† | 111 | 43 |
| N 4527 | U 7721 | Sb | SABbc | 11.32 | 0.309(76) | 16.6 | 0.19 | 138 | 505 | 38 2 | 6010 | 382 | 160 |
| N 4532 | U 7726 | Sm | Im | 12.30 | 0.391(70) | 16.6 | 0.35 | 68 | 183 | 15 1 | 14 2 | 131 | 40 |
| N 4535 | U 7727 | SBc | SABc | 10.51 | 0.731(44) | 16.6 | 0.16 | 156 | 606 | 5010 | 7710 | 148 | |
| N 4536 | U 7732 | Sc | SABbc | 11.01 | 0.391(70) | 16.6 | 0.17 | 198 | 687 | 67 10 | 66 3 | 6710 | 220 |
| N 4548 | U 7753 | SBb | SBb | 10.98 | 0.809(37) | 16.6 | 0.76 | 126 | 555 | … | 7020† | 6020† | 109 |
| N 4561 | U 7768 | SBc | SBdm | 12.96: | 0.829(35) | 16.6 | 0.64 | 34 | 184 | … | 8 2† | 82† | … |
| N 4567 | U 7777 | Sc | SAbc | 12.08 | 0.695(47) | 16.6 | 0.64 | 41 | 313 | … | … | … | 43 |
| N 4568 | U 7776 | Sc | SAbc | 11.70 | 0.438(67) | 16.6 | 0.64 | 72 | 363 | … | 28 5 | 182 | 86 |
| N 4569 | U 7786 | Sab | SABab | 10.25 | 0.469(64) | 16.6 | 0.92 | 65 | 664 | … | … | … | … |
| N 4571 | U 7788 | Sc | SAd | 11.81 | 0.829(35) | 16.6 | 0.49 | 92 | 404 | … | 7020† | 404 | 87 |
| N 4579 | U 7796 | Sab | SABb | 10.56 | 0.799(38) | 16.6 | 0.63 | 90 | 423 | … | 46 5 | 46 5 | 96 |
| N 4580 | U 7794 | Sc/Sa | SABa? | 12.49 | 0.719(45) | 16.6 | 1.3 | 23 | 195 | … | … | … | … |
| N 4606 | U 7839 | Sa pec | SBa: | 12.69 | 0.438(67) | 16.6 | 1.2 | 47 | 255 | … | … | … | … |
| N 4639 | U 7884 | SBb | SABbc | 12.19 | 0.669(49) | 16.6 | 0.18 | 67 | 202 | 20 3 | 274 | 81 | |
| N 4647 | U 7896 | Sc | SABc | 12.03 | 0.809(37) | 16.6 | 0.43 | 57 | 253 | 13 2 | 25 5 | 132 | 49 |
| N 4651 | U 7901 | Sc | SAc | 11.36 | 0.642(51) | 16.6 | 0.28 | 92 | 355 | 30 4 | 30 4 | 304 | 101 |
| N 4654 | U 7902 | SBc | SABcd | 11.14 | 0.629(52) | 16.6 | 0.05 | 101 | 363 | 23 2 | 24 4 | 273 | 97 |
| N 4689 | U 7965 | Sc | SAbc | 11.55 | 0.819(36) | 16.6 | 0.57 | 64 | 505 | … | … | … | 51 |
| N 4694 | U 7969 | Amorph | SB0 pec | 12.19 | 0.755(42) | 16.6 | 0.81 | 25 | 403 | … | … | … | … |
| N 4698 | U 7970 | Sa | SAab | 11.53 | 0.500(62) | 16.6 | 0.14 | 247 | 705 | … | … | … | 89 |
| N 4713 | U 7985 | SBc | SABd | 12.21 | 0.656(50) | 16.6 | 0.35 | 63 | 174 | 25 5 | 182 | 35 | |
| N 4772 | U 8021 | … | SAa | 11.89 | 0.500(62) | 16.6 | 0.07 | 72 | 424 | … | … | … | … |
| N 4808 | U 8054 | Sc | SAbc: | 12.56: | 0.391(70) | 16.6 | 0.68 | 65 | 194 | 16 1 | 3510† | 152 | 71 |
Note. — †Scale lengths with measurement errors larger than 20%. Scale length fit produced a negative or zero value (clearly unphysical).
N 578 & UA 18 Sc SABc 11.17 0.574(57)26.2 0.14 104 353 42 3 50 5 27 2 …
N 613 413G11 SBb SBbc 10.53 0.799(38)23.9 0.06 101 633 … 305 …
N 628 U 1149 Sc SAc 9.76 0.857(32)7.3 0.11 242 72310010 11010 80 4 …
N 925 U 1913 SBc SABd 9.97 0.629(52)9.1 0.01 220 665 90 5 1301012020 …
N 986 299G7 SBb SBab 11.45 0.743(43)32.2 0.40 82 383 … …5020†…
N 1087 U 2245 Sc SABc 10.97 0.616(53)23.5 0.04 60 312 … …204 73
N 1169 U 2503 SBa SABb 10.86 0.682(48)34.4 0.25 103 323 12050† 74
N 1232 547G14 Sc SABc 10.38 0.848(33)25.8 0.07 182 555 7510 12010 555 165
N 1249 155G6 SBc SBcd 11.64 0.500(62)17.4 0.05 137 403 21 1 29 2 305 148
I 356 U 2953 …SAab pec 10.17 0.719(45)14.6 0.47 184 8110 4010†8255010 …
N 1637 UA 93 SBc SABc 11.25 0.755(42)11.7 0.24 96 304 31 4 40 5281 …
N 1832 M-0314010 SBb SBbc 11.59 0.669(49)30.8 0.32 39 171 6020† 6040†184† 77
N 2090 363G23 Sc SAc 11.45 0.484(63)15.7 0.07 203 … … … …96
N 2196 UA 121 Sab SAab 11.38 0.682(48)36.8 0.44 112 315 462 10030†412 74
… U 3580 …SAa pec: 12.20 0.469(64)18.7 0.24 100 283 245† 11 2313 39
N 2403 U 3918 Sc SABcd 8.43 0.559(58)3.2 … 544 110410010 11010…
N 2525 UA 135 SBc SBc 11.55 0.643(51)25.5 0.08 69 305 … 154†…
N 2608 U 4484 Sbc SBb 12.53 0.573(57)31.2 0.36 38 202 … … ……
N 2712 U 4708 SBb SBb: 12.19 0.500(62)26.4 0.01 69 192 2010† 82
N 2715 U 4759 Sc SABc 11.09 0.342(74)21.0 0.08 123 353 7210 43 5608 124
N 2805 U 4936 …SABd 11.17 0.755(42)25.6 0.05 181 605 72 4 10020 8510 …
N 2841 U 4966 Sb SAb 9.58 0.454(65)10.8 0.13 251 584 62 5 14030†625 179
N 2903 U 5079 Sc SBd 9.11 0.515(61)8.9 0.07 147 686 31 4 40 5 353 …
N 3031 U 5318 Sb SAab 7.39 0.515(61)3.6 0.99 565 16010600200† 300100† 140
N 3198 U 5572 Sc SBc 10.21 0.358(72)13.7 0.14 247 505 7010 9515 65 5 196
N 3329 U 5837 Sab SAb: 12.57 0.559(58)27.2 … 53 203 15 1 8 2†151 62
N 3359 U 5873 SBc pecSBc 10.68 0.643(51)16.0 0.22 176 432 46 2 43 3 451 213
N 3627 U 6346 Sb SABb 9.13 0.500(62)9.4 0.46 145 7010 … 33 2312 …
N 3673 UA 236 SBb SBb 11.81 0.500(62)31.6 0.04 124 3333620† 424 76
N 3705 U 6498 Sb SABab 11.25 0.423(68)16.5 0.67 141 322 31 5 30 5 32 1 83
N 3887 UA 246 SBbc SBbc 11.19 0.766(41)20.2 0.21 100 273 25 4 118
N 4395 U 7524 Sd SAm 10.57 0.777(40)4.0 0.13 178 13020 … … ……
N 4597 M-0132034 SBc: SBm 12.21 0.423(68)17.4 0.23 123 406 12060† 109
N 4800 U 8035 Sb SAb 12.13 0.766(41)20.2 0.21 40 195 10 1 10 2 101 39
N 4984 M-0234004 Sa SAB0+ 12.03 0.755(42)21.3 0.76 35 404 … … ……
N 5248 U 8616 Sbc SBbc 10.63 0.574(57)18.5 0.11 265 408 30 3 355 …
N 5334 U 8790 SBc SBc: 11.62 0.719(45)22.2 0.11 115 404 45 1 45 2 44 1 98
N 5377 U 8863 SBa SBa 11.94 0.530(60)25.5 0.32 110 355 28 3 375 55
N 5448 U 8969 Sa SABa 11.72 0.423(68)28.8 0.16 126 263 43 5 372 52
N 5457 U 8981 Sc SABcd 8.21 0.934(21)6.7 … 744 1401016020 1602015020 …
N 5669 U 9353 SBc SABcd 11.79 0.707(46)21.6 0.27 115 314 31 5 45 536 3 75
N 6118 U 10350 Sc SAcd 11.26 0.438(67)25.3 0.10 106 405 35 5 5510354 …
N 6181 U 10439 Sc SABc 11.77 0.454(65)35.2 0.33 57 141 16 2 142 57
N 6643 U 11218 Sc SAc 11.14 0.485(63)22.8 0.06 79 303 22 4 22 4224 74
N 7098 48G5 …SABa 12.23 0.574(57)37.5 0.83 126 424 72 5 725 …
N 7141 189G7 …SABbc 12.21 0.707(46)47.7 … 114 324 5010 …
N 7177 U 11872 Sb SABb 11.47 0.682(48)18.1 0.04 98 173 30 8† 272 56
N 7217 U 11914 Sb SAab 10.53 0.883(29)15.0 0.54 84 384 … 456 52
I 5240 290G2 SBa SBa 12.29 0.643(51)29.8 0.13 79 243 7020†…
I 5273 346G22 SBc SBcd: 11.55 0.602(55)22.2 0.08 60 312 … 23 4234 …
N 7448 U 12294 Sc SAbc 11.50 0.454(65)32.8 0.38 66 162 28 5 25 5135† 57
Note. — †Scale lengths with measurement errors larger than 20%. Scale length fit produced a negative or zero value (clearly unphysical).
Appendix A Scale Length Fits