Comparison of air fluorescence and ionization measurements of E.M. shower depth profiles: test of a UHECR detector technique
Abstract
Measurements are reported on the fluorescence of air as a function of depth in electromagnetic showers initiated by bunches of 28.5 GeV electrons. The light yield is compared with the expected and observed depth profiles of ionization in the showers. It validates the use of atmospheric fluorescence profiles in measuring ultra high energy cosmic rays.
keywords:
air fluorescence , electromagnetic shower , ultra-high energy cosmic raysPACS:
96.40.-z , 96.40.Pq , 95.55.Vj , 98.7.Sa , 32.50.+d,
1 Introduction
This paper reports on the study of the longitudinal profile of air fluorescence light in electromagnetic showers. It is part of a program intended to provide an experimental basis for the use of atmospheric fluorescence in imaging showers from ultra-high energy cosmic rays (UHECR).
The cosmic ray spectrum above eV (1.6 Joules per particle) is not well understood from either the theoretical or experimental point of view[1]. Mechanisms that could lead to these energies have been postulated, either by acceleration from very energetic sources[2] or by decay of primordial super heavy particles[3], but strong supporting evidence remains to be reported. At the same time, the spectrum reported by the AGASA detector[4], an array of scintillators covering 100 square km at ground level, is both more intense and extends to higher energy than that of the atmospheric fluorescence detector, HiRes[5]. At least the former result appears to violate the cutoff in the spectrum expected from interactions with the cosmic microwave background, the GZK effect[6] at about eV. Further experiments are needed to clarify the situation, and to enhance the presently very limited statistics. There are several under consideration, in planning or under construction[7]. All of these include at least a fluorescence measurement system for atmospheric showers.
An important aspect of the studies that are needed is to test the energy calibration of the detectors. At eV this obviously cannot be done directly, and a case must be assembled by examining the performance of the separate aspects of the techniques. The initiating cosmic rays interact high in the atmosphere and the secondaries interact again, at lower altitude, in higher density air. Quickly a shower is built up which is dominated by an electromagnetic cascade of the descendants of the prolifically produced neutral pions. Such showers are well studied in the GeV range accessible to accelerators, and the UHECR shower is different largely in its enormous spatial extent and the number of electrons, positrons and gamma rays. After the shower has become established, the flux of low energy Bremsstrahlung gamma rays outnumbers the electrons and positrons by an order of magnitude. Pair production from the gamma rays feeds down into the energy spectrum of the charged tracks, which propagate in the energy range where their cross-section is at its minimum, that is between the regions where Bremsstrahlung and ionization processes dominate. The electron-positron spectrum is maintained similar in shape in all showers, independent of initial energy, aside from the relatively sparsely populated high energy tail[8]. The spectrum is principally dependent on the shower age, where is the depth into the shower, and the depth at shower maximum[9]. UHECR showers may be viewed as a vast superposition of showers reinitiated by electrons and gamma rays of a wide range of low energies. Studies of showers initiated by accelerator beams are immediately applicable to them.
The electrons and positrons of the shower transfer energy to the atmospheric atoms by the usual mechanism described by the Bethe-Bloch equation[10], leading to fluorescence. The energy deposited in the air is a function of the energy of the shower particle, but, over most of the shower length, the bulk of the energy transfer is from tracks with tens of MeV energy. The atoms, excited to various levels, lose energy by emission of light, or by collisional processes which are pressure dependent. The fraction of the excitation appearing as fluorescence, over the range of pressure up to high altitude, is the subject of investigations complementary to the present study[11].
The light may be detected, even at ranges beyond 30 km, in a low-background wavelength window between 300 and 410 nm. In this range it is dominated by nitrogen emission lines, with major bands near 315, 337, 355, 380 and 391 nm, (95% of the light) and a few others of lesser intensity[11]. The atmospheric fluorescence detectors image the profile of the light by focusing it, using arrays of spherical mirrors, on to photomultiplier tubes[5]. Light outside the intended wavelength range is excluded by using an optical filter. A correction is needed for the Rayleigh scattering of the long range light. This effect depends on the inverse fourth power of the wavelength. As an example, an uncertainty of 25% in the strength of the line at 391 nm relative to the rest of the spectrum would mean a 10% uncertainty in the energy estimate of a shower at 30 km.
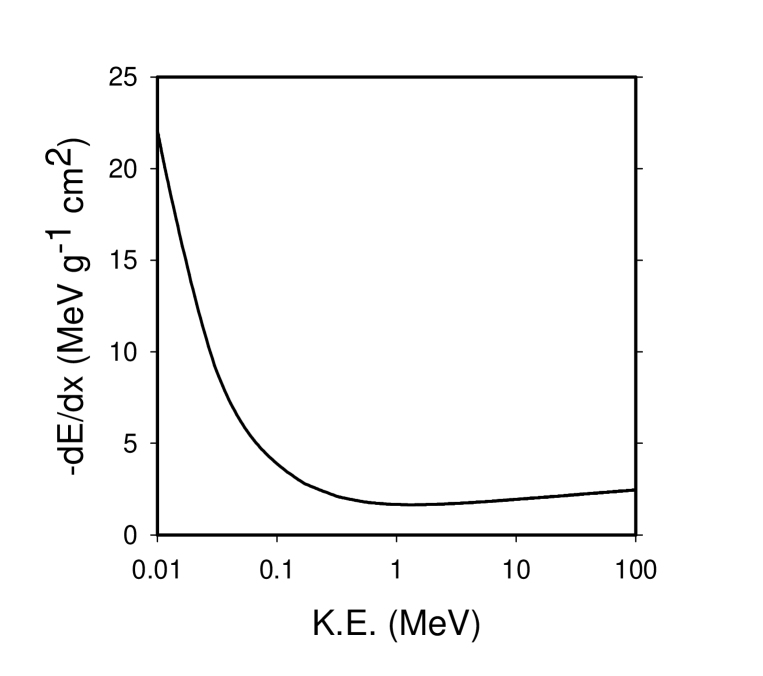
Aspects of the technique that are under experimental testing by various groups are the absolute yield of light in the relevant wavelength band, and its spectrum, as a function of atmospheric pressure. This is done at several fixed electron beam energies[11]. Of course, energy loss to the gas atoms is a function of the energy of the charged shower particles, changing rapidly below the minimum that occurs at about 1.5 MeV[10], Fig. 1. For this reason, the work discussed here makes use of actual showers to examine the precision with which simulations of shower development and energy loss, and actual ionization measurements, agree with the profile as measured using the fluorescent light.
2 Experimental Method
The work described here is a study of the longitudinal shower profile in the beam at the Stanford Linear Accelerator Center (SLAC) FFTB facility, using electrons delivered at 10 Hz in 5 ps long bunches at 28.5 GeV. By recording signals only at the correct time, the difficulties with photomultiplier dark noise, experienced by experiments using radioactive sources, are eliminated. Since the energy deposited in a shower is primarily from the low energy electrons, the effect of beam energy is only to affect linearly the total energy deposit, and to change logarithmically the depth of penetration of the shower. The effective spectrum, at a depth expressed as a shower age, is not significantly affected by the initial energy. The material in which the shower develops affects its ratio of width to depth, and also determines the energy below which ionization becomes the dominant energy loss mechanism.
As a practical and economic way of simulating the effect of air, we have chosen to use a commercially available alumina ceramic. The material, delivered in brick form, is Al2O3 with 10% SiO2. The measured mean density was 3.51 g cm-3. The radiation length, 28 g cm-2, is just 24% less than that of air, and the critical energy, below which ionization energy loss dominates, is 54 MeV, compared with 87 MeV for air. It is the closest practical approach to simulating air that we have encountered for our beam energy. Although high atomic number materials have much shorter radiation lengths, and so would be much more compact and easier to work with, the shower parameters would be very different from those of air. In the case of lead, for example, the radiation length is 6.4 g cm-2, and the critical energy is 7.3 MeV. We considered that the use of high atomic number materials would introduce a very different balance between radiative processes and ionization energy losses, and results would be much less directly comparable with the air shower fluorescence profile.
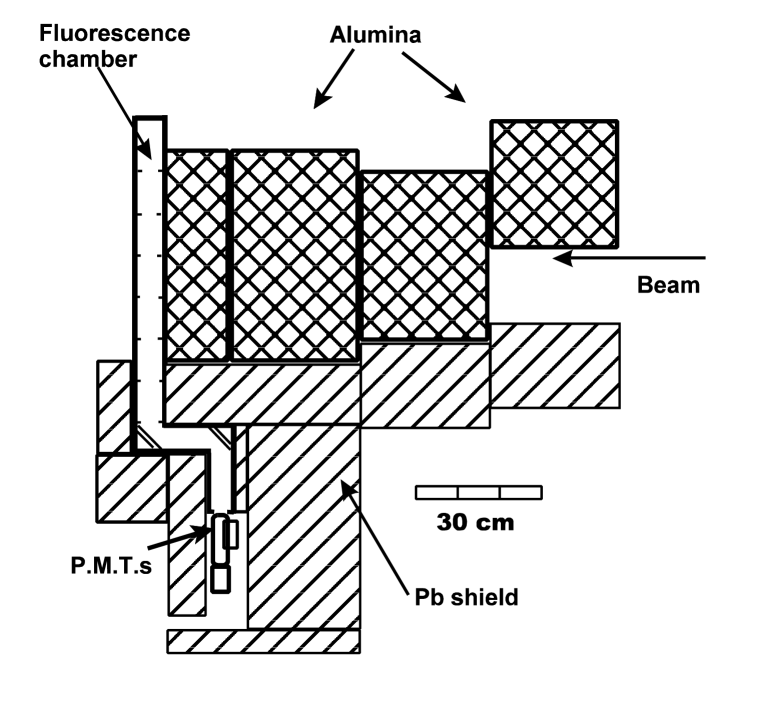
A schematic view of the apparatus is shown in Fig. 2. It was installed in a gap in the electron beam vacuum pipe. The electron beam exited through a thin window. The alumina was contained in a line of four aluminum boxes that could remotely and independently be moved on or off the beam line. The bricks were stacked as tightly as practical, and positioned and oriented to eliminate longitudinal cracks between them in the shower core. The downstream block was approximately 2 radiation lengths (15 cm) thick, by 50 cm wide, and the air fluorescence detector was placed immediately behind it. Each of the upstream blocks was 4 radiation lengths thick. This arrangement permitted thicknesses of approximately 0, 2, 6, 10 and 14 radiation lengths to be selected, with negligible gaps, immediately in front of the detector. In this way the longitudinal profile of an electromagnetic shower could be developed, in a relatively homogeneous, compact medium, on the rising edge, the peak, and twice along the tail. In addition, thickness of 4, 8 and 12 radiation lengths could be studied, but in this case there was a 15 cm air gap in front of the detector, and the downstream alumina block, which could only be extracted 6 cm beyond the beam line, partially occluded the shower tail.
The shower particles leaving the alumina immediately entered the detector volume, where they caused a flash of fluorescence in the layer of air at atmospheric pressure. The detector was in the form of a flat rectangular aluminum box, its air space 6 cm thick along the beam direction, and with vertical dimension, 50 cm, matching the alumina. In order to allow the electron beam to pass through with minimal scattering for tests and set-up, the aluminum walls were thinned to 25 microns for a diameter of 7.8 cm about the beam.
Some of the light traveled towards a vertical row of photomultiplier tubes mounted on one side. It was necessary to take steps to suppress the accidental collection of the forward going Cherenkov light from the air as well as fluorescence light scattered from the walls. After wall scattering, these would have an uncertain spectrum and collection efficiency. The suppression was done in the standard way, using a set of 1 cm wide vertical baffles on the front and back walls, and all surfaces, except mirrors and photomultiplier tube (PMT) apertures, were covered with black flock material[16].
In order to shield the PMTs from ionizing radiation from the showers, the light path was built with two 90 degree reflections[17], as seen in Fig. 2. After these, at a horizontal path length of 91 cm from the beam line, there were apertures for the PMTs. This design allowed for a wall of lead to protect the PMTs from the radiation emitted from the side walls of the alumina, or from scattering sources nearby. The minimum thickness of the lead was 25 radiation lengths.
The tubes used were 38 mm diameter, hexagonal window, 8-stage, XP3062[18]. They were spare units from the HiRes detector, and had been characterized using the same equipment used for HiRes. There were 6 PMTs in a vertical row, but numbers 2 and 5 were permanently hooded in order to sample the background signals from ionizing radiation on every pulse. The pulses were amplified by 10 using standard NIM pulse amplifiers.
The periscopic light path and PMTs could be optically isolated from the fluorescence volume by means of a shutter plate, slid into place by hand. Data runs taken with the shutter out were matched routinely by runs with the shutter inserted, in order to estimate the strength of background signals, for example from higher energy neutrons emanating from the shower, or from upstream beam scraping.
In front of the PMT faces was a transverse slot that allowed optical filters to be inserted or removed so that either the full HiRes filter passband (300 - 410 nm), or restricted passbands at selected wavelengths, could be studied on any of the open face tubes. For the data reported here PMT 6 did not have a HiRes filter. Also on the walls of the cylinders containing the PMTs were light emitting diodes that were pulsed between beam pulses to monitor gain stability.
Behind the air fluorescence chamber there was space for exchanging equipment to measure aspects of the ionization in the showers. The transverse profile was recorded using a standard beam scintillation screen. By means of mirrors, the light was imaged by a CCD camera in a heavily shielded enclosure, and data collected by a remote screen-capture system. Alternatively, a flat plate ion chamber could be installed to measure the shower longitudinal charge profile.
The ion chamber was designed for the high radiation and ionization levels, and wide dynamic range, encountered after the shower media. It used 11 active gaps, nominally 0.9 mm thick, with plates based on printed circuit board covering the 50 cm square active width of the air fluorescence chamber. The gas was helium at 1 atmosphere, and the applied voltage, 140 V/mm, was chosen to maximize the clearing field and electrode charge without leading to gas gain. All anodes were connected electrically, as were all cathodes. Their signals were read out without amplification.
The PMT, ion chamber signals, and toroid signals to monitor the beam pulse intensity were recorded using a standard CAMAC gated ADC system. For the PMTs, the gate was set to close 20 ns after the start of the PMT pulses. This timing cut, while retaining the prompt fluorescence signal, excluded signals from neutrons of energy less than 200 MeV interacting in the PMTs. (Some neutrons, mostly below 20 MeV, produced by photonuclear interactions of shower gamma rays in the alumina, could penetrate the shielding to reach the PMTs.) Additional data acquired were PMT high voltage levels and temperatures. During runs, typically of pulses, occasional triggers were imposed to measure ADC pedestals, and to pulse the set of LEDs used for monitoring PMT gains.
The beam intensity was varied over the range to electrons per pulse, a factor of 100 below the designed operating range, and not detectable by the standard beam instrumentation. The available beamline feedback systems could not be used. Nonetheless, as measured by the specially amplified toroid signal, adequate stability was achieved.
Note that the energy in the superimposed showers, to eV per pulse, happened to be in the UHECR range of interest. By comparison with the HiRes detector, the PMTs were mounted at close range, but a large area light collecting concave mirror was not used, and depth slices corresponding to less than of the shower depth profile were observed at any one time.
Changes in atmospheric pressure and humidity were obtained from a nearby weather station. The air fluorescence volume was effectively open to the atmosphere, whose pressure varied by 0.17% during the shower profile measurements reported below. During the optical filter measurements the variation was 0.5%. The molecular fraction of water vapor varied in the range 1.7 - 1.8% during the profile measurements, which would have affected the light yield by less than 0.25%. For the filter data set, the range was 1.7 - 1.9% .
3 Shower ionization profiles
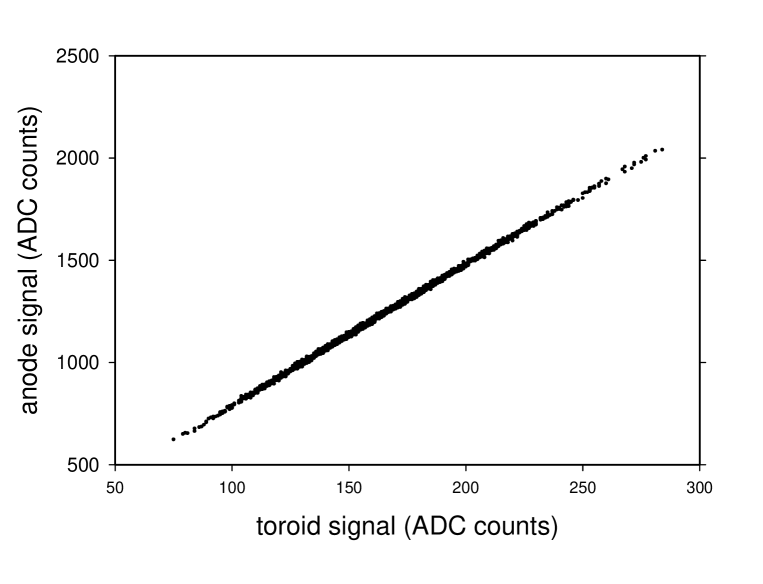
For each thickness of alumina, the ion chamber signals were plotted pulse by pulse against the toroid signals. Because of the concern about non-linear performance at the high intensities in the core of the showers, the correlation plot was tested with polynomial fits from first to third order. Third order was found not to be necessary. The quadratic fit was selected if the second order coefficient was statistically significant at more than 1.5 standard deviations. An example of the correlation at 6 radiation lengths is seen in Fig. 3. The coefficients of the linear terms were taken as proportional to the ionization in the chamber from the shower. For systematic checks, three different configurations of gate lengths and terminations of the cathode cables were used. The shower profiles from each of these configurations were quite compatible and were averaged. The differences at each alumina thickness were taken as an indication of systematic uncertainty.
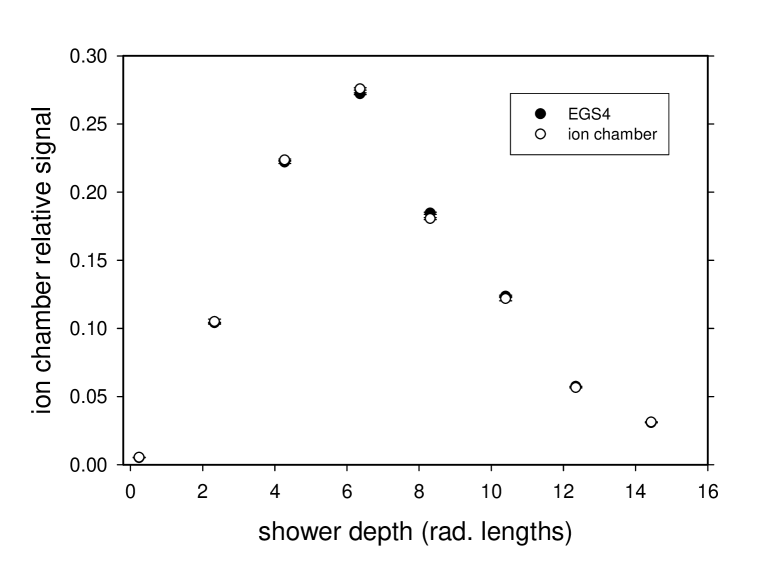
The resulting longitudinal shower profile is shown in Fig. 4. The data taken with the compact alumina arrangements (0, 2, 6, 10, 14 rad. lengths) and the sets with the air gap (4, 8, 12 rad. lengths) are both shown. The entries are normalized so that their sum across the profile is unity.
This part of the experiment has been modeled using the EGS4 shower simulation code[12]. An independent study using the Geant3 code[13] gave consistent results. Layers represented included the upstream beam window, air gaps as appropriate, the boxes of alumina, the fluorescence detector volume and the ion chamber. Back-scattering from beamline elements downstream was found not to be important. For the sake of efficiency in the simulations, each alumina box was represented as a single simulation entity. Its total radiation length, including the aluminum containing walls, and accounting for the fine cracks between bricks by measuring a sample, was represented as a block of the alumina-silica mixture with density scaled as needed. The density changes from nominal were -0.4% for the thicker blocks and -0.8% for the downstream block. Also in the interests of keeping the computation time practical, the ionization in the ion chamber helium was taken to be proportional to the shower energy deposited in the full body of the chamber, dominated, of course, by the plates which contributed 0.12 rad. lengths to the thickness.
A comparison between the data and the dead-reckoning EGS4 simulation may be made in Fig. 4. A closer view is illustrated in Fig. 5, where, at each thickness point, the ratio between simulation and observation is plotted. The RMS deviation of the ratio values is 1.9%, and the discrepancies are better than 4% at all thicknesses. For the purposes of the present work, this is an adequate validation of the simulation of the longitudinal profile.
We considered the possibility that neutrons from photonuclear interactions, in the alumina or the body of the chamber, were contributing to the signals. The neutron production was simulated using FLUKA[14]. This was folded with a value reported for the sensitivity of the helium to neutrons[15]. It was found that the signal fraction from neutrons in the worst case, 14 radiation lengths, was and so could be neglected.
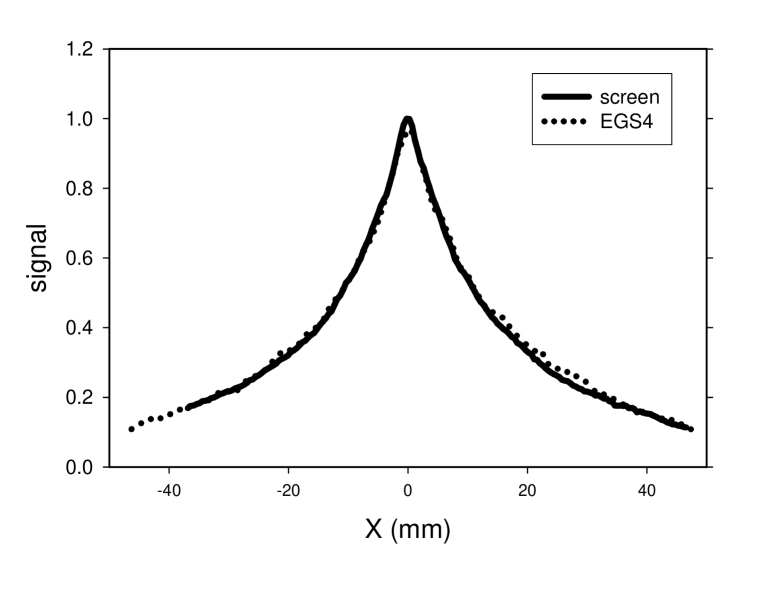
The transverse spreads of the showers are exemplified by the 10 radiation lengths case in Fig. 6. The figure compares the results of the EGS4 model with a profile from the scintillation screen and camera. The agreement in the transverse distribution, although not perfect, is quite satisfactory for our purposes. The transverse containment of the showers by the fluorescence and ion chambers was evidently well modeled by the simulations. Even at this depth in the shower, the characteristic sharp central peak remains. It is this peak that gives rise to the small non-linear effects in the ion chamber.
4 Air fluorescence measurements
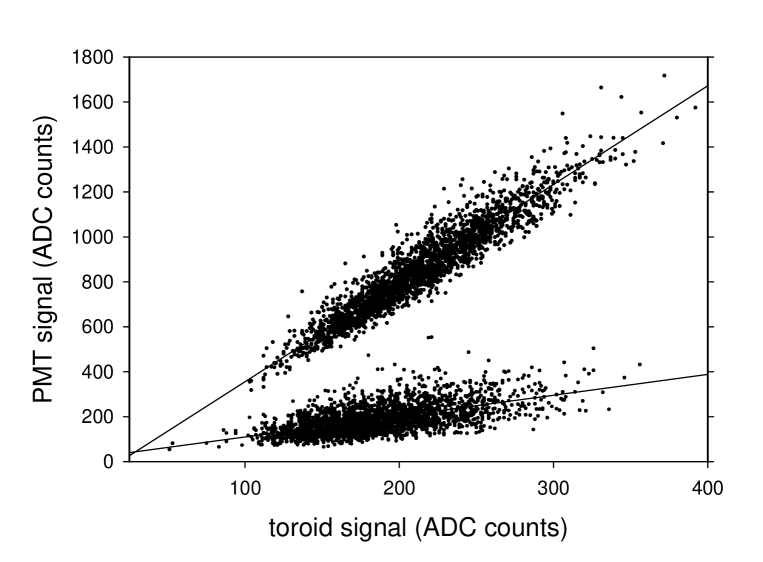
A plot of the digitized signal from PMT number 4 against the beam intensity, as read from the toroid, is shown for 6 radiation lengths in Fig. 7. The lower lobe of the scatter plot contains the data taken with the shutter in place to measure backgrounds. Stability of the background measurement between shutter-open and shutter-closed runs was monitored using the hooded PMTs, numbers 2 and 5. In this data set, pedestal and gain variations, checked for by using the special triggers, were small and could be ignored. The relative gains of all tubes were known and approximately matched.
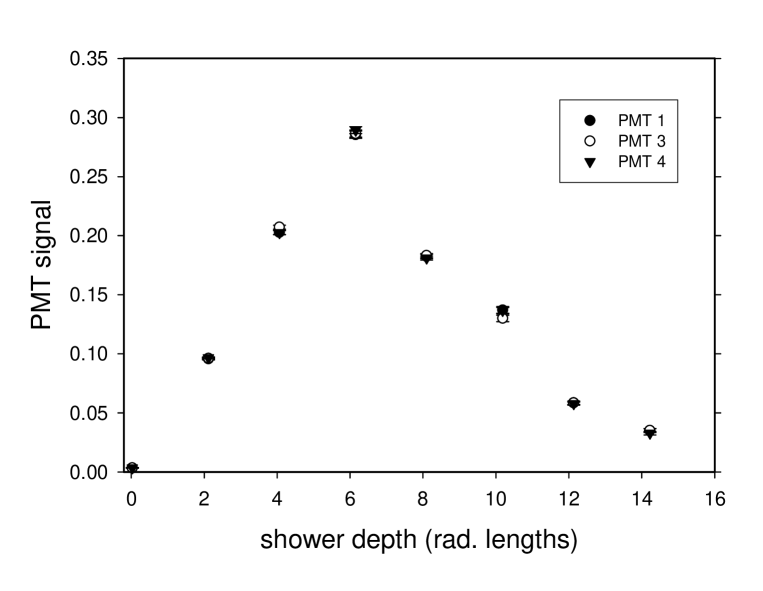
Straight line fits were made to the data points. A cut was applied to remove the few weak beam pulses because of a known non-linearity in the toroid electronics near pedestal. Constraining the data through the effective beam-off points made little difference. In order to address concerns of possible non-linearities in the PMT response (“saturation”), PMT pulse heights were restricted by the stratagem of limiting the toroid values, i.e. beam intensities. The intensities chosen for each plot corresponded to PMT average pulse heights that were expected to deviate from linearity by less than 2%. To check the fits for sensitivity to this restriction, various widely different values for the toroid upper limits were tried. For limits varying by a factor of 2, the slope measurements varied on average by less than 1%, except for the very weak signal at near-zero thickness, which varied by 11%. These variations in slope have been taken as systematic uncertainties and included in the overall error estimates. After these corrections and uncertainty estimates, the signal yields of the three PMTs using the HiRes filters are shown in Fig. 8 for the range of shower depths.
Using the same thickness parameters as for the ion chamber simulation, EGS4 runs were also made to simulate the energy deposit in the sensitive air space in the fluorescence detector. In this case the energy deposit was weighted with factors to account for the “sawtooth” shape of the volume seen by the PMTs (because of the baffle edges), PMT optical solid angle factors, and an approximation for the change in filter transmission with angle of the light. Acceptance differences between the photomultipliers were found to be small. The ion chamber, absent during the fluorescence data taking because of concerns about back scattering, was not included in this simulation.
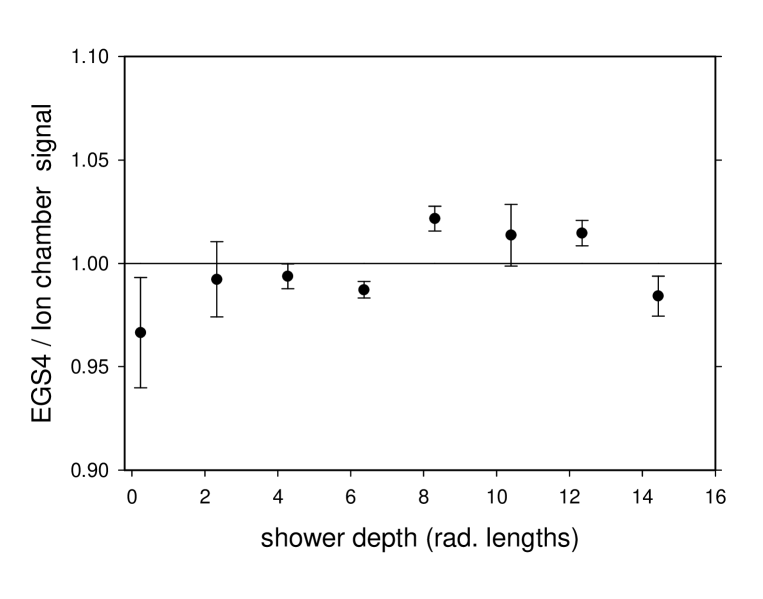
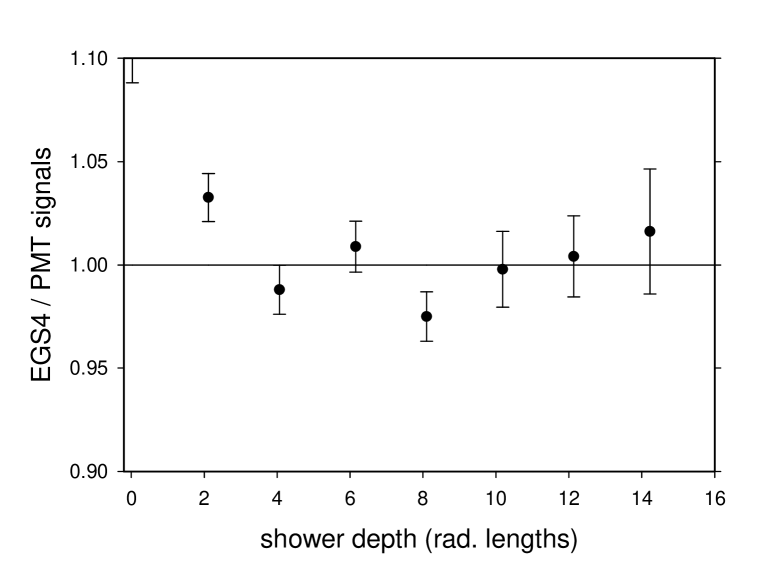
The ratio of the EGS4 simulation to the weighted average of the PMT signals is shown in Fig. 9. As usual, for each depth profile, the sum of the signals is normalized to unity, and the profiles are not fitted against each other. Aside from the points at minimal shower depth, where the very weak signals have large uncertainties, the data agree with the simulations within a few percent. Comparable results were obtained from the independent simulation using Geant3.
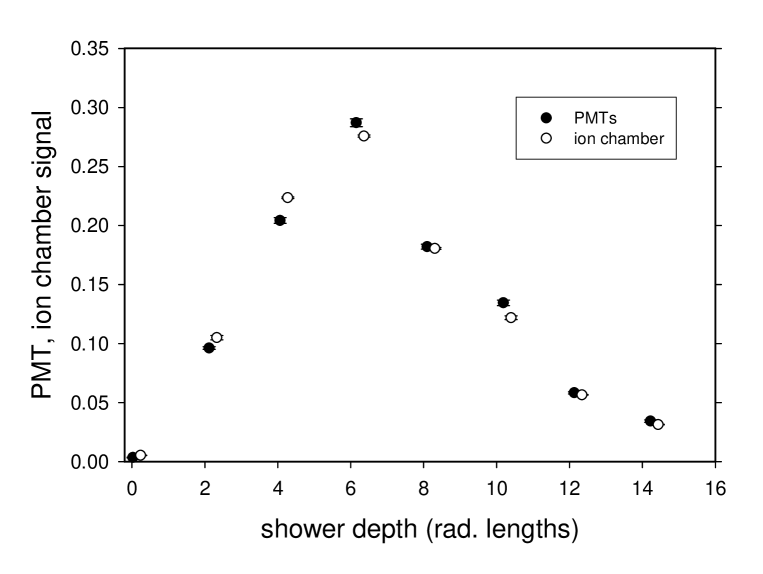
Excluding the point at minimal thickness, the rms offset from unity of the points in the EGS4:PMT ratio plot is 1.9%, or 1.7% if weighted by the signal intensity. That is, the light yield follows the energy deposit simulations to this accuracy. Since the simulations were validated by comparison with ionization deposit, it may be of interest to plot the light and ionization longitudinal shower profiles together. This is seen in Fig. 10, where the light profile (the average of the three PMTs), and the ion chamber profile measured at a slightly different shower depth, are independently normalized to sum to unity.
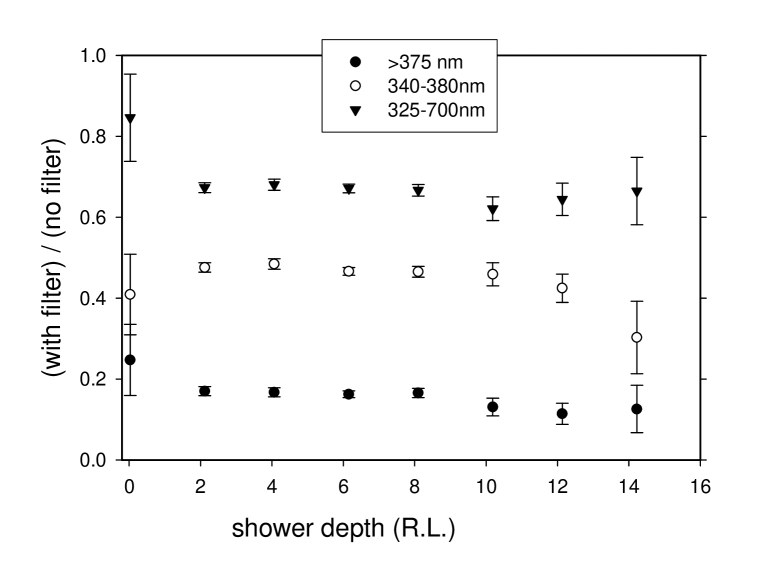
Some data were also taken with bandpass optical filters in front of the PMTs. These were intended to restrict the light transmission to selected combinations of nitrogen emission lines [11]. The ratios of bandpass signals to wide-band signal are shown in Fig. 11. Despite the much reduced light levels and therefore increased background sensitivity, the plots are evidence that the emission spectrum is not altered significantly at different depths in the shower.
5 Conclusions
The measurements reported here confirm the validity of the technique of imaging and measuring electromagnetic showers in the atmosphere using fluorescent emission from the air. The technique can be extended to examine different initiating particles, and to make benchmark tests of the simulation codes to higher precision than needed here. It may be desirable to do so in the future as an aid to the interpretation of future advanced UHECR detectors.
6 Acknowledgements
We thank the staff of the accelerator operations group for their skill in delivering the unusual beam so efficiently, and the personnel of the Experimental Facilities Dept. for their dedication and hard work in preparing and installing the infrastructure of this experiment. We also thank the technical staffs at the universities for their substantial efforts. The work was supported in part by the U.S. Department of Energy, contract DE-AC03-76SF00515 and by the National Science Foundation under awards NSF PHY-0245428, NSF PHY-0305516, NSF PHY- 0307098 and NSF PHY-0400053.
References
- [1] G. Sigl, Ann. Phys. 303 (2003) 117.
- [2] E. Waxman, Phys. Rev. Lett. 75 (1995) 386; M. Vietri, Astrophys. J. 453 (1995) 883; T.K. Gaiser, F. Halzen and T. Stanev, Phys. Rep. 258 (1995) 173; K. Mannheim, Astropart. Phys. 3 (1995) 295;
- [3] M. Birkel and S. Sarkar, Astropart. Phys 9 (1998) 297; P. Battacharjee, C.T. Hill and D.N. Schramm, Phys. Rev. Lett. 69 (1992) 567; R.J. Protheroe and T. Stanev, Phys. Rev. Lett. 77 (1996) 3708; M. Birkel and S. Sarkar, Astropart. Phys. 9 (1998) 297; P. Battacharjee and G. Sigl, Phys. Rep. 327 (2000) 109.
- [4] M. Takeda et al., Astrophys. J. 522 (1999) 225.
- [5] R. Abbasi et al., Phys. Rev. Letters 92 (2004) 151101.
- [6] K. Greisen, Phys. Rev. Letters 16 (1966) 748; V.A. Kuzmin, G.T. Zatsepin, Pisma Zh. Eksp. Teor. Fiz. 4 (1966) 114, JETP Letters 4,78.
- [7] J. Abraham et al., Nucl. Instr. Meth. A 523 (2004) 50; M. Fukushima, Institute for Cosmic Ray Research Mid-Term (2004-2009) Maintenance Plan Proposal Book “Cosmic Ray Telescope Project”, Tokyo Univ., (2002); L. Scarsi et al., Proc. 27th International Cosmic Ray Conf., Copernicus Gesellschaft, Hamburg, (2002) 175; J, Linsley, Proc., 26th International Cosmic Ray Conf., Univ. Utah, Salt Lake City, (1999), Vol. 2, 423.
- [8] M. Risse and D. Heck, Astropart. Phys. 20 (2004) 661; F. Nerling et al., Proc. 28th International Cosmic Ray Conf., Universal Academy Press (2003) 611; C. Song et al., Astropart. Phys 14 (2000) 7.
- [9] A. Hillas, J. Phys. G 8 (1982) 1461.
- [10] For a summary and references, see Particle Data Group, Phys. Letters B592 (2004), 242.
- [11] F. Kakimoto et al., Nucl. Instr. Meth. A 372 (1996) 527; M. Nagano et al., Astropart. Phys. 22 (2004) 235; J. Belz et al., SLAC Experimental Proposal E-165 (2002); J. Belz et al., SLAC-PUB- 11254, July 2005, submitted to Astropart. Phys.
- [12] W.R. Nelson, H. Hiragama and D.W.O. Rogers, ”The EGS4 Code System”, SLAC-265, Stanford Linear Accelerator Center (1985).
- [13] CERN Applications Software Group, Geneva, Switzerland (1993).
- [14] A. Fasso et al., Proc Monte Carlo 2000 Conference, Lisbon 2000, Springer Verlag, Berlin (2001) 159, 955; A. Fasso et al., Proc. Conference for Computing in High Energy and Nuclear Physics (CHEP 2003), La Jolla, California, e-Print Archive physics/0306162.
- [15] D. Indurthy et al., Nucl. Instr. Meth. A 258 (2004) 731.
- [16] Edmund Optics, Barrington, NJ08007 U.S.A., www.edmundoptics.com.
- [17] Nova Phase Inc., Newton, NJ07860, U.S.A., www.novaphase.com.
- [18] Photonis, Brive La Gaillard, France, www.photonis.com.