The Nature of the Density Clump in the Fornax Dwarf Spheroidal Galaxy
Abstract
We have imaged the recently discovered stellar overdensity located approximately one core radius from the center of the Fornax dwarf spheroidal galaxy using the Magellan Clay 6.5m telescope with the Magellan Instant Camera (MagIC). Superb seeing conditions allowed us to probe the stellar populations of this overdensity and of a control field within Fornax to a limiting magnitude of R=26. The color-magnitude diagram of the overdensity field is virtually identical to that of the control field with the exception of the presence of a population arising from a very short (less than 300 Myr in duration) burst of star formation 1.4 Gyr ago. Coleman et al. have argued that this overdensity might be related to a shell structure in Fornax that was created when Fornax captured a smaller galaxy. Our results are consistent with this model, but we argue that the metallicity of this young component favors a scenario in which the gas was part of Fornax itself.
1 Introduction
Our understanding of the complexity of the star formation histories of dwarf spheroidal (dSph) galaxies has advanced with each new telescope and detector improvement. Dwarf spheroidal galaxies were first thought to have the same stellar populations, and total masses, as globular clusters, with the only difference being the larger physical size of the spheroidals. The discovery of carbon stars in these systems (Westerlund 1979; Demers & Kunkel 1979; Aaronson & Mould 1980; Cannon et al. 1981; Aaronson et al. 1982, 1983), and the realization that the peak luminosity of populations of C stars was an age indicator (Mould & Aaronson 1979; Aaronson & Mould 1980; Aaronson & Mould 1985 and references therein) showed that dwarf spheroidals had, in fact, much more complicated star formation histories. The first color-magnitude diagram to reach the main sequence of a dSph (Mould & Aaronson 1983) spectacularly confirmed the youth of a major fraction of the stars in Carina. Subsequent observations have shown that other dSph’s have diverse populations: some have large or dominant populations significantly younger than those of Galactic globulars, for instance, Carina (Mould & Aaronson 1983, Smecker-Hane et al. 1996; Hurley-Keller et al. 1998 ), Leo I (Gallart et al. 1999a, 1999b), and Fornax (Stetson et al. 1998, Saviane et al. 2000) (see the schematic star formation histories in Mateo 1998). Others have less pronounced intermediate-age populations, while Ursa Minor (Olszewski & Aaronson 1985), with almost 100% ancient stars, is the closest to a globular-like population. Given the physical properties of dSph galaxies, even star formation of the first population of stars in dwarf spheroidals is difficult to understand, but the problem of multiple generations of stars has led to several potential solutions for quenching or restarting star formation (Lin & Faber 1983; Silk et al. 1987; Burkert & Ruiz-Lapuente 1997; Mashchenko et al. 2004).
Dwarf spheroidals not only have complex star formation histories, but are more complex than globulars structurally, with radial profiles (from star counts) that are not well fit by simple one-component King models. Besides this global structural difference, some dSph’s have demonstrable asymmetries (Stetson et al. 1998) or substructure. Olszewski & Aaronson (1985) showed that the distribution of stars at the center of Ursa Minor was not smooth. This Ursa Minor “cluster” has been rediscovered several times (e.g., Demers et al. 1995), along with other star-count bumps in UMi (Demers et al. 1995, Kleyna et al. 2003) and similar structures in other dwarf spheroidals (Eskridge 1988a,b; Kleyna et al. 2004). Recently, it has been argued that some of these density enhancements have kinematic properties that differ from those in typical fields in these dSph’s (Kleyna et al. 2003, 2004). Certainly, some special property of these higher stellar density regions seems necessary, for one or both of the dynamical mixing times and the crossing times, yr, are short compared to the age of the stars in the clump, yr.
Coleman et al. (2004, 2005) have recently probed substructure in Fornax, showing that a density enhancement (hereafter known as the “clump”) at about the core radius of Fornax contained a population of younger-than-average stars. They have also shown that Fornax may have shells rather like those in giant ellipticals, speculating that Fornax itself suffered a collision with a smaller halo system. This collision created the outer shells discovered in Coleman et al. (2005) and led to star formation that generated the clump in Fornax. In this way Fornax may have served as a “detector” to reveal the existence of a low-mass halo system, possibly gas-rich and star-free, that otherwise may have remained invisible. The Local Group is apparently deficient in small halos when compared to simulations of the formation of structure (e.g., Moore et al., 1999, Klypin et al., 1999).
Since Fornax has no neutral gas today (Knapp et al. 1978, Young 1999), one class of solutions to a fairly recent burst of star formation is to speculate a gas-rich collider. This collider could equally well be a hydrogen cloud, a smaller version of the sort recently discovered by Minchin et al. (2005), or a high-velocity cloud. We of course would want to know how much gas, and the etymology of that gas, there was in Fornax during the actual star formation episodes, but aside from counting stars of various ages and assuming a star formation efficiency, there seems to be no way to know the gas mass at various ages. Knapp et al. (1978) quoted a very low current H I mass from observations centered at a heliocentric velocity (badly known at the time) of 35 km s-1 6.7 km s-1, which does not overlap the mean stellar velocity of 53 3 km s-1 (compiled in Mateo 1998, Walker et al. 2005). A more recent measurement of H I gas in Fornax concludes that no emission or absorption is detected to limits of about 1018–1019 cm-2 (Young 1999), which corresponds to a mass of 104–105 M⊙ within the 26 arcmin ( kpc) VLA observation. Using a density of 1019 cm-2, the roughly 100100 pc stellar overdensity could be hiding roughly 2000 M⊙ of potentially star-forming gas even today. This is a very frustrating limit because it is similar in magnitude to the mass of stars in the Fornax clump. This limit invites the opposite of the Coleman et al. speculation: perhaps gas did not need to be delivered to Fornax, but was compressed and shocked into forming stars. Indeed it is possible that Fornax could contain significant amounts of warm (T K) ionized gas (cf. Gallagher et al. 2003), though Gizis et al. (1993) give an upper limit of M⊙ for any hot (T K) diffuse gas in Fornax. We await more sensitive surveys of the diffuse interstellar medium in Fornax as they may hold the key to understanding how multiple generations of star formation occur in dSphs.
2 Observations and Data Reduction
The photometric observations were carried out on Dec 22 and 23 (UT), 2003 using the Magellan Instant Camera (MagIC, see Osip et al. 2004 for a brief description) on the Magellan/Clay Telescope at Las Campanas Observatory. While we observed at Las Campanas with another instrument, problems with that instrument caused us to switch to the MagIC Camera, which is always mounted and running, and available with a shift of the tertiary mirror. This ability saved two excellent nights, and allowed us to probe the Coleman et al. (2004) clump to unprecedented depth. MagIC contains a single SITe CCD with 24 micron pixels. This corresponds to a scale of 0.069 arcsec per unbinned pixel. Unless noted, all of the exposures used in this study were read from the CCD unbinned. For this project we used a Johnson B filter and a Kron-Cousins R filter (see Sung & Bessell (2000), and references therein to older Bessell publications, for a definition of the characteristics of these passbands). Each field was observed on both nights.
Seeing was superb on these nights, averaging 0.3-0.4 arcsec. As both nights were photometric, we obtained data for Stetson (2000)111 see the URL http://cadcwww.hia.nrc.ca/standards for updated lists of standard fields and stars. standards throughout the run. The Stetson fields extend Landolt (1983, 1992) fields and also provide new fields, for instance, stars in Fornax itself. These standard-field raw data were binned at the telescope during readout to speed up the calibration observations. We measured all standard-star images using IRAF/qphot222IRAF is the Image Reduction and Analysis Facility, a general purpose software system for the reduction and analysis of astronomical data. IRAF is written and supported by the IRAF programming group at the National Optical Astronomy Observatories (NOAO) in Tucson, Arizona. NOAO is operated by the Association of Universities for Research in Astronomy (AURA), Inc. under cooperative agreement with the National Science Foundation. in apertures of 10, 12, and 15 pixels radius, correcting all 10 pixel photometry to 15 pixel photometry (4 arcsec diameter, a factor of 10 larger than the seeing in the program fields) using a single aperture correction per field. The initial transformations of the measured instrumental magnitudes and colors to the calibrated magnitudes and colors were essentially identical for both nights. We therefore decided to combine all of the standards from both nights into one dataset from which we determined one transformation. The resulting transformation equations are
and
where X is the airmass of observation. The lower-case terms represent the instrumental values (corrected to one-second exposure time) and the upper case are the values as taken from Stetson’s online catalog. Standard deviations of individual standard-star observations about these equations are 0.017 mag for magnitude and 0.016 mag for color.
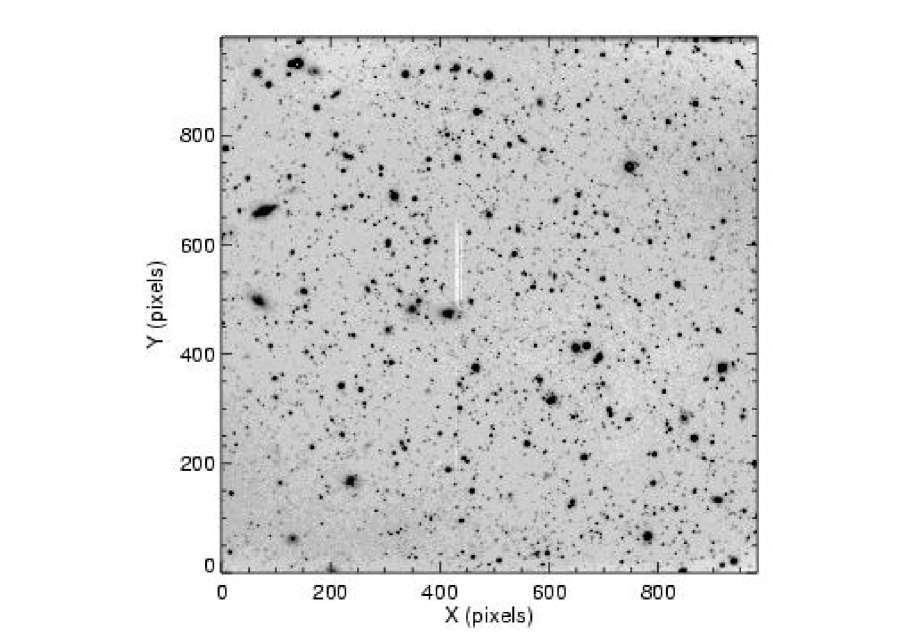
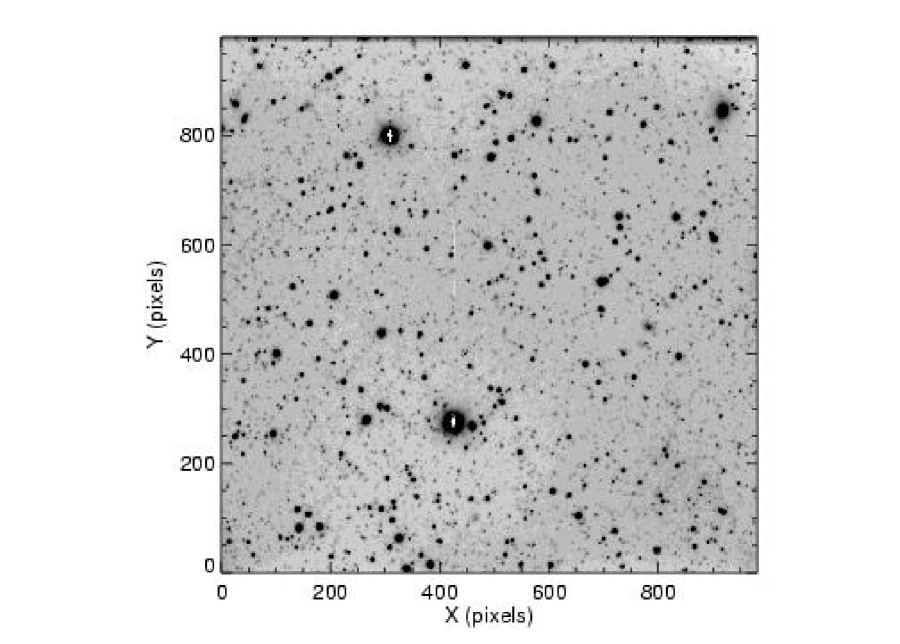
Two fields were observed in the Fornax dSph galaxy. One was centered on the local overdensity identified by Coleman et al. (2004) and the other was positioned at an approximately diametrically opposite position relative to the center of Fornax. The latter is our ‘control’ field. For the principal Fornax clump field we obtained nine 900-sec B images and nine 600-sec R images. For the control field we obtained nine 900-sec B images and eight 600-sec R images. Shorter exposures, of length 30–90 sec, were also obtained in both fields. The individual long-exposure images were shifted to a common coordinate system (using only integer pixel shifts), and combined using a sigma-clip to remove the effects of cosmic rays. These combined images, with a total exposure of 2.25 hours in B and 1.5 hours in R for the clump field and 2.25 hours in B and 1.33 hours in R for the control field, have full-widths-at-half-maximum between 0.4 and 0.5 arcsec in both filters and fields. A summary of all exposures is given in Table 1. Figures 1 and 2 are images of the clump and control fields. Tables 2 and 3, which contain coordinates and photometry, are truncated in the print edition of this paper; the full Tables are available in the electronic version. RA and Dec are reported from coordinates derived using IRAF tasks TFINDER and CCTRAN using approximately 50 USNO-B1 stars (Monet et al. 2003333We used the online data available at http://www.nofs.navy.mil/ ) in each 2.32.3 arcmin field; the solutions to the standard stars had a scatter of about 0.2 arcsec in each coordinate. Photometry is excellent to R=26 mag; typical internal psf-fitting errors of the artificial stars (section 2.1) are 0.01-0.015 mag to R=21.5, 0.03-0.04 mag at R=23-25, and 0.05-0.06 mag at R=25.5-26.5. The resultant color-magnitude diagrams are reminiscent of WFPC2 data of similar exposure time (for example Gallart et al. 1999a), and show the strengths of ground-based imaging on modern, large telescopes designed to deliver excellent image quality.
| Fieldaa“Stetson” refers to standard fields available at CADC. | Filter | Date (UT) | Exposure | bbtotal number of images | Airmass |
|---|---|---|---|---|---|
| Time (sec) | Range | ||||
| Fornax Clump | B | 2003/12/22-23 | 900 | 9 | 1.01-1.13 |
| Fornax Clump | R | 2003/12/22-23 | 600 | 9 | 1.01-1.10 |
| Fornax Clump | B | 2003/12/22 | 30 | 1 | 1.02 |
| Fornax Clump | B | 2003/12/23 | 90 | 3 | 1.01 |
| Fornax Clump | R | 2003/12/22 | 30 | 1 | 1.01 |
| Fornax Clump | R | 2003/12/23 | 60 | 3 | 1.01 |
| Fornax Control | B | 2003/12/22-23 | 900 | 9 | 1.19-1.77 |
| Fornax Control | R | 2003/12/22 | 600 | 8 | 1.15-2.01 |
| Fornax Control | B | 2003/12/23 | 90 | 3 | 1.12 |
| Fornax Control | R | 2003/12/23 | 60 | 3 | 1.12-1.13 |
| Stetson Fornax 983 field | B | 2003/12/22-23 | 30 | 12 | 1.10-2.09 |
| Stetson Fornax 983 field | R | 2003/12/22-23 | 12 | 12 | 1.10-2.13 |
| Stetson E5 S72 field | B | 2003/12/23 | 30 | 3 | 1.14 |
| Stetson E5 S72 field | R | 2003/12/23 | 12 | 2 | 1.13 |
| Stetson NGC2818-S92 field | B | 2003/12/22-23 | 30 | 6 | 1.01 |
| Stetson NGC2818-S92 field | B | 2003/12/23 | 20 | 3 | 1.01 |
| Stetson NGC2818-S92 field | R | 2003/12/22 | 12 | 6 | 1.01 |
| Stetson NGC2818-S92 field | R | 2003/12/23 | 10 | 4 | 1.01 |
| Star | X | Y | ||||||
|---|---|---|---|---|---|---|---|---|
| 1 | 2:40:33.91 | -34:42:52.3 | 369.58 | 1.35 | 24.513 | 0.028 | 0.603 | 0.050 |
| 3 | 2:40:33.93 | -34:41:51.8 | 804.74 | 1.95 | 25.176 | 0.062 | 0.643 | 0.082 |
| 2 | 2:40:33.93 | -34:41:46.4 | 843.74 | 1.95 | 25.190 | 0.062 | 1.325 | 0.118 |
| 5 | 2:40:33.93 | -34:41:41.2 | 880.87 | 2.35 | 25.750 | 0.105 | 0.372 | 0.143 |
| 4 | 2:40:33.88 | -34:43:28.6 | 109.41 | 2.35 | 25.528 | 0.189 | 0.659 | 0.220 |
| 6 | 2:40:33.90 | -34:42:56.4 | 340.41 | 2.39 | 23.945 | 0.030 | 0.513 | 0.036 |
| 7 | 2:40:33.88 | -34:43:23.2 | 148.11 | 2.80 | 22.976 | 0.017 | 1.050 | 0.028 |
| 8 | 2:40:33.91 | -34:42:03.5 | 720.28 | 3.04 | 25.661 | 0.103 | 0.950 | 0.155 |
| 11 | 2:40:33.91 | -34:42:01.6 | 733.79 | 3.36 | 23.091 | 0.022 | 0.240 | 0.024 |
| 13 | 2:40:33.90 | -34:42:32.1 | 514.59 | 3.59 | 24.247 | 0.043 | 0.721 | 0.059 |
| Star | X | Y | ||||||
|---|---|---|---|---|---|---|---|---|
| 2 | 2:39:25.20 | -34:21:10.2 | 640.99 | 0.21 | 23.271 | 0.012 | 1.206 | 0.022 |
| 3 | 2:39:25.21 | -34:20:46.7 | 810.26 | 0.24 | 21.768 | 0.019 | 1.431 | 0.033 |
| 4 | 2:39:25.19 | -34:21:04.8 | 680.36 | 0.87 | 24.463 | 0.035 | 0.731 | 0.053 |
| 5 | 2:39:25.19 | -34:21:04.8 | 680.33 | 0.89 | 24.453 | 0.035 | 0.742 | 0.053 |
| 6 | 2:39:25.19 | -34:21:04.7 | 680.53 | 0.90 | 24.371 | 0.050 | 0.828 | 0.064 |
| 7 | 2:39:25.18 | -34:22:13.2 | 185.28 | 0.98 | 24.435 | 0.037 | 0.675 | 0.065 |
| 11 | 2:39:25.19 | -34:20:55.4 | 747.45 | 1.52 | 22.566 | 0.006 | 0.754 | 0.011 |
| 12 | 2:39:25.19 | -34:20:54.6 | 753.50 | 1.69 | 18.796 | 0.006 | 1.821 | 0.411 |
| 13 | 2:39:25.17 | -34:21:20.6 | 566.36 | 1.84 | 25.196 | 0.069 | 0.794 | 0.107 |
| 14 | 2:39:25.17 | -34:21:23.1 | 548.37 | 1.87 | 20.968 | 0.006 | 1.201 | 0.009 |
2.1 Photometry and False-Star Tests
The photometry of both Fornax fields was measured using DoPHOT (Schechter et al. 1993), a psf-fitting routine used to obtain precise photometry with minimal user intervention and at high computation speed. All frames were binned 2x2 before running DoPHOT because the full width of even 0.4 arcsec images is of order 7 pixels. We carried out a series of false-star tests to allow us to estimate the photometric completeness and precision empirically as a function of position within the color-magnitude diagram (CMD). These parameters are needed for later analysis. Numerically-generated stars were added to the deep B and R images at a specified position and with specified R magnitudes and (B–R) colors. The photometric properties of these false stars were chosen to lie uniformly in the range , and . The locations of the stars were chosen to lie on a regular grid in the original image with each false star separated by 10 seeing diameters from its nearest false neighbor. This step maximizes the number of stars added to each image while ensuring that false stars only affect, and are only affected by, images of actual stars in the Fornax fields. In adding these stars we explicitly took into account the photometric transformations, the position offsets between the images, the variation of the PSF with position on the B and R images independently, and the variations of the aperture corrections with position and brightness on both images. A total of 500 stars were added to each of 50 pairs in each field, corresponding to 25,000 false stars for each field. These images were then reduced with DoPHOT in precisely the same manner as the original images. Stars from these reductions were then matched, by position, with the false star input positions. The injected magnitudes in B and R, and the recovered measured magnitudes were then compared. Stars that were not detected in both false-star images were flagged; these cases help us define the completeness of the photometry.
3 Results and Conclusions
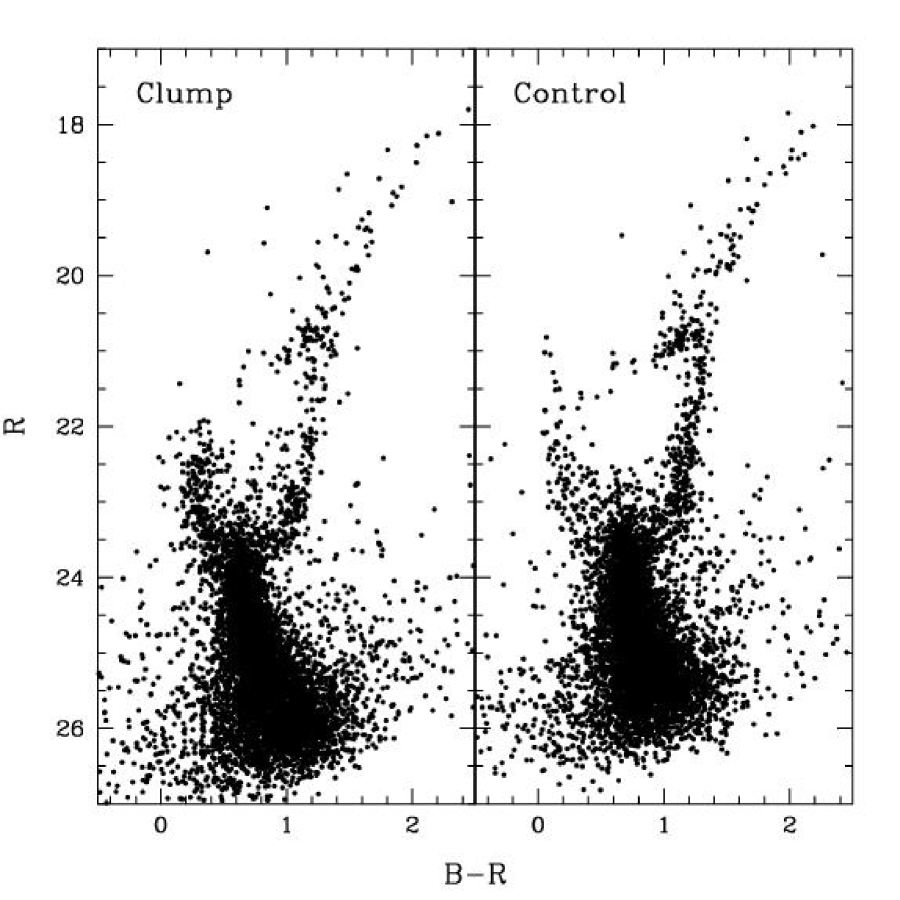
The resulting color-magnitude diagrams for both the principal and control fields are shown in Figure 3. These CMDs are made by combining the deep photometry with the shallow photometry. Approximately 6000 stars are plotted in each field.
A reddening correction of E(BV)0.02 (Schlegel et al. 1998) needs to be applied to these data before extracting astrophysical information. In addition, to match the principal older components in the clump and control cmds, a color offset of mag was applied to the clump field and an offset of mag was applied to the control field. These offsets are within the errors of the photometric solution coupled with the errors in the aperture correction from psf magnitude to total magnitude.
Some well-known features of Fornax are visible in Fig. 3, including the extended and somewhat broad (in color) giant branch, the mostly-red horizontal branch and helium-burning clump, as well as a few additional blue horizontal branch stars at slightly fainter mean R magnitudes. Each diagram also shows that most stars in these fields come from a population with a main-sequence turnoff at . The well-defined subgiant branches emanating from that turnoff region show significant breadth in magnitude and color, indicating that this population likely exhibits a significant age and metallicity spread.
All of these features in the two fields match quite well with the exception of the main sequence stars brighter than about R=23.5 mag, the younger main sequence, extending to from the older MS turnoff point at . Although there are such stars in the control field – indicative of a pervasive intermediate-age population in that field and perhaps across Fornax (Stetson et al. 1998)– these bluer main-sequence stars define a clearer and sharper distribution in the clump field. Coleman et al. (2004) identified these stars in their original description of the clump, finding an age, from a rough analysis of a Hess diagram of the clump with statistical subtraction of the Fornax field, of approximately 2 Gyr for this younger population. Their available photometry was insufficiently deep to allow Coleman et al. to define this population of stars more precisely.
The first qualitative conclusion is thus that the clump contains an excess of younger main sequence stars, consistent with the original analyses of Coleman et al. (2004, 2005). This region of Fornax experienced significant star formation more recently than the control field. The control field nevertheless contains young stars, indicating that Fornax has had some star formation until recent times (Stetson et al. 1998). Some of the control-field stars might be younger than any in the clump, but we argue below that the clump contains a significant burst of intermediate-age star formation.
The control field was chosen to lie at the diametrically opposite point as the clump field through the center of Fornax, but does not lie precisely on the same isopleth as the clump field. Estimating from the star counts of Eskridge (1988a,b) and of Irwin & Hatzidimitriou (1995), we find that the control stellar density to the limits of those two star count studies is a factor of approximately 1.5–2.0 larger than that of the clump field.
We can test this density difference from the CMDs themselves. A box encompassing the entire RGB and red HB gives 255 clump stars and 378 control stars, a factor of 1.48 higher in the control. The lower SGB gives 169 clump stars and 253 control stars, a factor of 1.49. These numbers are consistent with those derived from the rather coarse and shallow isopleths. The older MSTO region gives 1597 clump stars and 2033 control stars, a factor of 1.27, while the younger main sequence gives 412 clump stars and 398 control stars, a factor of 0.96. These latter two results are consistent with the fact that the clump contains an excess of younger stars. Scaling by a density factor of 1.5, the clump has a density of these younger stars roughly 1.5 that of the control field.
A model inspired by Coleman et al. (2004) is that the clump is a typical region of Fornax with the additional of a burst of star formation at a younger than average age. This idea is qualitatively reasonable from Figure 3 and from our own star counts. We test this idea more carefully by determining a quantitative star formation history (SFH) for each field, using the StarFISH code (Harris & Zaritsky 2001). StarFISH performs a statistical comparison between the observed photometry and model photometry, derived from theoretical isochrones and convolved with photometric errors derived from the artificial stars tests. The real distribution of photometric errors is used in StarFISH, not the average values given earlier in this paper.
Because the observed stellar populations contain a relatively small number of stars ( each), we bin the CMD plane rather coarsely ( mag) to reduce shotnoise in the SFH solution. We adopt a single, average extinction value of mag for both fields. We use the Padua isochrones (Girardi et al. 2002), and our grid of synthetic CMDs covers three metallicities (Z=0.001, Z=0.002, and Z=0.004), and ages between 100 Myr and 15 Gyr, with logarithmic age bins ().
The best-fit SFH solutions in each field are shown in Figure 4, in which we have summed over the star formation rates from our three metallicity bins to show the total star formation rate as a function of time. In Figure 5, we compare the two SFH solutions directly, after scaling the clump field solution by a normalization factor of 1.5 (see above). While the two SFH solutions are nearly indistinguishable within their confidence regions, there is a small excess in the clump population’s star formation rate at an age of 1.6 Gyr (log(age)9.2). The confidence intervals are large due to the small number statistics, and due to the fact that they also include correlated uncertainties between adjacent SFH amplitudes. We believe the actual burst of star formation in the Clump was of much shorter duration that the interval covered by the log(age)=9.2 bin (see below). However, StarFISH is only sensitive to the average SFR over the full interval of each bin. Therefore the actual instantaneous SFR during the burst was almost certainly higher than shown in Figures 4 and 5.
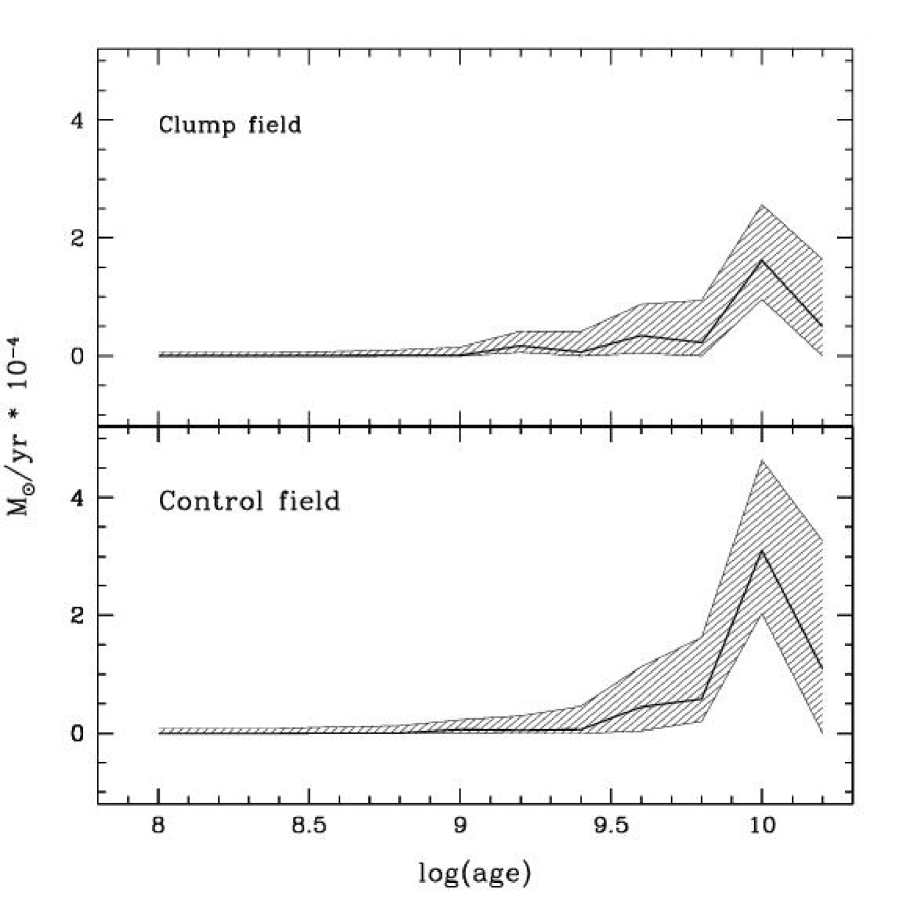
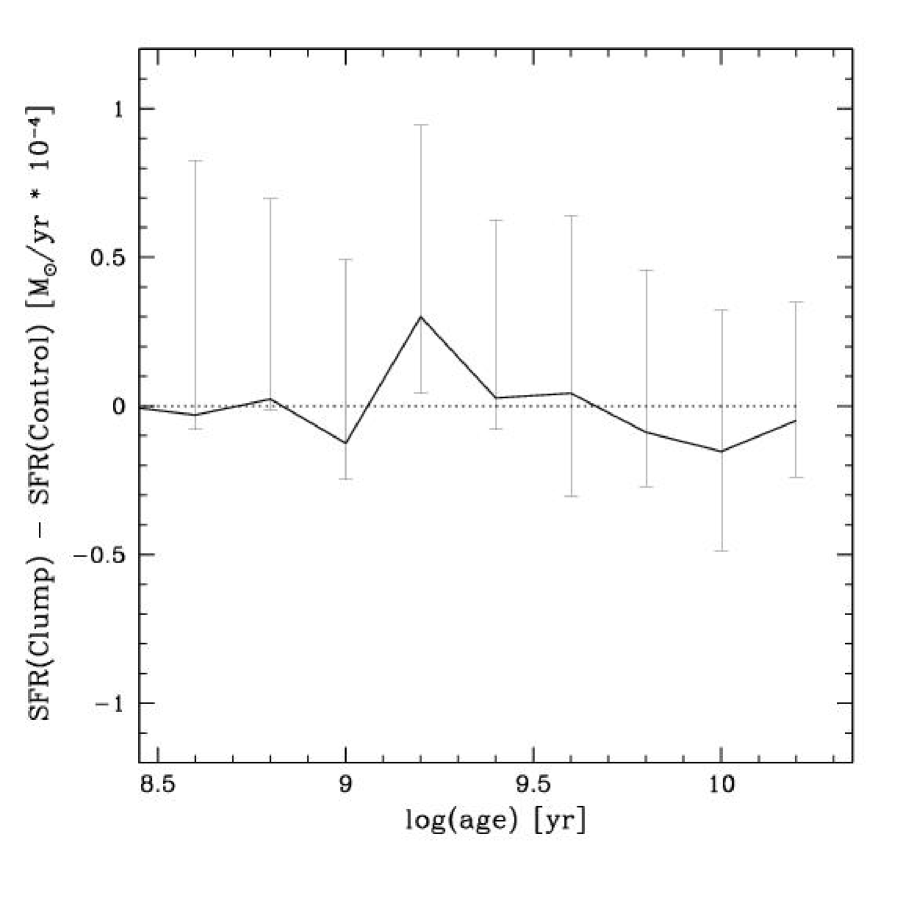
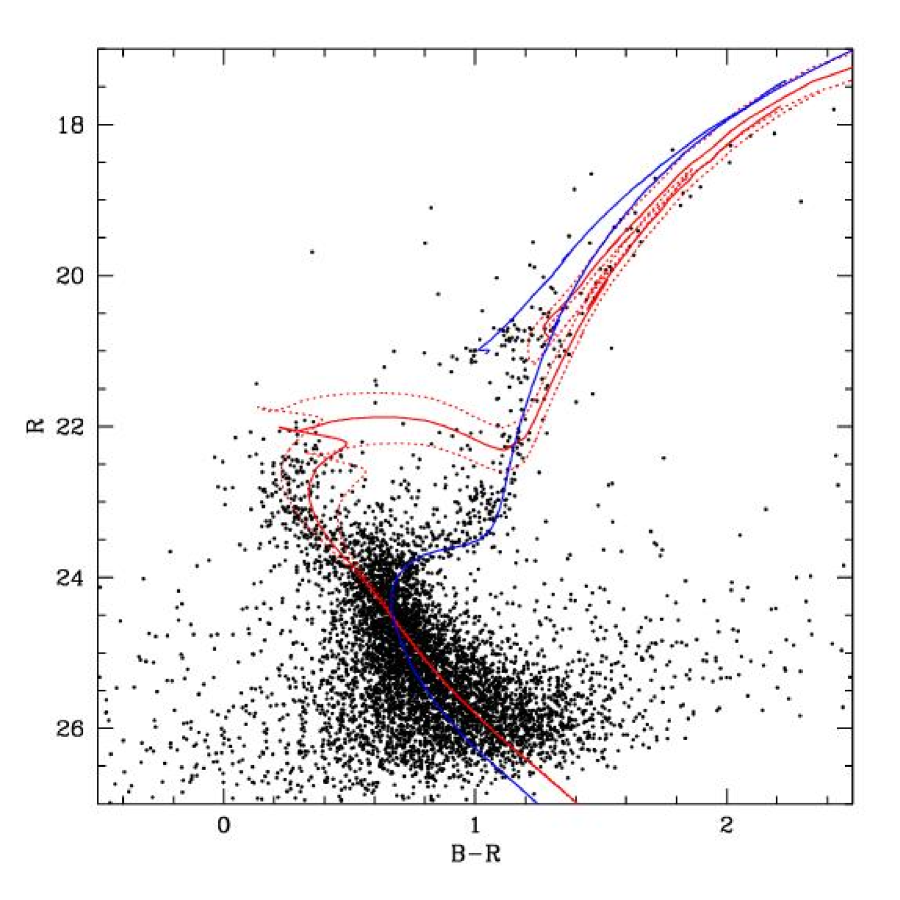
Figure 6 overlays four isochrones on the CMD of the clump field: three with z=0.004 and ages of log(age)=9.1, 9.2. 9.3, and one with log(age)10.0 and z=0.001. StarFISH estimates the star formation in bins of 0.2 in log(t), so the 9.2 bin in StarFISH encompasses the 9.1, 9.2, and 9.3 isochrones. Interpolating by eye, a good fit to the younger main sequence would be log(age)=9.15. Since this one isochrone effectively fits the younger main sequence, we can say with confidence that the burst was short, perhaps only 300 Myr in duration.
The nature of the additional population in the clump can also be seen by statistically subtracting the scaled control CMD from that of the clump. To do this, we first defined a grid of cells in the CMD in regular intervals of 0.15 and 0.5 mag in color and magnitude, respectively. Within each bin, completeness corrections from the false-star measurements were applied. As noted, the control field has more stars than the clump field. A scaling factor of 1.4, slightly different from the 1.5 derived from simple star counts above, gave the best results. With this scaling, we then statistically removed stars in the clump field located within a small distance (similar to the bin sizes) of stars selected at random from the control CMD. The method works reasonably well near the main sequence, but, due to the small numbers of stars, less effectively on the SGB and RGB. Note too that the method is quite sensitive to errors in the completeness corrections; for this reason we only trust the subtracted CMD as a useful diagnostic of the clump population for .
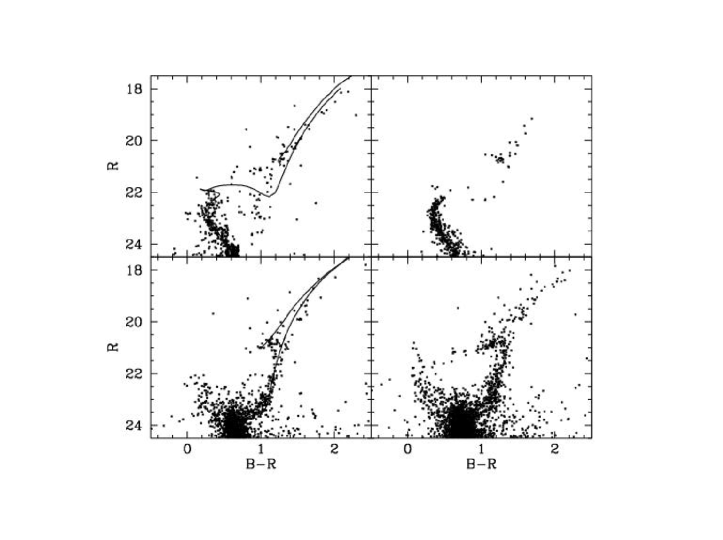
Figure 7 shows the results of this subtraction. The upper-left panel is the CMD of the clump that is different from the scaled control field. The lower-left CMD is what was actually subtracted from the left side of Figure 3, in other words the CMD of the clump that is statistically identical to the scaled and binned control CMD. The 1.4 Gyr Padua isochrone for z=0.004 is overplotted at upper left, as is the 10 Gyr isochrone for z=0.001 at lower left. At the upper right we show a synthetic CMD from the StarFISH solution at 9.1log(age)9.3. Finally, the control CMD is shown in the lower right.
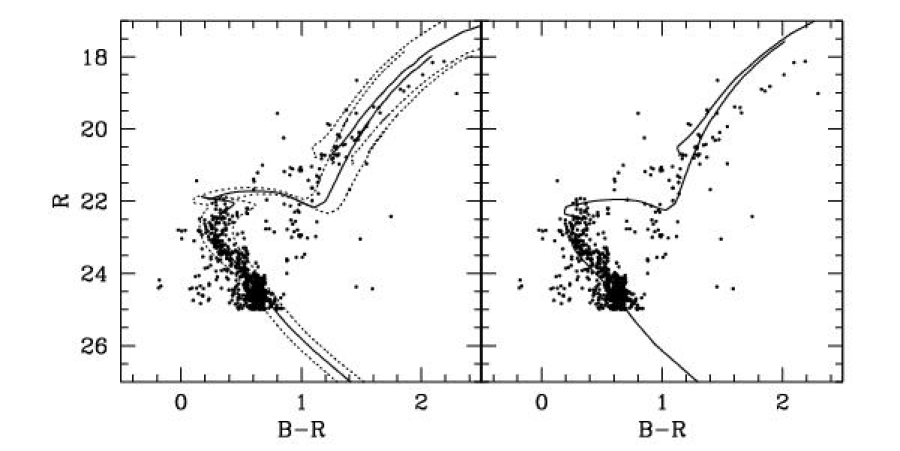
The good fit of the 1.4 Gyr isochrone to the subtracted CMD is our final way of arguing that this extra population can be called a burst of star formation. While indeed there are many places in Fornax with some young stars, this density clump is different from the control field in this one major way, the addition of a substantial number of younger stars. The characteristics of this extra population, with , imply that the gas making these stars was significantly pre-enriched. A small galaxy such as Ursa Minor would be expected to have a metallicity of roughly , [Fe/H] roughly , which is lower than the metallicity of the oldest substantial population in Fornax. Could this gas have been “Fornax gas”? Figure 8 shows (left panel) Padua isochrones for an age of 1.4 Gyr and metallicities of z 0.002, 0.004, and 0.008 ([Fe/H], , and ). The more metal-poor isochrone is not a good fit at this age. If we adopt [Fe/H] (Tolstoy et al. (2001) and allow the derived age to change to 1.8 Gyr, we get the right panel in Figure 8. This isochrone does not fit the main sequence very well, and fits the giants quite badly. For these reasons, StarFISH found only a very small metal poor population at this age, which is now confirmed by the isochrone fits to the subtracted CMD. To the extent that the Padua isochrones are on the same metallicity scale as the spectroscopic measurements, we conclude that the typical red giant in Fornax is more metal poor than the stars in the 1.4 Gyr burst. The most logical place to make this enriched gas is in Fornax itself.
The next important observation of this field would be the kinematics of stars and detailed chemical compositions in this small area of Fornax, to see if star formation history is the only major difference in this field. Of course, the questions of how Fornax retained gas until 1.4 Gyr ago, or gained gas, and why Fornax did not undergo a global burst of this intensity, and why the clump has not dynamically mixed, remain important unsolved questions.
We thank the staff at Las Campanas and Magellan for making observing at LCO a productive pleasure. EO is partially supported by NSF grants AST-0098518, 0205790, and 0507511. MM and MW are partially supported by NSF grants AST-0098661 and AST-0206081 and AST-05xxxxxx. JH is supported by NASA through Hubble Fellowship grant HF-01160.01-A awarded by the Space Telescope Science Institute, which is operated by the Association of Universities for Research in Astronomy, Inc., under NASA contract NAS 5-26555. GDC and MC are supported in part by funding from the Australian Research Council through Discovery Projects Grants DP0343156 and DP0343508.
References
- Aaronson & Mould (1980) Aaronson, M., & Mould, J. 1980, ApJ, 240, 804
- Aaronson et al. (1982) Aaronson, M., Liebert, J., & Stocke, J. 1982, ApJ, 254, 507
- Aaronson et al. (1983) Aaronson, M., Hodge, P. W., & Olszewski, E. W. 1983, ApJ, 267, 271
- Aaronson & Mould (1985) Aaronson, M., & Mould, J. 1985, ApJ, 290, 191
- Burkert & Ruiz-Lapuente (1997) Burkert, A., & Ruiz-Lapuente, P. 1997, ApJ, 480, 297
- Cannon et al. (1981) Cannon, R. D., Niss, B., & Norgaard-Nielsen, H. U. 1981, MNRAS, 196, 1P
- Coleman et al. (2004) Coleman, M., Da Costa, G. S., Bland-Hawthorn, J., Martínez-Delgado, D., Freeman, K. C., & Malin, D. 2004, AJ, 127, 832
- Coleman et al. (2005) Coleman, M. G., Da Costa, G. S., Bland-Hawthorn, J., & Freeman, K. C. 2005, AJ, 129, 1443
- Demers & Kunkel (1979) Demers, S., & Kunkel, W. E. 1979, PASP, 91, 761
- Demers et al. (1995) Demers, S., Battinelli, P., Irwin, M. J., & Kunkel, W. E. 1995, MNRAS, 274, 491
- Eskridge (1988a) Eskridge, P. B. 1988a, AJ, 96, 1352
- Eskridge (1988b) Eskridge, P. B. 1988b, AJ, 96, 1614
- Gallagher et al. (2003) Gallagher, J. S., Madsen, G. J., Reynolds, R. J., Grebel, E. K., & Smecker-Hane, T. A. 2003, ApJ, 588, 326
- Gallart et al. (1999a) Gallart, C., et al. 1999a, ApJ, 514, 665
- Gallart et al. (1999b) Gallart, C., Freedman, W. L., Aparicio, A., Bertelli, G., & Chiosi, C. 1999b, AJ, 118, 2245
- Girardi et al. (2002) Girardi, L., Bertelli, G., Bressan, A., Chiosi, C., Groenewegen, M. A. T., Marigo, P., Salasnich, B., & Weiss, A. 2002, A&A, 391, 195
- Gizis et al. (1993) Gizis, J. E., Mould, J. R., & Djorgovski, S. 1993, PASP, 105, 871
- Harris & Zaritsky (2001) Harris, J., & Zaritsky, D. 2001, ApJS, 136, 25
- Hurley-Keller et al. (1998) Hurley-Keller, D., Mateo, M., & Nemec, J. 1998, AJ, 115, 1840
- Irwin & Hatzidimitriou (1995) Irwin, M., & Hatzidimitriou, D. 1995, MNRAS, 277, 1354
- Kleyna et al. (2003) Kleyna, J. T., Wilkinson, M. I., Gilmore, G., & Evans, N. W. 2003, ApJ, 588, L21
- Kleyna et al. (2004) Kleyna, J. T., Wilkinson, M. I., Evans, N. W., & Gilmore, G. 2004, MNRAS, 354, L66
- Knapp et al. (1978) Knapp, G. R., Kerr, F. J., & Bowers, P. F. 1978, AJ, 83, 360
- Klypin et al. (1999) Klypin, A., Kravtsov, A. V., Valenzuela, O., & Prada, F. 1999, ApJ, 522, 82
- Landolt (1983) Landolt, A. U. 1983, AJ, 88, 439
- Landolt (1992) Landolt, A. U. 1992, AJ, 104, 340
- Lin & Faber (1983) Lin, D. N. C., & Faber, S. M. 1983, ApJ, 266, L21
- Mashchenko et al. (2004) Mashchenko, S., Carignan, C., & Bouchard, A. 2004, MNRAS, 352, 168
- Mateo (1998) Mateo, M. L. 1998, ARA&A, 36, 435A
- Minchin et al. (2005) Minchin, R., et al. 2005, ApJ, 622, L21
- Monet et al. (2003) Monet, D. G., et al. 2003, AJ, 125, 984
- Moore et al. (1999) Moore, B., Ghigna, S., Governato, F., Lake, G., Quinn, T., Stadel, J., & Tozzi, P. 1999, ApJ, 524, L19
- Mould & Aaronson (1979) Mould, J., & Aaronson, M. 1979, ApJ, 232, 421
- Mould & Aaronson (1983) Mould, J., & Aaronson, M. 1983, ApJ, 273, 530
- Olszewski & Aaronson (1985) Olszewski, E. W., & Aaronson, M. 1985, AJ, 90, 2221
- Osip et al. (2004) Osip, D. J., et al. 2004, Proc. SPIE, 5492, 49
- Saviane et al. (2000) Saviane, I., Held, E. V., & Bertelli, G. 2000, A&A, 355, 56
- Schechter et al. (1993) Schechter, P. L., Mateo, M., & Saha, A. 1993, PASP, 105, 1342
- Schlegel et al. (1998) Schlegel, D. J., Finkbeiner, D. P., & Davis, M. 1998, ApJ, 500, 525
- Silk et al. (1987) Silk, J., Wyse, R. F. G., & Shields, G. A. 1987, ApJ, 322, L59
- Smecker-Hane et al. (1996) Smecker-Hane, T. A., Stetson, P. B., Hesser, J. E., & Vandenberg, D. A. 1996, ASP Conf. Ser. 98: From Stars to Galaxies: the Impact of Stellar Physics on Galaxy Evolution, 98, 328
- Stetson et al. (1998) Stetson, P. B., Hesser, J. E., & Smecker-Hane, T. A. 1998, PASP, 110, 533
- Stetson (2000) Stetson, P. B. 2000, PASP, 112, 925
- Sung & Bessell (2000) Sung, H., & Bessell, M. S. 2000, Publications of the Astronomical Society of Australia, 17, 244
- Tolstoy et al. (2001) Tolstoy, E., Irwin, M. J., Cole, A. A., Pasquini, L., Gilmozzi, R., & Gallagher, J. S. 2001, MNRAS, 327, 918
- Walker et al. (2005) Walker, M. G., Mateo, M., Olszewski, E. W., Bernstein, R., Wang, X., & Woodroofe, M. 2005, AJ, submitted
- Westerlund (1979) Westerlund, B. E. 1979, ESO Messenger, 19, 7
- Young (1999) Young, L. M. 1999, AJ, 117, 1758