A wide area survey for high-redshift massive galaxies. I. Number counts and clustering of BK and ERO
Abstract
We present the results of a deep, wide-area, optical and near-IR survey of massive high-redshift galaxies. The Prime Focus Camera (Suprime-Cam) on the Subaru telescope was used to obtain imaging over arcmin2 fields, while imaging was provided by the SOFI camera at the New Technology Telescope (NTT) for a subset of the area, partly from the ESO Imaging Survey (EIS). In this paper, we report on the properties of -band–selected galaxies, identified from a total area of arcmin2 to , of which 320 arcmin2 are complete to . The selection technique was used to assemble complete samples of about 500 candidate massive star-forming galaxies (sBzKs) and about 160 candidate massive passively evolving galaxies (pBzKs) at ; and the color criterion was used to assemble a sample of about 850 extremely red objects (EROs). We accurately measure surface densities of arcmin-2 and arcmin-2 for the sBzKs and the pBzKs, respectively. Both sBzKs and pBzKs are strongly clustered, at a level at least comparable to that of EROs, with pBzKs appearing more clustered than sBzKs. We estimate the reddening, star formation rates (SFRs) and stellar masses () for the ensemble of sBzKs, confirming that to typical (median) values are , , and . A correlation is detected such that the most massive galaxies at are also the most actively star-forming, an effect that can be seen as a manifestation of downsizing at early epochs. The space density of massive pBzKs at that we derive is 20%% that of similarly massive early-type galaxies at . Adding this space density to that of our massive star forming class, sBzKs, in the same redshift range produces a closer comparison with the local early-type galaxy population, naturally implying that we are detecting star formation in a sizable fraction of massive galaxies at , which has been quenched by the present day. Follow-up optical and near infrared spectroscopy is in progress at the ESO Very Large Telescope (VLT) and at the Subaru telescope, in order to elucidate more thoroughly the formation and evolution of massive galaxies.
Subject headings:
galaxies: evolution — galaxies: high-redshift — cosmology: observations — galaxies: photometry1. Introduction
Despite the recent extraordinary progress in observational cosmology and the successful convergence on a single cosmological model, galaxy formation and evolution largely remain an open issue. One critical aspect is how and when the present-day most massive galaxies (e.g. elliptical galaxies and bulges with ) were built up and what type of evolution characterized their growth over cosmic time (e.g., Cimatti et al. 2004; Glazebrook et al. 2004, and references therein). Indeed, various current renditions of the CDM hierarchical merging paradigm differ enormously in this respect, with some models predicting the virtually complete disappearance of such galaxies by (e.g., Cole et al. 2000; Menci et al. 2002; Somerville 2004a) and other models predicting a quite mild evolution, more in line with observations (e.g., Nagamine et al. 2001; 2005; Granato et al. 2004; Somerville et al. 2004b; a direct comparison of such models can be found in Fig. 9 of Fontana et al. 2004). Moreover, models that provide an acceptable fit to the galaxy stellar mass function at may differ considerably in the actual properties of the galaxies with at , with some models predicting very few, if any, passively evolving galaxies at these redshifts, at variance with recent findings (Cimatti et al. 2004; McCarthy et al. 2004; Daddi et al. 2005a; Saracco et al. 2005).
While various CDM models may agree with each other at (where they all are tuned) their dramatic divergence with increasing redshift gives us powerful leverage to restrict the choice among them, thus aiding understanding of the physics of galaxy formation and evolution. Hence, a direct observational mapping of galaxy evolution through cosmic time is particularly important and rewarding, especially if a significant number of massive galaxies at can be identified and studied. In this regard, the critical questions concern the evolution with redshift of the number density of massive galaxies and their star formation histories, as reflected by their colors and spectral energy distributions (SEDs). These questions have just started to be addressed by various spectroscopy projects, such as the K20 survey (Cimatti et al. 2002a, 52 arcmin2), the Hubble Deep Fields (HDFs; Ferguson et al. 2000, 5.3 arcmin2 in the HDF-North and 4.4 arcmin2 in the HDF-South), the Great Observatories Origins Deep Survey (GOODS; Giavalisco et al. 2004, 320 arcmin2 in the North and South fields combined) the HST/ACS Ultra Deep Field (S. Beckwith et al. 2006, in preparation; 12 arcmin2), the Gemini Deep Deep Survey (Abraham et al. 2004, 121 arcmin2), and the extension down to of the Lyman break galaxy (LBG) project (Steidel et al. 2004, arcmin2). However, massive galaxies are quite rare and likely highly clustered at all redshifts, and hence small areas such as those explored so far are subject to large cosmic variance (Daddi et al. 2000; Bell et al. 2004; Somerville et al. 2004c). Therefore, although these observation have demonstrated that old, passive and massive galaxies do exist in the field out to , it remains to be firmly established how their number and evolutionary properties evolve with redshift up to and beyond.
To make a major step forward we are undertaking fairly deep, wide-field imaging with the Suprime-Cam on Subaru of two fields of 940 arcmin2 each for part of which near-IR data are available from ESO New Technology Telescope (NTT) observations. The extensive imaging has supported the spectroscopic follow-up with the VLT and the Subaru telescopes, for which part of the data have already been secured. The prime aim of this survey is to understand how and when the present-day massive galaxies formed, and to this end, the imaging observations have been optimized for the use of optical/near-IR multi-color selection criteria to identify both star-forming and passive galaxies at .
Color criteria are quite efficient in singling out high redshift galaxies. The best-known example is the dropout technique for selecting LBGs (Steidel et al. 1996). Besides targeting LBGs, color criteria have also been used to search for passively evolving galaxies at high redshifts, such as extremely red objects (EROs) at redshifts (Thompson et al. 1999; McCarthy 2004) and distant red galaxies (DRGs) at redshifts (Franx et al. 2003).
Recently, using the highly complete spectroscopic redshift database of the K20 survey, Daddi et al. (2004a) introduced a new criterion for obtaining virtually complete samples of galaxies in the redshift range , based on , and 111hereafter band for short imaging: star-forming galaxies are identified requiring (for convenience, we use the term sBzKs for galaxies selected in this way); and passively evolving galaxies at requiring and (hereafter pBzKs). This criterion is reddening independent for star-forming galaxies in the selected redshift range, thus allowing us also to select the reddest most dust-extinguished galaxies, together with those that are old and passively evolving. This should allow for a relatively unbiased selection of galaxies within the magnitude limit of the samples studied.
In this paper observations, data reduction and galaxy photometry are described, together with the first results on K-band selected samples of distant, high redshift massive galaxies. Compared to optical, the near-IR selection (in particular in the band) offers several advantages, including the relative insensitivity of the k-corrections to galaxy type, even at high redshift, the less severe dust extinction effects, the weaker dependence on the instantaneous star formation activity, and a tighter correlation with the stellar mass of the galaxies. Therefore, the study of faint galaxy samples selected in the near-infrared have long been recognized as ideal tools to study the process of mass assembly at high redshift (Broadhurst et al. 1992; Kauffmann & Charlot 1998; Cimatti et al. 2002a).
The paper is organized as follows: Section 2 describes the observations and the data reduction. Section 3 discusses the photometric calibration of the images. Section 4 presents the selection and number counts for EROs, sBzKs, and pBzKs. Section 5 presents the analysis of the clustering of field galaxies, EROs, sBzKs, and pBzKs. The properties of sBzKs are presented in Section 6. Finally, a brief summary is presented in Section 7. Throughout the paper, we use the Salpeter IMF extending between 0.1 and 100 and a cosmology with , and (km s-1 Mpc-1). For the sake of comparison with previous works, magnitudes and colors in both AB and Vega systems have to be used.222 The relevant conversions between Vega and AB magnitudes for this paper are , , , and .
2. Observations
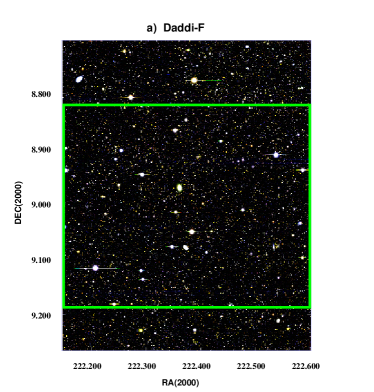
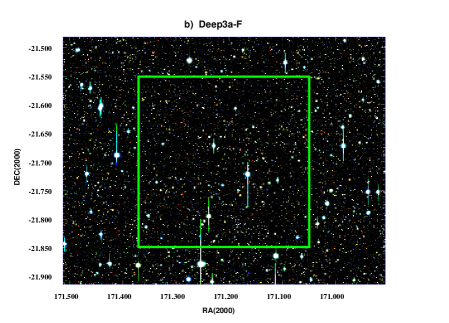
Two widely separated fields were imaged as a part of our survey: one centered at (J2000), (J2000) (hereafter Deep3a-F), and the the second, the so-called “Daddi field” (hereafter Daddi-F; Daddi et al. 2000) centered at (J2000), (J2000). Details of the optical and near-IR observations are shown in Table 1. Figure 1 shows the layout of the two areas observed.
| Filter | Telescope | Obs. date | Exps.aaExposure value for K-band images are “typical values”; see text. | Seeing | bbThe limiting magnitude (in AB) is defined as the brightness corresponding to 5 on a 2′′ diameter aperture. | Area |
| (sec) | (′′) | (mag) | (arcmin2) | |||
| Deep3a-F | ||||||
| B | Subaru | Mar.5, 03 | 3900 | 0.77 | 27.4 | 940 |
| Rc | Subaru | Mar.4-5, 03 | 7320 | 0.85 | 26.9 | 940 |
| I | Subaru | Mar.4-5, 03 | 5700 | 0.77 | 26.5 | 940 |
| z′ | Subaru | Mar.4-5, 03 | 9900 | 0.80 | 26.0 | 940 |
| J | NTT | Jan.00-Feb.01 | 3600 | 0.76 | 23.4 | 320 |
| NTT | Jan.00-Feb.01 | 4800 | 0.76 | 22.7 | 320 | |
| Daddi-F | ||||||
| B | Subaru | Mar. 5, 03 | 1500 | 0.75 | 27.0 | 940 |
| Rcc and -band data of Daddi-F are described in Daddi et al. (2000). | WHT | May 19-21, 98 | 3600 | 0.70 | 25.6 | 715 |
| I | Subaru | Mar. 5, 03 | 1800 | 0.90 | 26.0 | 940 |
| z′ | Subaru | Mar. 4-5, 03 | 2610 | 0.80 | 25.5 | 940 |
| NTT | Mar. 27-30, 99 | 720 | 0.90 | 21.5 | 600 | |
2.1. Near-IR imaging and data reduction
Infrared observations in the near-infrared passband and were obtained using the SOFI camera (Moorwood, Cuby & Lidman 1998) mounted on the New Technology Telescope (NTT) at La Silla. SOFI is equipped with a Rockwell 10242 detector, which, when used together with its large field objective, provides images with a pixel scale of and a field of view of arcmin2.
Deep3a-F is part of the ESO Deep Public Survey (DPS) carried out by the ESO Imaging Survey (EIS) program (Renzini & da Costa 1999) (see http://www.eso.org/science/eis/). The Deep3a SOFI observations cover a total area of about 920 arcmin2 in the K band, most at the relatively shallow limits of –19.5. About 320 arcmin2, the region used in the present paper, have much deeper integrations with a minimum 3600s per sky pixel (and up to 2 hr) reaching to and . The NTT - and -band images of Deep3a-F were retrieved from the ESO Science Archive and reduced using the EIS/MVM pipeline for automated reduction of optical/infrared images (Vandame 2002). The software produces fully reduced images and weight-maps carrying out bias subtraction, flat-fielding, de-fringing, background subtraction, first-order pixel-based image stacking (allowing for translation, rotation and stretching of the image) and astrometric calibration. Mosaicking of individual SOFI fields was based on the astrometric solution.
Photometric calibration was performed using standard stars from Persson et al. (1998), and the calibration performed as linear fits in airmass and color index whenever the airmass and color coverage allowed for it. The reduced NTT -band data and WHT -band data for Daddi-F were taken from Daddi et al. (2000). The average seeing and the size of the final coadded images are reported in Table 1.
2.2. Optical imaging and data reduction
Deep optical imaging was obtained with the Prime Focus Camera on the Subaru Telescope, Suprime-Cam, which with its 10 k k MIT/LL CCDs covers a contiguous area of with a pixel scale of pixel-1 (Miyazaki et al. 2002). Deep3a-F was observed with the four standard broad-band filters, , (hereafter band), , and (hereafter band) on the two nights of 2003 March 4–5 with seeing. During the same nights also Daddi-F was imaged in , , and to a somewhat shallower magnitude limit to match the shallower and data from Daddi et al. (2000). A relatively long unit exposure time of several hundred seconds was used in order to reach background-noise-dominated levels. For this reason bright stars, which are saturated in the optical images, have been excluded by subsequent analysis.
During the same nights the photometric standard-star field SA95 (Landolt 1992) was observed for , , and band flux calibration, and the SDSS standard-star fields SA95-190 and SA95-193 were observed for -band flux calibration (Smith et al. 2002).
The Subaru imaging was reduced using the pipeline package SDFRED (Yagi et al. 2002; Ouchi et al. 2004). The package includes overscan correction, bias subtraction, flat-fielding, correction for image distortion, PSF matching (by Gaussian smoothing), sky subtraction, and mosaicking. Bias subtraction and flat fielding were processed in the same manner as for the conventional single chip CCD.
In mosaicking, the relative positions (shifts and rotations) and relative throughput between frames taken with different CCDs and exposures are calculated using stars common to adjacent frames and running SExtractor (Bertin & Arnout 1996) with an S/N = 10 threshold.
3. Photometry
We obtained K-selected catalogs of objects in our survey by detecting sources in the K-band mosaics. For the Daddi-F we used the sample of -selected galaxies defined in Daddi et al. (2000). SExtractor (Bertin & Arnouts 1996) was used to perform the image analysis and source detection in Deep3a-F. The total magnitudes were then defined as the brightest between the Kron automatic aperture magnitudes and the corrected aperture magnitude. Multicolor photometry in all the available bands was obtained by running SExtractor in double image mode, after aligning all imaging to the K-band mosaic. Colors were measured using 2′′ diameter aperture magnitudes, corrected for the flux loss of stars. The aperture corrections were estimated from the difference between the SExtractor Kron automatic aperture magnitudes (MAG_AUTO) and the 2 aperture magnitudes, resulting in a range of 0.10 – 0.30 mag, depending on the seeing. All magnitudes were corrected for Galactic extinction ( and for Deep3a-F and Daddi-F, respectively) taken from Schlegel et al. (1998), using the empirical selective extinction function of Cardelli et al. (1989), with .
In Deep3a-F we selected objects to , over a total sky area of 320 arcmin2. Simulations of point sources show that in all the area the completeness is well above 90% at these K-band levels. We recall that objects in Daddi-F were selected to completeness limits of over an area of 700 arcmin2 (but we limit our discussion in this paper to the 600 arcmin2 covered by the Subaru observations) and to over a sub-area of 440 arcmin2 (see Daddi et al. 2000 for more details).
The total area surveyed, as discussed in this paper, therefore ranges from a combined area of 920 arcmin2 (Daddi-F and Deep3a-F) at to 320 arcmin2 (Deep3a-F) at .
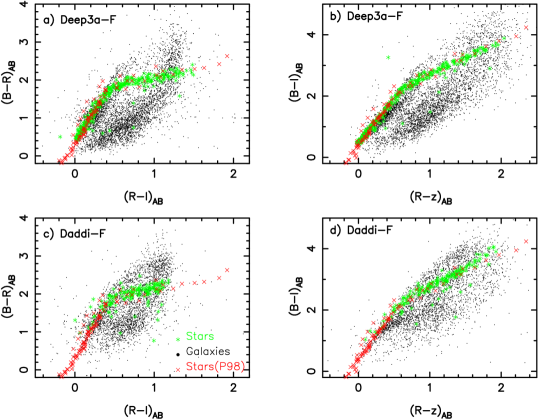
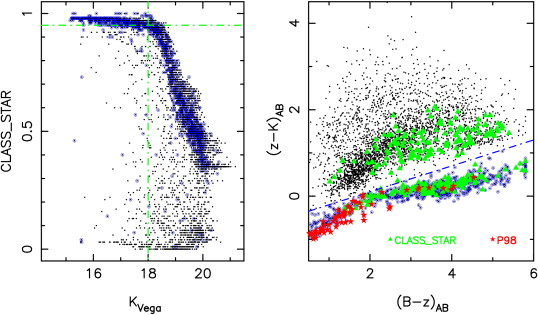
Objects in Deep3a-F and Daddi-F were cross-correlated with those available from the 2MASS survey (Cutri et al. 2003) in the J and K bands, resulting in good photometric agreement at better than the 3% level. In order to further verify the photometric zero points we checked the colors of stars (Fig. 2), selected from the diagram following Daddi et al. (2004a; see Sect.3.1). From these color-color planes, we find that the colors of stellar objects in our data are consistent with those of Pickles (1998), with offsets, if any, of mag at most. Similar agreement is found with the Lejeune et al. (1997) models.
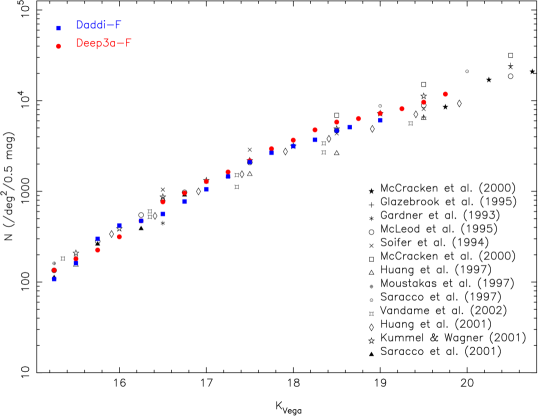
Figure 3 shows a comparison of K-band number counts in our survey with a compilation of literature counts. No attempt was made to correct for different filters ( or ). No corrections for incompleteness were applied to our data, and we excluded the stars, using the method in Sect. 3.1. The filled circles and filled squares correspond, respectively, to the counts of Deep3a-F and Daddi-F. As shown in the figure, our counts are in good agreement with those of previous surveys.
3.1. Star-galaxy separation
Stellar objects are isolated with the color criterion (Daddi et al. 2004a) . In Fig. 4 we compare the efficiency of such a color-based star-galaxy classification with the one based on the SExtractor parameter CLASS_STAR, which is based on the shape of the object’s profile in the imaging data. It is clear that the color classification is superior, allowing us to reliably classify stars up to the faintest limits in the survey. However, SExtractor appear to find resolved in the imaging data a small fraction of objects that are color-classified as stars. Most likely, these are blue galaxies scattered into the stellar color boundaries by photometric uncertainties.
4. Candidates of BK, BK and ERO
In this section, we select sBzKs, pBzKs and EROs in the Deep3a-F and Daddi-F, using the multicolor catalog based on the NIR K-band image (see Sect. 3). Forthcoming papers will discuss the selection of DRGs ( objects) and LBGs, using the photometry from our database.
4.1. Selection of sBzKs and pBzKs
In order to apply the selection criteria consistently with Daddi et al. (2004a), we first accounted for the different shapes of the filters used, and applied a correction term to the B-band. The B-band filter used at the Subaru telescope is significantly redder than that used at the VLT by Daddi et al. (2004a). We then carefully compared the stellar sequence in our survey to that of Daddi et al. (2004a), using the Pickles (1998) stellar spectra and the Lejeune et al. (1997) corrected models as a guide, and applied small color terms to and (smaller than mags in all cases), in order to obtain a fully consistent match. In the following we refer to photometry for the system defined in this way, consistent with the original definition by Daddi et al. (2004a).
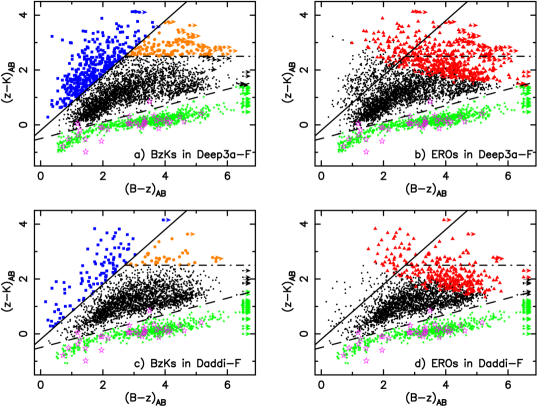
Figure 5 shows the color diagram of K-selected objects in Deep3a-F and Daddi-F. Using the color criterion from Daddi et al. (2004a), , 387 galaxies with were selected in Deep3a-F as sBzKs, which occupy a narrow range on the left of the solid line in Fig. 5a. Using and , 121 objects were selected as candidate pBzKs, which lie in the top-right part of Fig. 5a. To a surface density of arcmin-2 and of arcmin-2 is derived separately for sBzKs and pBzKs, respectively (Poisson’s errors only). The surface density of sBzKs is larger but still consistent within 2 with the arcmin-2 found in the 52 arcmin2 of the K20 field (Daddi et al. 2004a), and with the arcmin-2 found in the GOODS North field (Daddi et al. 2005b). Instead, the surface density of pBzKs recovered here is significantly larger than what found in both fields. This may well be the result of cosmic variance, given the strong clustering of pBzKs (see Section 5), and their lower overall surface density.
Using the same criteria, we select sBzKs and pBzKs in the Daddi-F field. In Daddi-F 108 sBzKs and 48 pBzKs are selected, and they are plotted in Fig. 5c. The density of sBzKs and pBzKs in Daddi-F is consistent with that in Deep3a, if limited at .
4.2. Selection of EROs
EROs were first identified in -band surveys by Elston, Rieke, & Rieke (1988), and are defined here as objects having red optical-to-infrared colors such that –6, corresponding to –4.35. EROs are known to be a mixture of mainly two different populations at ; passively evolving old elliptical galaxies and dusty starburst (or edge-on spiral) galaxies whose UV luminosities are strongly absorbed by internal dust (Cimatti et al. 2002b; Yan et al. 2004, Moustakas et al. 2004). In Daddi-F, EROs were selected and studied by Daddi et al. (2000) using various thresholds. In order to apply a consistent ERO selection in Deep3a-F, we considered the filter shapes and transmission curves. While the same K-band filters (and the same telescope and instrument) were used for K-band imaging in the two fields, the R-band filters used in the two fields differ substantially. In the Daddi-F the WHT R-band filter was used, which is very similar, e.g., to the R-band filter of FORS at the VLT used by the K20 survey (Cimatti et al. 2002a). The Subaru+Suprime-Cam -band filter is much narrower than the above, although it does have a very close effective wavelength. As a result, distant early-type galaxy spectra as well as M-type stars appear to have much redder color, by about 0.3 mag, depending on exact redshift and spectral shape. Therefore, we selected EROs in Deep3a-F with the criterion (AB magnitudes), corresponding closely to (AB magnitudes) or (Vega magnitudes). In Deep3a-F, 513 EROs were selected to , and they are plotted in Fig. 5b with solid red triangles, for a surface density of 1.6 arcmin-2. To the same limit, this agrees well with the density found, e.g., in the K20 survey ( arcmin-2), or in the 180 arcmin2 survey by Georgakakis et al. (2005). In the Daddi-F, 337 EROs were selected with the criterion , consistent with what done in Deep3a, and are plotted in Fig. 5d as red solid triangles. The surface density of EROs in both fields at can be compared, with overall good consistency, to the one derived from the large 1 deg2 survey by Brown et al. (2005).
The peak of the EROs redshift distribution is at (e.g., Cimatti et al. 2002a). By looking at the properties of EROs we can estimate how many of them lie in the high- tail , thus testing the shape of their redshift distribution. In the Deep3a-F to some 90 of the EROs are also sBzKs, thus likely belong to the category of dusty starburst EROs at , while 121 EROs are classified as pBzKs. Totally, % of EROs are selected with the criteria, thus expected to lie in the high-z tail () for sample. This result is consistent with the value of 35% found in the 52 arcmin2 of the K20 field (Daddi et al. 2004a), and with the similar estimates of Moustakas et al. (2004) for the full GOODS-South area. In the Daddi-F, to , 49 of the EROs are also sBzKs; and 48 of them are also pBzKs. About 29% of EROs at are in the high-z tail at .
4.3. Number counts of EROs, sBzKs, and pBzKs
| Deep3a-F in log (N/deg2/0.5mag) | Daddi-F in log (N/deg2/0.5mag) | ||||||||
| K bin center | Galaxies | EROs | sBzKs | pBzKs | K bin center | Galaxies | EROs | sBzKs | pBzKs |
| 16.75 | 2.981 | 1.353 | — | — | 16.75 | 2.888 | 1.254 | — | — |
| 17.00 | 3.109 | 1.654 | — | — | 17.00 | 3.023 | 1.555 | — | — |
| 17.25 | 3.213 | 1.830 | — | — | 17.25 | 3.165 | 1.891 | — | — |
| 17.50 | 3.337 | 2.198 | — | — | 17.50 | 3.323 | 2.120 | — | — |
| 17.75 | 3.470 | 2.483 | 1.353 | — | 17.75 | 3.426 | 2.321 | 1.254 | — |
| 18.00 | 3.565 | 2.675 | 1.654 | 1.052 | 18.00 | 3.498 | 2.590 | 1.622 | 1.078 |
| 18.25 | 3.678 | 2.822 | 2.006 | 1.830 | 18.25 | 3.569 | 2.786 | 1.923 | 1.379 |
| 18.50 | 3.764 | 3.025 | 2.228 | 2.353 | 18.50 | 3.669 | 2.888 | 2.209 | 1.891 |
| 18.75 | 3.802 | 3.138 | 2.529 | 2.467 | 18.65 | 3.708 | 2.990 | 2.342 | 2.175 |
| 19.00 | 3.859 | 3.145 | 2.724 | 2.596 | 19.00 | 3.783 | 3.063 | 2.834 | 2.461 |
| 19.25 | 3.911 | 3.162 | 2.971 | 2.608 | — | — | — | — | — |
| 19.50 | 3.983 | 3.201 | 3.228 | 2.675 | — | — | — | — | — |
| 19.75 | 4.072 | 3.297 | 3.470 | 2.759 | — | — | — | — | — |
Simple surface densities provide limited insight into the nature of different kind of galaxies. However, number-magnitude relations, commonly called number counts, provide a statistical probe of both the space distribution of galaxies and its evolution. For this reason, we derived -band differential number counts for EROs, sBzKs and pBzKs in our fields, and plotted them in Figure 6. The differential number counts in 0.5 mag bins are shown in Table 2. Also shown are the number counts for all -selected field galaxies in Deep3a-F (circles with solid line) and Daddi-F (squares with dot-dashed line), with the same as in Fig. 3 for comparison. A distinguishable characteristic in Fig. 6 is that all of high redshift galaxies (EROs, sBzKs, and pBzKs) have faint NIR apparent magnitudes (17 mag), and the slopes of the counts for EROs, sBzKs and pBzKs are steeper than that of the full -selected sample.
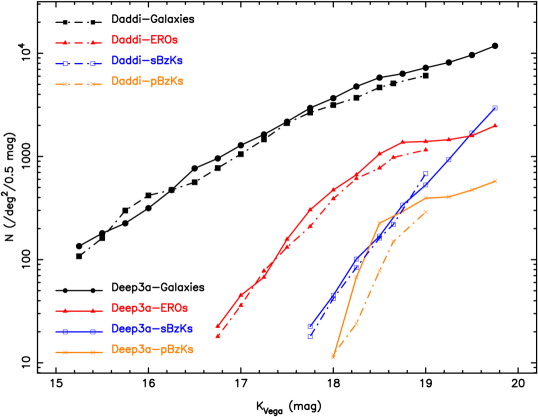
The open squares with a solid line in Fig. 6 shows the number counts for sBzKs in Deep3a-F. The fraction of sBzKs in Deep3a-F increases very steeply towards fainter magnitudes. The triangles with a solid line and crosses with a solid line show, respectively, the number counts of EROs and pBzKs in Deep3a-F. The open squares with a dot-dashed line in Fig. 6 show the number counts for sBzKs in Daddi-F. The counts of sBzKs in Daddi-F are almost identical to those in Deep3a-F, to their limit of . The triangles with a dot-dashed line and crosses with a dot-dashed line in Fig. 6 show respectively the number counts for EROs and pBzKs in Daddi-F.
For EROs, the slope of the number counts is variable, being steeper at bright magnitudes and flattening out toward faint magnitudes. A break in the counts is present at , very similar to the break in the ERO number counts observed by McCarthy et al. (2001) and Smith et al. (2002). The pBzKs number counts have a similar shape, but the break in the counts slope is apparently shifted –1.5 mag fainter. There are indications that EROs and pBzKs have fairly narrow redshift distributions: peaked at for EROs (Cimatti et al. 2002b; Yan et al. 2004; Doherty et al. 2005) and at for pBzKs (Daddi et al. 2004b; 2005a). The number counts might therefore be direct probes of their respective luminosity function, and the shift in the counts is indeed consistent with the different typical redshifts of the two population of galaxies.
The counts of sBzKs have roughly the same slope at all K-band magnitudes. This is consistent with the much wider redshift distribution of this class of galaxies. However, we expect that at bright magnitudes AGN contamination might be more relevant than at . Correcting for this, the counts of non-AGN sBzKs galaxies at bright magnitudes might be intrinsically steeper.
5. Clustering of K-selected galaxy populations
Measuring the clustering of galaxies provides an additional tool for studying the evolution of galaxies and the formation of structures. In this section we estimate over the two fields the angular correlation of the general galaxy population as well as of the EROs, sBzKs and pBzKs.
In order to measure the angular correlation function of the various galaxy samples, we apply the Landy & Szalay technique (Landy & Szalay 1993; Kerscher et al. 2000), following the approach already described in Daddi et al. (2000), to which we refer for formulae and definitions.
5.1. Clustering of the -selected field galaxies
In our analysis a fixed slope 0.8 was assumed for the two-point correlation function []. This is consistent with the typical slopes measured in both faint and bright surveys and furthermore makes it possible to directly compare our results with the published ones that were obtained adopting the same slope (see Daddi et al. 2000 for more details).
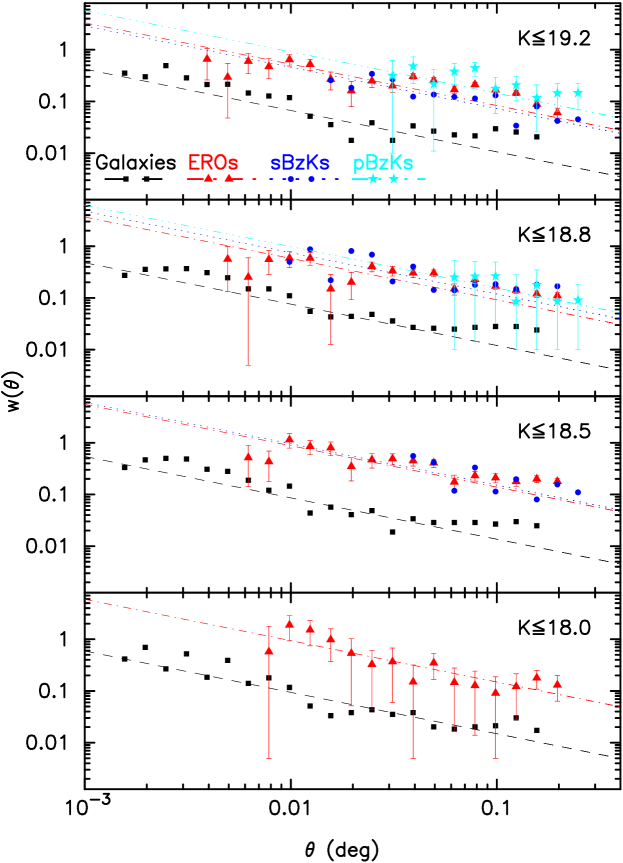
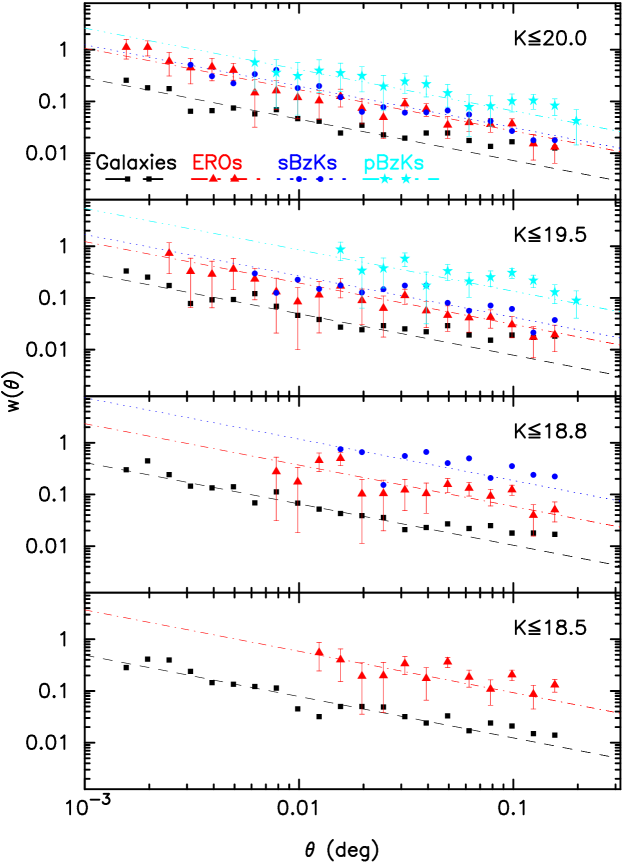
In Figures 7 and 8 the bias-corrected two-point correlation functions of Daddi-F and Deep3a-F are shown as squares; the bins have a constant logarithmic width (), with the bin centers ranging from 5.6 to 11.8 for both fields. These values of are large enough to avoid problems of under-counting caused by the crowding of galaxy isophotes and yet are much smaller than the extent of the individual fields. The dashed line shows the power-law correlation function given by a least square fit to the measured correlations. We clearly detect a positive correlation signal for both fields with an angular dependence broadly consistent with the adopted slope 0.8. The derived clustering amplitudes (where is the amplitude of the true angular correlation at 1∘) are presented in the third column of Table 3 and of Table 4 for Daddi-F and Deep3a-F, respectively, and shown in Fig. 9. We compare our result on Daddi-F with those previously reported by Daddi et al. (2000), since we use the same -band images for this field. The present -selected galaxy sample is however different from that of Daddi et al. (2000) in thta: (1) the area (600 ) is smaller than that (701 ) in Daddi et al. (2000), because we limit ours to the area with all the -band data; and (2) the star-galaxy separation was done by different methods. In Daddi et al. (2000) the SExtractor CLASS_STAR morphological parameter was used, while the photometric criterion of Daddi et al. (2004a) is used here. Column 10 of Table 3 lists the clustering amplitudes of all the -selected galaxies in Daddi et al. (2000). For and fainter bins the -values in the two samples are in fair agreement, but for the brightest bin () the -value in Daddi et al. (2000) is , 45% smaller than that found here (), probably mainly due to the more efficient star-galaxy separation employed here (Sect. 3.1). Apart from this small discrepancy, we find good agreement between our results and those of Daddi et al. (2000) and Oliver et al. (2004).
The clustering amplitudes in Deep3a-F tend to be slightly but systematically smaller than in Daddi-F, which is likely caused by the intrinsic variance among different fields, depending on the survey geometry, surface density and clustering properties (see Sect. 5.5).
| Galaxies | EROs | sBzKs | pBzKs | Daddi et al. (2000) | ||||||
|---|---|---|---|---|---|---|---|---|---|---|
| K limitaaThe area for mag is about 600 arcmin2, and for it is about 440 arcmin2. | num. | A[10-3]bbThe amplitude of the true angular correlation at 1∘, the value of the is 5.46 and 5.74 for the whole and the deeper area, respectively. | num. | A[10-3] | num. | A[10-3] | num. | A[10-3] | Gal.ccThe last two columns show the clustering amplitudes for the K-selected galaxies and the EROs in Daddi et al. (2000). | EROsccThe last two columns show the clustering amplitudes for the K-selected galaxies and the EROs in Daddi et al. (2000). |
| 18.0 | 978 | 2.360.94 | 51 | 23.604.18 | 7 | — | 1 | — | 1.3 | 24 |
| 18.5 | 1589 | 2.160.40 | 132 | 22.002.82 | 21 | 24.009.80 | 5 | — | 1.6 | 22 |
| 18.8 | 2089 | 1.910.30 | 228 | 14.601.64 | 43 | 18.907.52 | 20 | 24.709.92 | 1.5 | 14 |
| 19.2 | 2081 | 1.680.28 | 264 | 13.201.26 | 92 | 11.506.61 | 40 | 22.907.63 | 1.6 | 13 |
| Galaxies | EROs | sBzKs | pBzKs | ||||||||
|---|---|---|---|---|---|---|---|---|---|---|---|
| K limit | num. | A[10-3]aaThe amplitude of the true angular correlation at 1∘, the value of the is 6.63. | num. | A[10-3] | num. | A[10-3] | num. | A[10-3] | |||
| 18.5 | 997 | 1.961.04 | 95 | 14.702.20 | 13 | — | 8 | — | |||
| 18.8 | 1332 | 1.650.76 | 166 | 9.291.60 | 27 | 29.505.80 | 26 | 40.907.55 | |||
| 19.5 | 2284 | 1.240.41 | 340 | 4.890.78 | 129 | 6.703.14 | 71 | 21.403.00 | |||
| 20.0 | 3333 | 1.140.28 | 513 | 4.250.52 | 387 | 4.951.69 | 121 | 10.402.83 | |||
We find a smooth decline in amplitude with K-band magnitude that is consistent with the results from Roche et al. (2003), Fang et al. (2004), and Oliver et al. (2004). The decline is not as steep as in the range (see e.g. Roche et al. 1999). The flattening, which extends up to –24 (Carlberg et al. 1997; Daddi et al. 2003) has been interpreted as due to the existence of strongly clustered K-selected galaxy populations extending to redshifts –3 (Daddi et al. 2003). Beside the well known EROs strongly clustered galaxy populations, other populations with high angular clustering indeed exist with redshift extending to at least, as discussed in the next sections.
5.2. Clustering of the EROs
We estimate the clustering properties of the EROs, using the large sample of EROs derived from our two fields. Figures 10a) and 10b) clearly show, from both fields, that the sky distribution of EROs is very inhomogeneous, as first noted by Daddi et al. (2000). The two-point correlation functions are shown in Fig. 7 and 8 for Daddi-F and Deep3a-F, and the dot-dashed lines show the power-law correlation function given by a least squares fit to the measured values. The correlations are well fitted by a power law.
A strong clustering of the EROs is indeed present at all scales that could be studied, and its amplitude is about one order of magnitude higher than that of the field population at the same limits, in agreement with previous findings (Daddi et al. 2000; Firth et al. 2002; Brown et al. 2005; Georgakakis et al. 2005). The derived clustering amplitudes are reported in column (5) of Table 3 and Table 4 for Daddi-F and Deep3a-F, respectively. The amplitudes shown in Fig. 9 suggest a trend of decreasing strength of the clustering for fainter EROs in both fields.
For the and mag subsamples of Daddi-F, the correlation function signal is significant at the 7 level with clustering amplitudes and , respectively. For the subsample with mag, the detected signal is significant at the 10 confidence level (). In column 11 of Table 3 we also list the clustering amplitudes of EROs in Daddi et al. (2000), which are in good agreement with the present findings. Using a arcmin2 Ks-band survey of a region within the Phoenix Deep Survey, Georgakakis et al. (2005) have analyzed a sample of 100 EROs brighter than mag, and estimated an amplitude , consistent with our results.
As for the -selected galaxies, the clustering amplitude of EROs in Deep3a-F is slightly smaller than that in Daddi-F. The clustering amplitudes are for EROs, and for EROs, which is weaker than the for EROs in Georgakakis et al. (2005). Field-to-field variation is one of possible reasons for this discrepancy, which is discussed in Sect. 5.5.
We notice that our results are solid against possible contamination by stars. Contamination by unclustered populations (i.e. stars) would reduce the amplitude of the angular correlation function by , where is the fractional contamination of the sample. The prime candidates for contamination among EROs are red foreground Galactic stars (note that stars are not contaminating BzK samples), which can have red colors. However, we have rejected stars among EROs using the photometric criterion for star-galaxy separations (see Sect. 3.1). Therefore, our clustering measurements refer to extragalactic EROs only.

5.3. Clustering of the star-forming BzKs
Figures 10c) and 10d) display the sky distribution of the sBzKs in Daddi-F and Deep3a-F, and shows that also these galaxies have a quite inhomogeneous distribution. This is not an artifact of variations of the detection limits over the fields, because the Monte Carlo simulations show that differences in detection completeness within small () areas in the image are very small, and that the detection completeness does not correlate with the distribution of the sBzKs.
The resulting angular correlation functions for the sBzKs are shown in Fig. 7 and Fig. 8 for the two fields. Again, a slope provides a good fit to the data. The best fit values of are reported in column 7 of Table 3 and Table 4.
The amplitudes of sBzKs in Daddi-F are , and at , 18.8 and 19.2, respectively. For sBzKs in Deep3a-F, the amplitudes become , and at , 19.5 and 20.0, respectively. The sBzKs appear to be strongly clustered in both fields, and the clustering strength increases with the -band flux. Actually, they are as strongly clustered as the EROs. Strong clustering of the sBzKs was also inferred by Daddi et al. (2004b), by detecting significant redshift spikes in a sample of just nine sBzKs with spectroscopic redshifts in the range . Albeit without spectroscopic redshifts, the present result is instead based on a sample of 500 sBzKs. Adelberger et al. (2005) also found that UV-selected, star forming galaxies with in the redshift range are strongly clustered. Our results are in good agreement with these previous findings.
5.4. Clustering of the passive BzKs
Figures 10e) and 10f) display the sky distribution of the pBzKs in Daddi-F and Deep3a-F, and show that also these galaxies have a very inhomogeneous distribution. We then derive the angular two-point correlation function of pBzKs, using the same method as in the previous subsections.
The resulting angular correlation functions for the pBzKs are shown in Fig. 7 and Fig. 8 for the two fields. Again, a slope provides a good fit to the data. The best fit values of are reported in column (9) of Table 3 and Table 4.
The pBzKs appear to be the most strongly clustered galaxy population in both fields (with for pBzKs in Daddi-F and for pBzKs in Deep3a-F), and the clustering strength increases with increasing -band flux.
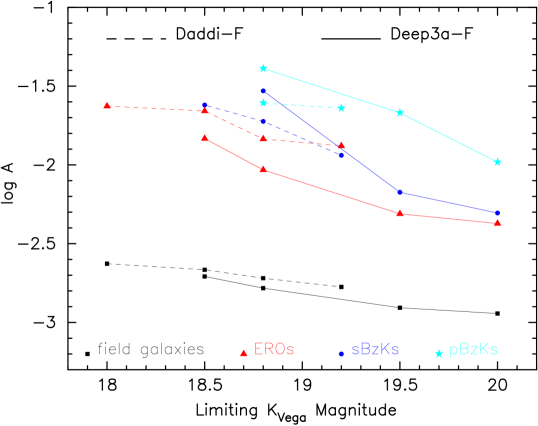
5.5. -band dependence and field-to-field variations of clustering measurements
Fig. 9 summarizes the clustering measurements for the populations examined (field galaxies, EROs, and BzKs), as a function of the -band limiting magnitudes of the samples. Clear trends with are present for all samples, showing that fainter galaxies have likely lower intrinsic (real space) clustering, consistent with the fact that objects with fainter are less massive, or have wider redshift distributions, or both. For the EROs (see Sect. 4.2) we have found evidence that faint samples have indeed a higher proportion of galaxies in the tail, with respect to brighter objects, and thus a wider redshift distribution. As already noted, all color-selected high-redshift populations are substantially more clustered than field galaxies, at all the magnitudes probed here. The reason for the stronger angular clustering of pBzKs, compared, e.g, to sBzKs or EROs, is likely (at least in part) their narrower redshift distributions (Daddi et al. 2004a; 2005a). In future papers, we will use the Limber equation, with knowledge of the redshift distributions, to compare the real space correlation length of the different populations.
For strongly clustered populations, with angular clustering amplitudes , a large cosmic variance of clustering is expected, which is relevant also on fields of the size of the ones studied here (see Daddi et al. 2001; 2003). There are in fact variations in our clustering measurements for high-redshift objects between the two fields, sometimes larger than expected on the basis of the errors on each clustering measurements. We remind the reader that realistic external errors on the angular clustering of EROs, as well as sBzKs and pBzKs are likely larger than the Poissonian ones that we quote. Following the recipes by Daddi et al. (2001) we estimate that the typical total accuracy for our measurements of , when including external variance, is on the order of 30%.
5.6. Cosmic variance in the number counts
The presence of strong clustering will also produce substantial field to field variations in the number counts. Given the available measurements of angular clustering, presented in the previous sections, we are able to quantify the expected variance in the galaxies counts, following e.g. eq. (8) of Daddi et al. (2000). We estimate that, for the Deep3a-F limit of , the integrated numbers of objects are measured to % precision for EROs and sBzKs, and to 30% precision for pBzKs.
6. Properties of sBzKs
The accurate analysis of the physical properties of high redshift galaxies (such as SFR, stellar mass, etc.) requires the knowledge of their spectroscopic redshift. VLT VIMOS spectra for objects culled by the present sample of sBzKs and EROs have been recently secured and are now being analyzed, and will be used in future publications. In the meantime, estimates of these quantities can be derived on the basis of the present photometric data, following the recipes calibrated in Daddi et al. (2004a), to which we refer for definitions and a more detailed discussion of the recipes.
While errors by a factor of 2 or more may affect individual estimates done in this way, when applied to whole population of -selected galaxies these estimates should be relatively robust, on average, because the Daddi et al.’s (2004a) relations were derived from a sample of galaxies with spectroscopic redshifts. The estimates presented here thus represent a significant improvement on the similar ones provided by Daddi et al. (2004a) because of the 6 to 20 times larger area probed (depending on magnitude) with respect to the K20 survey, which should help to significantly reduce the impact of cosmic variance.
6.1. Reddening and star formation rates
Following Daddi et al. (2004a), estimates of the reddening and SFR for sBzKs can be obtained from the colors and fluxes alone (see Daddi et al. 2004a for more details). The reddening can be estimated by the color, providing a measure of the UV slope. The Daddi et al. ’s recipe is consistent with the recipes by Meurer et al. (1999) and Kong et al. (2004) for a Calzetti et al. (2000) extinction law, based on the UV continuum slope. Daddi et al. (2004a) showed that for galaxies this method provides with an rms dispersion of the residuals of about 0.06, if compared to values derived with knowledge of the redshifts, and with the use of the full multicolor SED. With knowledge of reddening, the reddening corrected B-band flux is used to estimate the 1500Å rest-frame luminosity, assuming an average redshift of 1.9, which can be translated into SFR on the basis, e.g., of the Bruzual & Charlot (2003) models. Daddi et al. (2005b) showed that SFRs derived in this way are consistent with radio and far-IR based estimates, for the average sBzKs.
The and SFR histograms of the sBzKs in Daddi-F and Deep3a-F are shown in Fig. 11. About 95% of the sBzKs in Daddi-F () have SFRyr-1, and the median SFR is about yr-1. About 90% of the sBzKs in Deep3a-F () have SFR70yr-1, and the median SFR is yr-1.
The median reddening for the sBzKs is estimated to be , consistently with Daddi et al. (2004a; 2005b). Of sBzKs 55% have , the limit at which we estimate the UV-based criteria of Steidel et al. (2004) would fail at selecting galaxies. Therefore, we estimate that % of the galaxies would be missed by the UV criteria. This is similar to, but higher, than the 40% estimated by Reddy et al. (2005). The probable reason for the small discrepancy is that Reddy et al. (2005) excluded from their sample the reddest sBzKs for which the optical magnitudes could not be accurately measured in their data.
6.2. Stellar masses of sBzKs and pBzKs
Using BC03 models, spectroscopic redshifts of individual K20 galaxies, and their whole SED, Fontana et al. (2004) have estimated the stellar-mass content for all the K20 galaxies (using a Salpeter IMF from 0.1 to 100 M⊙, as adopted in this paper). The individual mass estimates for 31 non-AGN sBzKs and pBzKs objects with have been used by Daddi et al. (2004a) to calibrate an empirical relation giving the stellar mass for both sBzKs and pBzKs as a function of their observed -band total magnitude and color. This relation allows one to estimate the stellar mass with uncertainties on single objects of about 60% compared to the estimates based on knowledge of redshifts and using the full multicolor SEDs. The relatively small variance is introduced by intrinsic differences in the luminosity distance, in the ratio for given magnitudes and/or colors.
The histograms for the stellar mass of the sBzKs derived in this way are shown in Fig. 11e and Fig. 11f. About 95% of the sBzKs in Daddi-F have , and the median stellar mass is ; in Deep3a-F of the sBzKs have , the median stellar mass is , a difference due to the different limiting magnitude in the two fields.
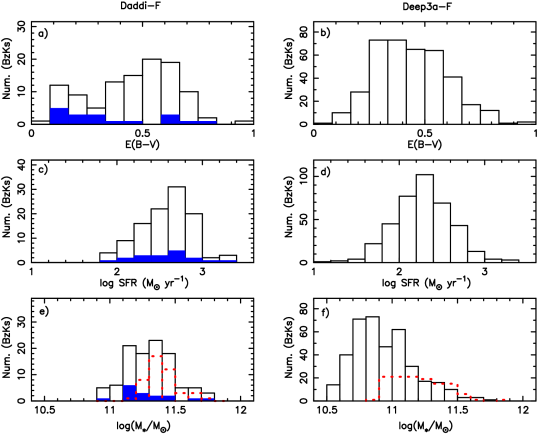
Using the same method, we also estimate the stellar mass of the pBzKs in both fields, and plot them in Fig. 11e and Fig. 11f as the dotted line. The median stellar mass of pBzKs in Daddi-F is , and in Deep3a-F is , respectively. Again, the higher masses for sBzKs in Daddi-F compared to Deep3a-F result from the shallower -band limit.
It is worth noting that in the sample there are barely any pBzKs less massive than (see Fig. 11f), while over 50% of sBzKs are less massive than this limit. This is primarily a result of pBzKs being by construction redder than , and hence Eq. (6) and Eq. (7) in Daddi et al. (2004a) with implies . Note that above (above which our sample should be reasonably complete) the numbers of sBzKs and pBzKs are similar. We return to this point in the last section.
6.3. Correlation between physical quantities
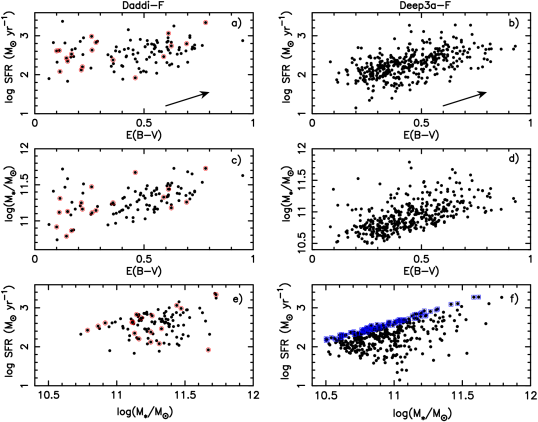
Figures 12a) and 12b) show the correlation between color excess and SFR for the sBzKs in Daddi-F and Deep3a-F, respectively. The Spearman rank correlation coefficients are for Daddi-F and for Deep3a-F. This implies that the SFR is significantly correlated to , at a level, and the reddest galaxies have the highest SFR. Part of this correlation can arise from simple error propagation, as an overestimate (underestimate) of the reddening automatically leads to an overestimate (underestimate) of the SFR of a galaxy. In Fig. 12a) and Fig. 12b) the arrow shows the resulting slope of the correlated reddening errors, which indeed is parallel to the apparent correlation. However, the scatter in the original SFR- correlation [; Daddi et al. 2004a] is much smaller than what needed to produce the full correlation seen in Fig. 12a) and 12b). We conclude that there is evidence for an intrinsic correlation between SFR and reddening for star-forming galaxies, with galaxies with higher star formation rates having more dust obscuration. A positive correlation between SFR and reddening also exists in the local universe (see Fig. 1 of Calzetti 2004), and was also found by Adelberger & Steidel (2000) for LBGs, on a smaller range of reddening.
In Figures 12c) and 12d), we plot the relation between color excess and stellar mass of the sBzKs in Daddi-F and Deep3a-F. The Spearman rank correlation coefficient is for Daddi-F and for Deep3a-F, indicating that the correlation between and stellar mass is significant at the level in both fields. In this case the estimate of the stellar mass depends only mildly on the assumed reddening, and therefore the correlation is likely to be intrinsic, with more massive galaxies being also more absorbed.
Given the previous two correlation, not surprisingly we also find a correlation between SFR and stellar mass (Figure 12e and 12f). The Spearman rank correlation coefficient is for Daddi-F, and for Deep3a-F, indicating that the correlation between SFR and stellar mass is significant at the level in both fields. The origin of the sharp edge in Fig. 12e) and Fig. 12f) is caused by the color limit for selecting sBzKs. To show this clearly, we plot galaxies with as open squares in Fig. 12f). However, no or very few galaxies exist below the line, and therefore the upper edge shown in the figure appears to be intrinsic, showing a limit on the maximum SFR that is likely to be present in a galaxy of a given mass.
At the vast majority of massive galaxies () are passively evolving, “red” galaxies (e.g., Baldry et al. 2004), while instead at , actively star-forming (sBzKs) and passive (pBzKs) galaxies exist in similar numbers, and Fig. 12 shows that the most massive sBzKs tend also to be the most actively star forming. This can be seen as yet another manifestation of the downsizing effect (e.g., Cowie et al. 1996; Kodama et al. 2004; Treu et al. 2005), with massive galaxies completing their star formation at an earlier epoch compared to less massive galaxies, which instead have more prolonged star formation histories.
Because of the correlations discussed above, UV-selected samples of galaxies (Steidel et al. 2004) will tend to preferentially miss the most star-forming and most massive galaxies. Still, because of the large scattering in the correlations, some of the latter galaxies will also be selected in the UV, as can be seen in Fig. 12 and as emphasized in Shapley et al. (2004; 2005).
6.4. Mass and SFR densities
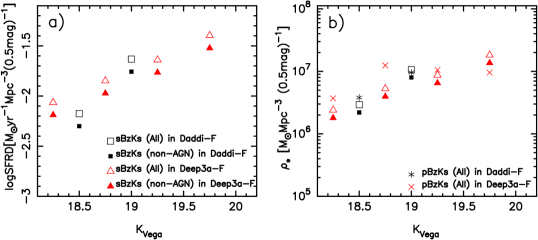
In this subsection we derive the contribution of the sBzKs to the integrated star formation rate density (SFRD) at and of sBzKs and pBzKs to the stellar mass density at . Some fraction of the sBzKs galaxies are known to be AGN-dominated galaxies (Daddi et al. 2004b; 2005b; Reddy et al. 2005). To estimate the AGN contamination, we have used the 80 ks XMM- X-ray data that are available for Daddi-F (Brusa et al. 2005). A circular region of 11′ radius from the point of maximum exposure time include 70 sBzKs 18 of which are identified with X-ray sources using a 5′′ radius error circle (see Fig. 12). This fraction is comparable to the one estimated in the CDFS field (Daddi et al. 2004b) and in the GOODS-N field (Daddi et al. 2005b; Reddy et al. 2005), for which Ms Chandra data are available. Based also on the latter result, we assume the AGN contamination is about 25%, and we adopt this fraction to statistically correct properties derived from our sBzKs samples.
The left panel of Fig. 13 shows the differential contribution to the SFR density at from sBzKs as a function of their -band magnitude. Using the volume in the redshift range (Daddi et al. 2004a; see also Reddy et al. 2005), an SFRD of yr-1 Mpc-3 is derived from the sBzKs () in Deep3a-F, and an SFRD of yr-1 Mpc-3 is derived from the sBzKs () in Daddi-F. These estimates are reduced, respectively, to yr-1 Mpc-3 () and 0.018 yr-1 Mpc-3 () when subtracting an estimated AGN contamination. Using the same method and the 24 sBzKs in the K20/GOODS-S sample, Daddi et al. (2004a) derived an SFRD yr-1 Mpc-3 for the volume in the redshift range ; i.e., lower than that derived here, possibly due to cosmic variance. However, note that there appears to be just a hint for the increasing trend in SFRD with magnitude to flatten out at , indicating that a substantial contribution to the total SFRD is likely to come from sBzKs, and therefore the values derived here should be regarded as lower limits.
Recently, Reddy et al. (2005) provided an estimate for the SFRD of sBzKs of yr-1 Mpc-3, about one-third of the estimate that we have obtained here. Part of the difference is due to the absence of the reddest sBzKs from the Reddy et al. (2005) sample, as already noticed. However, most of the difference is likely due to the fact that the Reddy et al. (2005) SFR estimate is based primarily on the X-ray emission interpreted with the Ranalli et al. (2003) relation. As shown by Daddi et al. (2005b), the X-ray emission interpreted in this way typically underestimates the SFR of sBzKs by factors of 2–3, with respect to the radio-, mid-IR- and far-IR-based SFR estimates, all of which are also in reasonable agreement with the UV-corrected SFR estimate.
The right panel of Fig. 13 shows the differential contribution to the stellar mass density at from sBzKs and pBzKs as a function of their -band magnitude. The open squares and triangles represent values that were calculated from all sBzKs, the solid symbols represent values corrected for the AGN contamination. The stars and crosses represent the mass density contributed by pBzKs.
The stellar mass density in Deep3a-F, integrated to our catalog limit, is log Mpc-3, in excellent agreement with the value reported in Table 4 of Fontana et al. (2004), i.e., log Mpc-3 for galaxies, and log Mpc-3 for galaxies, but now from a much bigger sample. These estimates also agree with the log Mpc-3 estimate at by Dickinson et al. (2003), although their selection is much deeper (), although it extends over a much smaller field (HDF). So, while our sample is likely to miss the contribution of low-mass galaxies, the Dickinson et al. sample is likely to underestimate the contribution of high-mass galaxies due to the small field and cosmic variance. There is little evidence for flattening of log by . As already noted, the total stellar mass density at has to be significantly larger than that estimated here, i.e., only from the contribution of -selected galaxies.
There are 121 pBzKs in Deep3a-F, and for of them we derive . Correspondingly, the number density of pBzKs with over the range is Mpc-3 (Poisson error only). This compares to Mpc-3 over the same redshift range as estimated by Daddi et al. (2005a) using six objects in the Hubble Ultra Deep Field (HUDF) with spectroscopic redshift. While the Daddi et al. (2005a) HUDF sample is important to establish that most pBzKs are indeed passively evolving galaxies at , their density measurements is fairly uncertain due to cosmic variance. Being derived from an area which is times larger than HUDF, the results presented here for the number density of massive, passively evolving galaxies in Deep3a-F in the quoted redshift range should be much less prone to cosmic variance. Hence, we estimate that, compared to the local value at ( Mpc-3, Baldry et al. 2004), at there appears to be about 20%7% of massive (), passively evolving galaxies, with the error above accounting also for cosmic variance.
7. Summary and Conclusions
This paper presents the results of a survey based on photometry obtained by combining Subaru optical and ESO near-IR data over two separate fields (Deep3a-F and Daddi-F). Complete K-selected samples of galaxies were selected to in the Deep3a-F over 320 arcmin2, and to in the Daddi-F over a field roughly twice the area. Deep multicolor photometry in the bands were obtained for the objects in both fields. Object catalogs constructed from these deep data contain more than objects in the NIR bandpasses. Galaxy -band number counts were derived and found to be in excellent agreement with previous survey results.
We have used color criteria to select candidate massive galaxies at high redshift, such as -selected star-forming (sBzKs) and passively evolving (pBzKs) galaxies at , and EROs, and derived their number counts. The main results can be summarized as follows.
1. Down to the -band limit of the survey the log of the number counts of sBzKs increases linearly with the magnitude, while that of pBzKs flattens out by . Over the Deep3a-F we select 387 sBzKs and 121 pBzKs down to , roughly a factor of 10 more than over the 52 arcmin2 fields of the K20 survey. This corresponds to a higher surface density, quite possibly the result of cosmic variance. Over Daddi-F we select 108 sBzKs and 48 pBzKs down to .
2. The clustering properties (angular two-point correlation function) of EROs and -selected galaxies (both sBzKs and pBzKs) are very similar, and their clustering amplitudes are about a factor of 10 higher than those of generic galaxies in the same magnitude range. The most strongly clustered populations at each redshift are likely to be connected to each other in evolutionary terms, and therefore the strong clustering of EROs and BzKs makes quite plausible an evolutionary link between BzKs at and EROs at , with star formation in sBzKs subsiding by thus producing passively evolving EROs. While some pBzKs may well experience secondary, stochastic starbursts at lower redshift, the global evolutionary trend of the galaxy population is dominated by star formation being progressively quenched in massive galaxies, with the quenching epoch of galaxies depending on environmental density, being earlier in high-density regions.
3. Using approximate relations from Daddi et al. (2004a) and multicolor photometry, we estimated the color excess, SFR and stellar mass of sBzKs. These galaxies have median reddening , average SFR, and typical stellar masses . Correlations between physical quantities are detected: the most massive galaxies are those with the largest SFRs and optical reddening . The high SFRs and masses of these galaxies add further support to the notion that these star-forming galaxies are among the precursors of passive EROs and early-type galaxies.
4. The contribution to the total star formation rate density at was estimated for the sBzKs in our fields. These vigorous starbursts produce an SFRD yr-1 Mpc-3, which is already comparable to the global SFRD at as estimated from other surveys and simulations (e.g. Springel & Hernqwist 2003; Heavens et al. 2004). However, a sizable additional contribution is expected from sBzKs.
5. In a similar fashion, the stellar mass of pBzKs was obtained, with the result that the number density of pBzKs more massive than is about 20%7% of that of similarly massive, early-type galaxies at , indicating that additional activity and subsequent quenching of star-formation in star-forming galaxies must account for increasing the number of massive passive galaxies by a factor of about 5 from . The number density of s is similar to that of s. Given their strong star-formation activity, it seems that by –1.4 the full population of local passive galaxies could be eventually assembled as a result.
This result, advocated also in Daddi et al. (2005b), may appear in contradiction with the recent finding by Bell et al. (2004) of a factor of 2 decrease in the number density of early-type galaxies at , with respect to the local value (see also Faber et al. 2005). However, our analysis of the Bell et al (2004) results shows that most of this evolution is to be ascribed to the progressive disappearence with increasing redshift of the fainter galaxies, while the population of the brightest, most massive galaxies being substantially stable. This would be, in fact, another manifestation of the downsizing effect. A future publication will address this point in its full details and implications.
Mapping the metamorphosis of active star-forming galaxies into passively evolving, early-type galaxies from high to low redshifts, and as a function of galaxy mass and environment is one of the primary goals of the main ongoing galaxy surveys. Using Subaru and VLT telescopes, optical and near-infrared spectra are being obtained, with targets from the present database having been selected according to the same criteria adopted in this paper. Future papers in this series will present further scientific results from this pilot survey, along with a variety of data products.
References
- (1) Abraham, R. G., et al. 2004, AJ, 127, 2455
- (2) Adelberger, K. L., & Steidel, C. C. 2000, ApJ, 544, 218
- (3) Adelberger, K. L., Erb, D. K., Steidel, C. C., et al. 2005, ApJ, 620, L75
- (4) Baldry, I. K., Glazebrook, K., Brinkmann, J., et al. 2004, ApJ, 600, 681
- (5) Bell, E. F., et al. 2004, ApJ, 608, 752
- (6) Bertin, E. & Arnouts, S. 1996, A&AS, 117, 393
- (7) Broadhurst, T. J., Ellis, R. S., & Glazebrook, K. 1992, Nature, 335, 55
- (8) Brown, M. J. I., Jannuzi, B. T., Dey, A., Tiede, G. P. 2005, ApJ, 621, 41
- (9) Brusa, M., et al. 2005, A&A, 432, 69
- (10) Bruzual, G. & Charlot, S. 2003, MNRAS, 344, 1000
- (11) Calzetti, D., 2004, proceedings of the conference ‘Starbursts - from 30 Doradus to Lyman Break galaxies’, Cambridge, Sept 2004, eds. de Grijs and Gonzalez-Delgado (astro-ph/0501027)
- (12) Calzetti, D., Armus, L., Bohlin, R. C., et al. 2000, ApJ, 533, 682
- (13) Cardelli, J. A., Clayton, G. C., Mathis, J. S. 1989, ApJ, 345, 245
- (14) Carlberg, R. G., Cowie, L. L., Songaila, A., Hu, E. M. 1997, ApJ, 484, 538
- (15) Cimatti, A., et al. 2002a, A&A, 392, 395
- (16) Cimatti A., et al. 2002,A&A, 381, L68
- (17) Cimatti, A., et al. 2004, Nature, 430, 184
- (18) Cole, S., Lacey, C. G., Baugh, C. M., & Frenk, C. S. 2000, MNRAS, 319, 168
- (19) Cowie, L.L., Songaila, A., Hu. E.M., & Cohen, J.G. 1996, AJ, 112, 836
- (20) Cutri, R. M., et al. 2003, VizieR Online Data Catalog, 2246, 0
- (21) Daddi, E., Cimatti, A., Pozzetti, L., et al. 2000, A&A, 361, 535
- (22) Daddi, E., Broadhurst, T., Zamorani, G., et al. 2001, A&A, 376, 825
- (23) Daddi, E., et al. 2003, ApJ, 588, 50
- (24) Daddi, E., Cimatti, A., Renzini, A., et al. 2004a, ApJ, 617, 746
- (25) Daddi, E., et al. 2004b, ApJ, 600, L127
- (26) Daddi, E., Renzini A., Pirzkal N., et al. 2005a, ApJ, 626, 680
- (27) Daddi, E., Dickinson, M., Chary, R., et al. 2005b, ApJ, 631, L13
- (28) Dickinson, M., Papovich, C., Ferguson, H. C., & Budavári, T. 2003, ApJ, 587, 25
- (29) Doherty, M., Bunker, A. J., Ellis, R. S., McCarthy, P. J. 2005, MNRAS, 361, 525
- (30) Elston, R., Rieke, G. H., & Rieke, M. J. 1988, ApJ, 331, L77
- (31) Faber, S. M., et al., 2005, submitted to ApJ (astro-ph/0506044)
- (32) Fang, F., et al. 2004, ApJS, 154, 35
- (33) Ferguson, H. C., Dickinson, M., & Williams, R. 2000, ARA&A, 38, 667
- Firth et al. (2002) Firth, A. E., et al. 2002, MNRAS, 332, 617
- (35) Fontana, A., et al. 2004, A&A, 424, 23
- (36) Franx, M., et al. 2003, ApJ, 587, L79
- (37) Gardner, J. P., Cowie, L. L., & Wainscoat, R. J. 1993, ApJ, 415, L9
- (38) Georgakakis, A., Afonso, J., Hopkins, A. M., et al. 2005, ApJ, 620, 584
- (39) Giavalisco, M., et al. 2004, ApJ, 600, L93
- (40) Glazebrook, K., Ellis, R., Santiago, B., & Griffiths, R. 1995, MNRAS, 275, L19
- (41) Glazebrook, K., et al. 2004, Nature, 430, 181
- (42) Granato, G. L., De Zotti, G., Silva, L., et al. 2004, ApJ, 600, 580
- (43) Heavens, A., Panter, B., Jimenez, R., Dunlop J. 2004, Nature, 428, 625
- (44) Huang, J.-S., et al. 2001, A&A, 368, 787
- (45) Kauffmann, G. & Charlot, S. 1998, MNRAS, 297, L23
- (46) Kerscher, M., Szapudi, I., & Szalay, A. S. 2000, ApJ, 535, L13
- (47) Kodama, T., Yamada, T., Masayuki, A., et al. 2004, MNRAS, 350, 1005
- (48) Kong, X., Charlot, S., Brinchmann, J., & Fall, S. M. 2004, MNRAS, 349, 769
- (49) Kümmel, M. W. & Wagner, S. J. 2001, A&A, 370, 384
- (50) Landolt, A. U. 1992, AJ, 104, 372
- (51) Landy, S. D., & Szalay, A. S. 1993, ApJ, 412, 64
- (52) Lejeune, T., Cuisinier, F., & Buser, R. 1997, A&AS, 125, 229
- (53) McCarthy, P. J. et al. 2001, ApJ, 560, L131
- (54) McCarthy, P. J. 2004, ARA&A, 42, 477
- (55) McCarthy, P. J., et al. 2004, ApJ, 614, L9
- (56) McCracken, H. J., Metcalfe, N., Shanks, T., et al. 2000, MNRAS, 311, 707
- (57) McLeod, B. A., Bernstein, G. M., Rieke, M. J., et al. 1995, ApJS, 96, 117
- (58) Menci, N., Cavaliere, A., Fontana, A., et al. 2002, ApJ, 575, 18
- (59) Meurer, G. R., Heckman, T. M., & Calzetti, D. 1999, ApJ, 521, 64
- (60) Miyazaki, S. et al. 2002, PASJ, 54, 833
- (61) Moorwood, A., Cuby, J.G., Lidman, C. 1998, The ESO Messenger 91,9
- (62) Moustakas, L. A., Davis, M., Graham, J. R., et al. 1997, ApJ, 475, 445
- (63) Moustakas, L. A., et al. 2004, ApJ, 600, L131
- (64) Nagamine, K., Fukugita, M., Cen, R., et al. 2001, MNRAS, 327, L10
- (65) Nagamine, K., Cen, R., Hernquist, L., et al. 2005, ApJ, 627, 608
- (66) Oliver, S., et al. 2004, ApJS, 154, 30
- (67) Ouchi, M., et al. 2004, ApJ, 611, 660
- (68) Persson, S. E., Murphy, D. C., Krzeminski, W., et al. 1998, AJ, 116, 2475
- (69) Pickles, A. J. 1998, PASP, 110, 863
- (70) Ranalli, P., Comastri, A., Setti, G. 2003, A&A, 399, 39
- (71) Reddy, N. A., Erb, D. K., Steidel, C. C., et al. 2005, ApJ, 633, 748
- Renzini & da Costa (1997) Renzini, A., & da Costa, L. N. 1997, The Messenger, 87, 23
- (73) Roche, N., Eales, S. A., Hippelein, H., et al. 1999, MNRAS, 306, 538
- (74) Roche, N. D., Dunlop, J., & Almaini, O. 2003, MNRAS, 346, 803
- (75) Saracco, P., Iovino, A., Garilli, B., et al. 1997, AJ, 114, 887
- (76) Saracco, P., et al. 2005, MNRAS, 357, L40
- (77) Schlegel, D. J., Finkbeiner, D. P., & Davis, M. 1998, ApJ, 500, 525
- (78) Shapley, A. E., Erb, D. K., Pettini, M., et al. 2004, ApJ, 612, 108
- (79) Shapley, A. E., Steidel, C. C., Erb, D. K., et al. 2005, ApJ, 626, 698
- (80) Smith, J. A., et al. 2002, AJ, 123, 2121
- (81) Somerville, R. S. 2004a, in Multiwavelength Mapping of Galaxy Formation and Evolution, eds. R. Bender and A. Renzini, astro-ph/0401570
- (82) Somerville, R. S., Lee, K., Ferguson, H. C., et al. 2004b, ApJ, 600, L171
- (83) Somerville, R. S., et al. 2004c, ApJ, 600, L135
- (84) Springel, V., Hernquist, L. 2003, MNRAS, 339, 312
- (85) Steidel, C. C., Giavalisco, M., Pettini, et al. 1996, ApJ, 462, L17
- (86) Steidel, C. C., Shapley, A. E., Pettini, M., et al. 2004, ApJ, 604, 534
- (87) Thompson, D., et al. 1999, ApJ, 523, 100
- (88) Treu, T., Ellis, R.S., Liao, T.X., & Cohen, J.G. 2005, ApJ, 622, L5
- (89) Vandame, B. 2002, Proc. SPIE, 4847, 123
- (90) Yagi, M., Kashikawa, N., Sekiguchi, M., et al. 2002, AJ, 123, 66
- (91) Yan, L., Thompson, D., Soifer, B. T. 2004, AJ, 127, 1274