The Araucaria Project: The Distance to NGC 300 from the Red Giant Branch Tip using HST/ACS imaging111Based on observations made with the NASA/ESA Hubble Space Telescope, obtained at the Space Telescope Science Institute, which is operated by the Association of Universities for Research in Astronomy, Inc., under NASA contract NAS 5-26555. These observations are associated with program # GO-9492.
Abstract
We have used the Advanced Camera for Surveys on board the Hubble Space Telescope to obtain deep photometry of the NGC 300 spiral galaxy in the Sculptor group. The results have been used to derive an accurate distance determination based on the Tip of the Red Giant Branch distance estimator. Both edge-detection and maximum likelihood methods have been applied, to derive a distance modulus for edge-detection, and for maximum likelihood. These results are fully consistent with the recent distance estimate derived from near-IR photometry of Cepheids variable stars in the context of the Araucaria project, (Gieren et al., 2005).
1 Introduction
The brightest of five main spiral galaxies that form the Sculptor group, NGC 300 is a fairly typical late-type galaxy (Tully, 1988) at a distance of Mpc (Freedman et al., 1992).
Most of the measurements of the distance to this galaxy are based on the luminosity of its Cepheid variables population. Based on near-infrared H-band observations of two long-period Cepheid variables, Madore et al. (1987) reported a distance modulus . The distance was slightly revised by Walker (1988) who derived a distance modulus . Additional photometry of the same sample of variables by Freedman et al. (1992) resulted in the already quoted distance , subsequently revised to in Sakai et al. (2004).
More recently, NGC 300 has been selected as a key target for the Araucaria Project222http://ifa.hawaii.edu/bresolin/Araucaria. Pietrzyński et al. (2002) presented an extensive characterization of 117 Cepheid variables, most of which were new discoveries, observed with the 2.2m ESO/MPI telescope at La Silla, Chile. Additional V and I data were obtained by Gieren et al. (2004) at Las Campanas and Cerro Tololo. Deep, near-infrared J and K band observations were obtained with ESO VLT using the ISAAC camera, resulting in a final distance modulus (Gieren et al., 2005).
The superb angular resolution offered by the Hubble Space Telescope has recently open the possibility of determining the distance to NGC 300 using the Tip of the Red Giant Branch (TRGB). A set of HST WFPC2 fields were analyzed by Sakai et al. (2004) and Butler et al. (2004), and more recently by Tikhonov et al. (2005). The derived distance moduli are , , and , respectively.
In this paper, we present the first TRGB distance based on deep ACS observations of NGC 300. These data are the deepest ever obtained for this galaxy, and they sample both the inner bulge and the outer disk. The paper is organized as follows: Section 2 presents the data, the reduction techniques we adopted, and the resulting color-magnidute diagrams (CMD). We describe the TRGB method and its application to NGC 300 in Section 3. We discuss our results in Section 4 and a brief summary is presented in Section 5.
2 Observations, Data reduction, and Color-Magnitude Diagrams
The ACS observations used to derive a new TRGB distance to NGC 300 were obtained during HST Cycle 11, as part of program GO-9492 (PI: Bresolin), from July 2002 to December 2002. The main purpose of these observations was to complement the extensive ground-based CCD photometry of Cepheid variable stars and blue supergiant stars collected in the framework of the Araucaria project. Two-orbit HST visits allowed to obtain deep photometry in the F435W, F555W (1080 seconds), and F814W (1440 seconds) filters. A total of six fields were observed.
Stellar photometry was performed with the DOLPHOT (version 1.0) package, an adaptation of HSTphot (Dolphin, 2000) to ACS images. Pre-computer Point Spread Functions were adopted, and the final calibrated photometry was then transformed to the standard BVI system using the equations provided by Sirianni et al. (2005). The transformation from one photometric system to another inevitably introduces additional uncertainties but it seems necessary given that most of the calibrations of the absolute magnitude of the TRGB are in the I band. For a more extended discussion of the issues related to calibration see Bresolin et al. (2005).
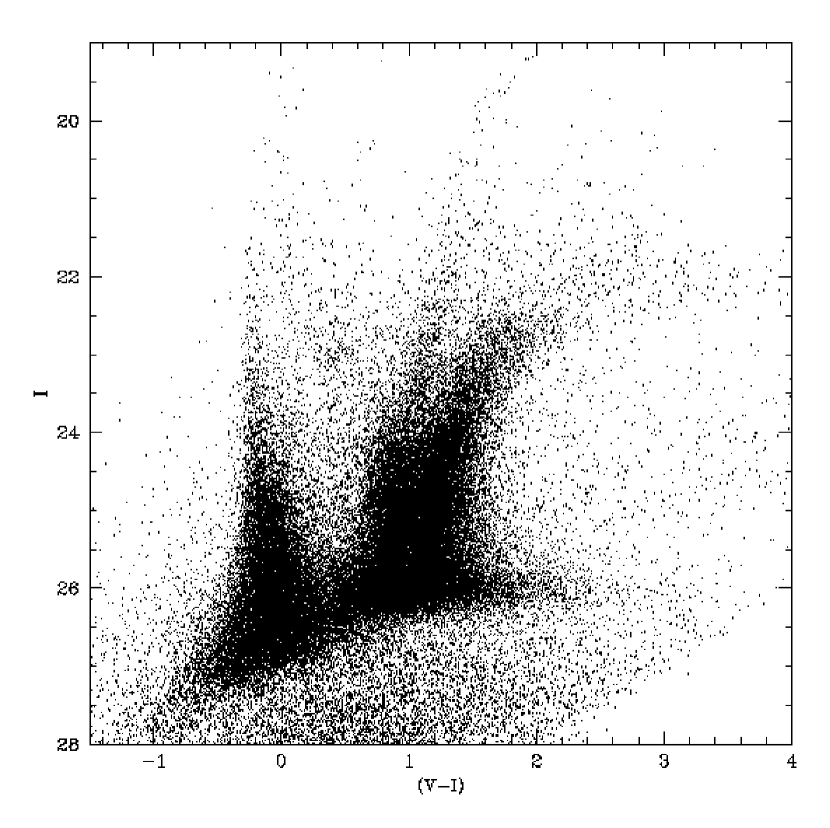
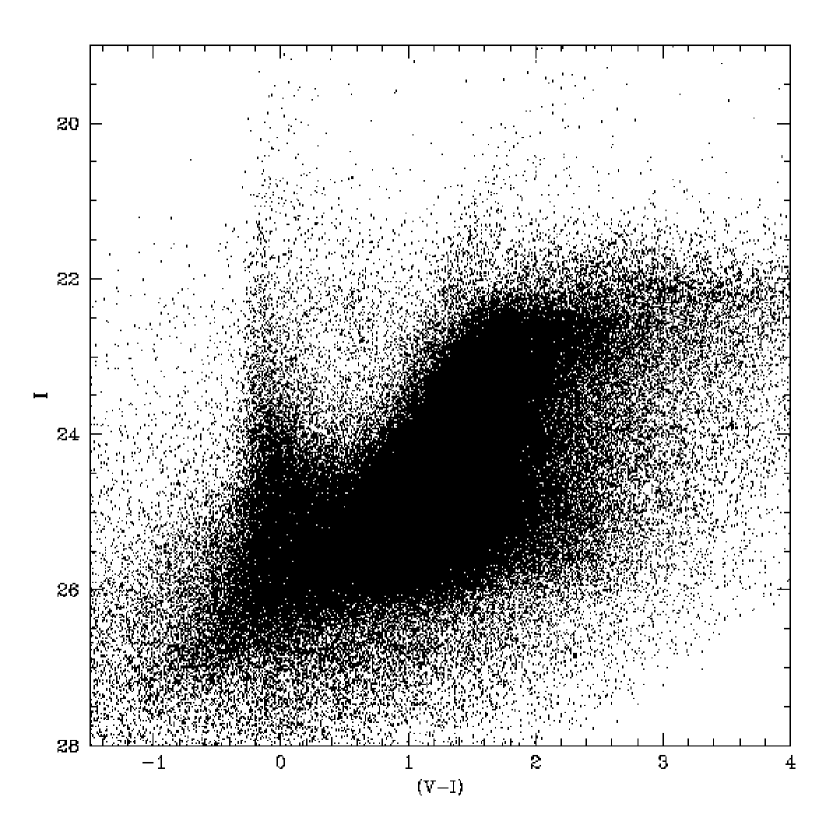
As an example of the quality of the results, the final calibrated CMDs are shown in Figures 1 and 2 for Fields 1 and 3, respectively. Field 1 is situated close to the eastern outer edge, while Field 3 is centered on the nucleus of the galaxy (see Bresolin et al., 2005, for a map of the observed Fields). All the CMDs show a very well pronounced sequence of blue young stars, reaching down to the lower age limit of isochrone sets ( Myr, Girardi et al., 2000). Blue-loop stars occupy the central region of the diagrams, and a well defined red giant branch (RGB) extends from I down to the photometric detection limit, I . A full discussion of the CMD features, along with a reconstruction of the star formation history, will be presented in a forthcoming paper.
3 The Distance to NGC300
3.1 Detection of the tip
The distance estimates based on the RGB tip rest on a solid physical basis: low-mass stars reach the end of their ascent along the RGB with a degenerate helium core and they ignite helium burning within a very narrow range of luminosity (Salaris et al., 2002, and references therein). The potential of the method was revealed in a seminal paper by Lee and collaborators (Lee et al., 1993), along with a first attempt at objectively estimate the position of the tip on the CMD based on a digital edge-detection (ED) filter in the form [-2,0,2], applied to the I band luminosity function. This filter effectively responds to changes in the slope of the luminosity function and displays a peak corresponding to the TRGB. A refined version of this method was presented in Sakai et al. (1996). More recently, a different approach was suggested by Méndez et al. (2002). To avoid problems related to binning, this method uses a maximum-likelihood (ML) analysis to get the best fit of a parametric RGB luminosity function to the observed one. Each of these methods has advantages and disadvantages. ED methods are quite sensitive to binning, but they don’t require any a priori assumption on the shape of the RGB luminosity function. ML methods use much more information, because every star of the sample contributes to the probability distribution, but they use a theoretical luminosity function as an input parameter. In this work, we use both approaches and we discuss the different results.
Whenever color information is available, it is advisable to restrict the analysis of the luminosity function to a suitable region carefully chosen to represent the RGB. To perform this selection, we took into account the available calibrations of the absolute magnitude of the RGB tip. As discussed in Section 3.2, one of the most reliable calibrations available to date is based on the absolute magnitude of the RGB tip measured on a large sample of stars of the globular cluster Centauri (Bellazzini et al., 2001), at a metallicity of . To be able to apply this calibration to our data, we decided to select our RGB stars using the ridge line of Centauri and selecting stars in a narrow (0.1 mag) range on both sides of it. Section 3.2 will present a discussion of the implications of this choice.
The upper panels of Figures 3 - 8 show the detection of the RGB tip using the ML approach presented by Méndez et al. (2002). The continuous line shows the observed RGB luminosity function, while the best fit is shown by a dashed line. The results of the detection are presented in columns 4 and 5 of Table 1. The lower panels of the same set of Figures show the detection of the RGB tip using the ED filter in a version similar to the one presented in Sakai et al. (1996). The continuous line shows the response of the ED filter, while the vertical line indicates the position of the center of the highest peak. The results of the measurements are reported in columns 2 and 3 of Table 1.
The discontinuity in the luminosity function due to the RGB tip is conspicuous in most cases, although a significant amount of contamination from AGB stars is affecting Fields 2 and 3, producing a rather smooth slope at the level of the RGB tip. The effect of an AGB contamination has been investigated in many studies, (e.g., see Makarov et al., 2005; Barker et al., 2004). The conclusion is that in most cases the RGB tip detection is quite insensitive to the effect of this contamination. This result is further confirmed by looking at the results presented here. Indeed, the RGB tip positions measured in Fields 2 and 3 do not significantly differ from the positions measured in any other field.
To estimate the errors connected with the detection of the RGB tip, we adopted a bootstrap resampling strategy similar to the one presented in Méndez et al. (2002). The sample of stars chosen to represent the RGB was resampled 500 times, and the RGB tip measured for each realization. The r.m.s. of the results is then quoted in columns 3 and 5 of Table 1, for ED and ML methods, respectively.
| Edge detector | Maximum likelihood | |||
|---|---|---|---|---|
| Field | IRGBT | IRGBT | ||
| 1 | 22.48 | 0.09 | 22.50 | 0.03 |
| 2 | 22.40 | 0.03 | 22.48 | 0.02 |
| 3 | 22.48 | 0.06 | 22.50 | 0.02 |
| 4 | 22.42 | 0.16 | 22.48 | 0.06 |
| 5 | 22.50 | 0.10 | 22.50 | 0.02 |
| 6 | 22.39 | 0.12 | 22.45 | 0.08 |


3.2 Distance modulus
The first calibration of the absolute magnitude of the RGB tip dates back to the early 1990’s. Lee et al. (1993) defined the distance modulus based on the RGB tip as
where is the bolometric correction to the I magnitude, and is the bolometric magnitude of the TRGB. and are given in Da Costa & Armandroff (1990) as and . These calibrations are based on the distance scale of Lee et al. (1990) where the magnitude of RR Lyrae stars is . All these relations are based on a small sample of RGB stars observed in a few template globular clusters, and they only cover the range . An extensive set of computer simulations was performed by Madore & Freedman (1995) to test for possible systematic effects on the detection of the RGB tip. The authors found that a reasonable lower limit to the number of stars within 1 magnitude from the tip is 50. Below this level, strong biases can affect the determined magnitude of the tip. Note that in the sample of Da Costa & Armandroff (1990) the number of stars within 1 magnitude from the tip is never larger than 20, and can be as low as 2.
A significant improvement on this situation was presented by Bellazzini et al. (2001). In their work, the authors derive a new calibration of the magnitude of the tip in the form . The result is based on an extensive sample of stars observed in different bands including the near-IR and presented in Ferraro et al. (1999, 2000). Although based on a larger sample of stars than the one presented in Lee et al. (1993), this calibration still does not meet the completeness criteria established by Madore & Freedman (1995). In addition, both this calibration and the one by Lee et al. (1993) require a knowledge of the metallicity of the underlying population, either measured independently or deduced from the color of the RGB, iterating through measurements of the distance and the metallicity.
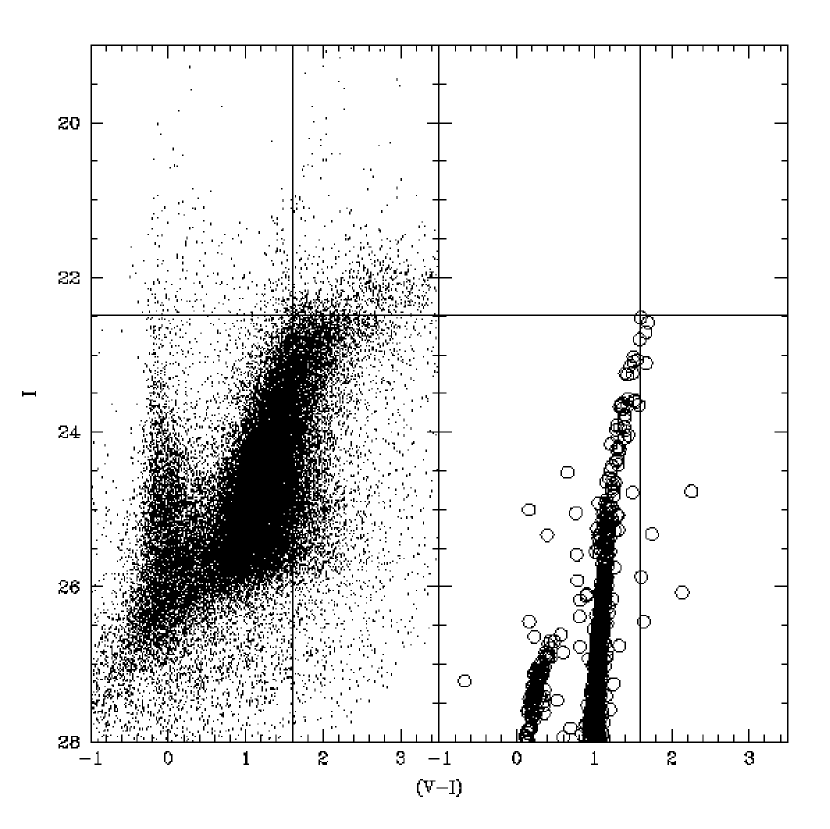
The only calibration based on a sufficient number of stars is derived for Centauri by Bellazzini et al. (2001). According to this calibration, the absolute magnitude of the RGB tip is at a metallicity of . This value is tied to the distance of the eclipsing binary OGLEGC 17 in Centauri (Thompson et al., 2001), and it’s completely independent from any other optical RR Lyrae distances. A possible source of uncertainty associated with this calibration is the wide and complex color/metallicity distribution observed in Centauri, but several studies have shown that the dominant population is rather metal-poor, and that the peak of the metallicity distribution is at (Pancino et al., 2000; Suntzeff & Kraft, 1996). In this work, we will adopt the value . We note that this assumption is the reason behind our choice of the selection criteria we have adopted to define the RGB sample, as can be verified in Figure 9. The left panel of Figure 9 shows the CMD of NGC 300, Field 2. Only 20 % of the stars are plotted, for easier reading. The right panel shows the CMD of Centauri from Rosenberg et al. (2000a, b). Horizontal and vertical lines show the position of the RGB tip as measured in NGC 300. It is evident that it is possible to define in NGC 300 a sample of RGB stars that perfectly overlaps with the RGB of Centauri.
Assuming (Gieren et al., 2005), we derived distance moduli both with the ED and ML methods, and for the 6 ACS Fields. The results are presented in Table 2. To estimate the errors attached to these measurements, we separate the errors connected to the detection of the tip and the photometric calibration (internal error) and the errors due to the extinction correction and the calibration of the absolute magnitude of the tip (external error). The errors due to the detection of the tip have already been discussed earlier in this Section. The errors connected with the conversion from ACS photometric system and BVI system can be quantified in 0.02 mag (Sirianni et al., 2005). The error attached to the measurement provided by Gieren et al. (2005) is 0.006 mag, which accounts for a total of 0.01 mag attached to . Finally, the error in the absolute calibration is 0.12 mag (Bellazzini et al., 2001), and it’s basically determined by the uncertainty in the distance to Centauri (Thompson et al., 2001). The total amount of internal errors attached to the different distance moduli computed for the six Fields are reported in columns 3 and 5 of Table 2, for ED and ML methods, respectively.
| Edge detector | Maximum likelihood | |||
|---|---|---|---|---|
| Field | ||||
| 1 | 26.35 | 0.09 | 26.37 | 0.03 |
| 2 | 26.26 | 0.04 | 26.35 | 0.03 |
| 3 | 26.35 | 0.06 | 26.37 | 0.03 |
| 4 | 26.28 | 0.16 | 26.35 | 0.06 |
| 5 | 26.37 | 0.10 | 26.37 | 0.03 |
| 6 | 26.26 | 0.13 | 26.32 | 0.08 |
To derive our final distance moduli, we computed a weighted mean of the measurements in the six Fields. The results are:
and
4 Discussion
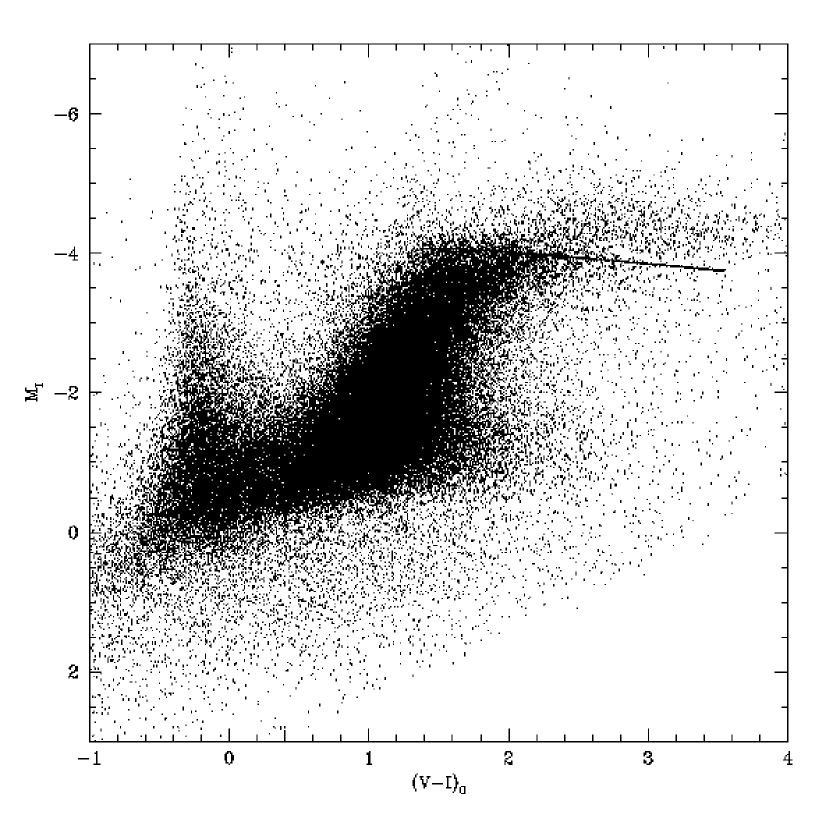
Our selection of the sample of the stars representing the RGB is entirely motivated by our choice of the absolute calibration of the RGB tip. This approach actually limits the analysis to about 20 % of the total number of available RGB stars. As an alternative approach, one could choose to adopt a much larger sample of RGB stars, reaching the high-metallicity edge of the RGB. We argue that this approach would provide consistent results, but with a lower precision. This is shown in Figure 10. In this Figure we plot the CMD of NGC 300, Field 2, in the absolute plane, using the distance and the reddening provided by Gieren et al. (2005). The continuous line shows the color dependence of the RGB tip according to Bellazzini et al. (2001). It is evident that the slope of the function reproduces very closely the observed data. On the other hand, using the high-metallicity part of the CMD would introduce additional errors due the still uncertain slope of the high-metallicity extension of the calibration.
Another issue that should be given attention to is the age of the underlying population used to define the RGB sample. Whenever the RGB tip technique is applied to a composite stellar population, the possibility of biases arises, due to the fact that the presence of a well-developed and populated RGB does not necessarily imply the presence of a globular cluster-like population, while the calibration of the absolute magnitude of the RGB tip relies completely on a sample of globular clusters. Barker et al. (2004) reported that the RGB distances are rather insensitive to the stellar populations provided most of the stars are more metal poor than and that there is not a strong star formation burst between 1 and 2 Gyr. Salaris & Girardi (2005) extended this analysis to real cases, and showed that applying the standard technique for RGB tip distances to the LMC and to the SMC could result in significant deviations from the real value, due to the underestimation of the correct metallicity. We argue that the TRGB method can be safely applied to NGC 300, without introducing age- or metallicity-related biases. Indeed, Butler et al. (2004) have shown that the star formation history of this galaxy has been rather uniform throughout all its life, and they found no indication for an increased star formation rate at young ages, except for a possible final burst at 200-100 Myr. Besides, both Butler et al. (2004) and the results of the Araucaria project (Bresolin et al., 2002; Urbaneja et al., 2003) show that the metallicity of NGC 300 has probably been lower than for the whole life of the galaxy.
The result presented in this paper is fully consistent with the results recently derived by Gieren et al. (2005), based on the luminosity of Cepheids variable stars. Our distance modulus is also consistent with the one derived by Butler et al. (2004), provided the difference in the adopted reddening correction is taken into account. Indeed, the observed magnitude of the RGB tip that we derived is consistent within the errors with the value measured by Butler et al. (2004), but the authors then apply a reddening correction (Schlegel et al., 1998), which is much lower than the value adopted in this paper, resulting in a distance modulus . Similar considerations apply to the results published by Tikhonov et al. (2005), although in this case we do not know what is the adopted calibration of the absolute magnitude of the RGB tip, and the reddening correction applied.
On the other hand, the results presented here show a significant discrepancy with the measurements of Sakai et al. (2004), who published a distance modulus . The total difference between this value and our value is magnitudes. Half of this difference can be explained by the different assumption of the reddening, as in the case of the distance presented by Butler et al. (2004), but a further difference of remains to be explained. It appears that this difference can be accounted for by the difference in the estimated level of the RGB tip, measured at in this paper, and at by Sakai et al. (2004). It is difficult to provide an explanation for this difference, but a value of is not compatible with our data. Besides, it is interesting to notice that the data analyzed by Sakai et al. (2004) were also analyzed by Butler et al. (2004), indicated as field F3. Both groups determined the RGB tip around 22.6, but they also warned the reader that the field analyzed was poorly populated, and that the determination could be uncertain. Indeed, Butler et al. (2004) rejected the result derived from this WFPC2 field as non reliable. Butler et al. (2004) also analyzed an additional field, indicated as field F1, and for that field they derived the already quoted value of , in agreement with our determination. Our conclusion is that WFPC2 and ACS measurements agree within the errors when sufficient number of stars are used, as is the case of field F3 of Butler et al. (2004).
Finally, Sakai et al. (2004) also reported that the Cepheids distance to NGC300, based on the measurements of Freedman et al. (1992), is , but using the calibration of Udalski et al. (1999) the distance would be , which would be in agreement with our determination if our value for the reddening would be used.
5 Conclusions
We have presented a new measurement of the distance to NGC 300 based on the deepest available photometry catalog, obtained with the Advanced Camera for Survey on board the Hubble Space Telescope. We have used both edge-detection and maximum likelihood methods, and we have applied the methods independently to six different ACS Fields. All the Fields give consistent results. We have also discussed the possibility of biases in our results related to the application of the TRGB method to a composite stellar population, and we have concluded that NGC 300 is likely to be a case in which this distance estimator can be safely applied. Our result is fully consistent with the recent distance determination from near-infrared photometry of Cepheids variables (Gieren et al., 2005). Since their result is tied to an assumed LMC distance modulus of 18.50, our independent TRGB distance determination of NGC 300 supports a distance of LMC of, or very close to, 18.50. The distance modulus we derive is also consistent with other recent determinations based on the TRGB (Tikhonov et al., 2005; Butler et al., 2004) if our reddening value is used in these studies; however, our present determination has succeeded in reducing the internal errors of the result by a factor .
References
- Barker et al. (2004) Barker, M. K., Sarajedini, A., & Harris, J. 2004, ApJ, 606, 869
- Bellazzini et al. (2001) Bellazzini, M., Ferraro, F. R., & Pancino, E. 2001, ApJ, 556, 635
- Bresolin et al. (2002) Bresolin, F., Gieren, W., Kudritzki, R.-P., Pietrzyński, G., & Przybilla, N. 2002, ApJ, 567, 277
- Bresolin et al. (2005) Bresolin, F., Pietrzyński, G., Gieren, W., & Kudritzki, R.-P. 2005, ApJ, in press
- Butler et al. (2004) Butler, D. J., Martínez-Delgado, D., & Brandner, W. 2004, AJ, 127, 1472
- Da Costa & Armandroff (1990) Da Costa, G. S. & Armandroff, T. E. 1990, AJ, 100, 162
- Dolphin (2000) Dolphin, A. E. 2000, PASP, 112, 1383
- Ferraro et al. (1999) Ferraro, F. R., Messineo, M., Fusi Pecci, F., de Palo, M. A., Straniero, O., Chieffi, A., & Limongi, M. 1999, AJ, 118, 1738
- Ferraro et al. (2000) Ferraro, F. R., Montegriffo, P., Origlia, L., & Fusi Pecci, F. 2000, AJ, 119, 1282
- Freedman et al. (1992) Freedman, W. L., Madore, B. F., Hawley, S. L., Horowitz, I. K., Mould, J., Navarrete, M., & Sallmen, S. 1992, ApJ, 396, 80
- Gieren et al. (2005) Gieren, W., Pietrzyński, G., Soszyński, I., Bresolin, F., Kudritzki, R.-P., Minniti, D., & Storm, J. 2005, ApJ, 628, 695
- Gieren et al. (2004) Gieren, W., Pietrzyński, G., Walker, A., Bresolin, F., Minniti, D., Kudritzki, R.-P., Udalski, A., Soszyński, I., Fouqué, P., Storm, J., & Bono, G. 2004, AJ, 128, 1167
- Girardi et al. (2000) Girardi, L., Bressan, A., Bertelli, G., & Chiosi, C. 2000, A&AS, 141, 371
- Lee et al. (1993) Lee, M. G., Freedman, W. L., & Madore, B. F. 1993, ApJ, 417, 553
- Lee et al. (1990) Lee, Y.-W., Demarque, P., & Zinn, R. 1990, ApJ, 350, 155
- Madore & Freedman (1995) Madore, B. F. & Freedman, W. L. 1995, AJ, 109, 1645
- Madore et al. (1987) Madore, B. F., Welch, D. L., McAlary, C. W., & McLaren, R. A. 1987, ApJ, 320, 26
- Makarov et al. (2005) Makarov, D., Makarova, L., Rizzi, L., Tully, R., Dolphin, A., Sakai, S., & Shaya, E. 2005, in preparation
- Méndez et al. (2002) Méndez, B., Davis, M., Moustakas, J., Newman, J., Madore, B. F., & Freedman, W. L. 2002, AJ, 124, 213
- Pancino et al. (2000) Pancino, E., Ferraro, F. R., Bellazzini, M., Piotto, G., & Zoccali, M. 2000, ApJ, 534, L83
- Pietrzyński et al. (2002) Pietrzyński, G., Gieren, W., Fouqué, P., & Pont, F. 2002, AJ, 123, 789
- Rosenberg et al. (2000a) Rosenberg, A., Aparicio, A., Saviane, I., & Piotto, G. 2000a, A&AS, 145, 451
- Rosenberg et al. (2000b) Rosenberg, A., Piotto, G., Saviane, I., & Aparicio, A. 2000b, A&AS, 144, 5
- Sakai et al. (2004) Sakai, S., Ferrarese, L., Kennicutt, R. C., & Saha, A. 2004, ApJ, 608, 42
- Sakai et al. (1996) Sakai, S., Madore, B. F., & Freedman, W. L. 1996, ApJ, 461, 713
- Salaris et al. (2002) Salaris, M., Cassisi, S., & Weiss, A. 2002, PASP, 114, 375
- Salaris & Girardi (2005) Salaris, M. & Girardi, L. 2005, MNRAS, 357, 669
- Schlegel et al. (1998) Schlegel, D. J., Finkbeiner, D. P., & Davis, M. 1998, ApJ, 500, 525
- Sirianni et al. (2005) Sirianni, M., Jee, M. J., Benitez, N., Blakeslee, J. P., Martel, A. R., Meurer, G., Clampin, M., De Marchi, G., Ford, H. C., Gilliland, R., Hartig, G. F., Illingworth, G. D., Mack, J., & McCann, W. J. 2005, PASP, in press
- Suntzeff & Kraft (1996) Suntzeff, N. B. & Kraft, R. P. 1996, AJ, 111, 1913
- Thompson et al. (2001) Thompson, I. B., Kaluzny, J., Pych, W., Burley, G., Krzeminski, W., Paczyński, B., Persson, S. E., & Preston, G. W. 2001, AJ, 121, 3089
- Tikhonov et al. (2005) Tikhonov, N. A., Galazutdinova, O. A., & Drozdovsky, I. O. 2005, A&A, 431, 127
- Tully (1988) Tully, R. B. 1988, Nearby galaxies catalog (Cambridge and New York, Cambridge University Press, 1988, 221 p.)
- Udalski et al. (1999) Udalski, A., Szymanski, M., Kubiak, M., Pietrzynski, G., Soszynski, I., Wozniak, P., & Zebrun, K. 1999, Acta Astronomica, 49, 201
- Urbaneja et al. (2003) Urbaneja, M. A., Herrero, A., Bresolin, F., Kudritzki, R.-P., Gieren, W., & Puls, J. 2003, ApJ, 584, L73
- Walker (1988) Walker, A. R. 1988, PASP, 100, 949