Mopra Observations of G305.2+0.2: Massive Star Formation at Different Evolutionary Stages?
Abstract
We have successfully used a new on-the-fly mapping technique with the Mopra radiotelescope to image G305.2+0.2 in transitions of 13CO, HCO+, N2H+, CH3CN and CH3OH. All these species appear to be concentrated towards the infrared-quiet methanol maser site G305A (G305.21+0.21). We suggest that this region contains an extremely deeply embedded site of massive star formation, with comparable qualities to the low mass Class 0 stage. The infrared-bright methanol maser site G305B (G305.21+0.20) also exhibits emission in all the mapped transitions, but always at a lower level. We suggest this is because it harbours a site of massive star formation older and more developed than G305.21+0.21. All transitions appear to be extended beyond the size of the Mopra beam (30″). 13CO and HCO+ line wings are suggestive of an outflow in the region, but the spatial resolution of these data is insufficient to identify the powering source. A narrow-lined (1.6 km s-1 compared to a typical line FWHM of 6.4 km s-1) N2H+ source (G305SW) is found 90″ to the south-west of the main star forming centres, which does not correspond to any CH3CN or CH3OH source, nor does it correspond well to 13CO or HCO+ emission in the vicinity. We suggest this may be a massive, cold, quiescent and possibly prestellar core.
keywords:
masers – stars: formation – infrared: ISM – ISM: molecules1 Introduction
The study of the early stages of massive star formation (MSF) in our Galaxy has, until recently, studied relatively litte. However, with the advent of telescopes, particularly in the millimetre (mm) and sub-mm part of the electromagnetic spectrum, it has become possible to study the earliest stages of MSF. Here is the strongest part of their spectral energy distribution (SED) measureable from the ground, as well as a myriad of complex molecular transitions, allowing investigation of the chemistry surrounding these young sources.
G305.2+0.2 is a site of MSF in the southern Galactic plane shown in Figure 1. Class II methanol masers were reported in two positions by Norris et al. (1993): G305.21+0.21 (hereafter G305A) and G305.20+0.21 (hereafter G305B), separated by approximately 22″. In G305A, the masers are extended along a line with four individual maser spots aligned in approximately the NE–SW direction (Norris et al., 1993). The maser flux is over 250 Jy. G305B, on the other hand, contains two weak maser spots. Walsh et al. (1999) observed this region in the near-infrared (see Figure 1) and found that whilst G305A is not associated with any infrared source, G305B is coincident with a bright and very reddened infrared source. More sensitive near-infrared observations by De Buizer (2003) indicate that there is indeed a weak infrared source coincident with G305A, however, it is not clear if it is associated with the maser site or is instaead an unrelated foreground star. Observations in the mid-infrared (10.5 and 20 m) by Walsh et al. (2001) confirm the infrared source associated with G305B has a steeply rising spectral energy distribution towards longer wavelengths. However, no mid-infrared source was found associated with G305A. Neither maser site is coincident with any detected radio continuum source (Phillips et al., 1998a). However, one might be expected from G305B, since extrapolation of its SED (Walsh et al., 2001) indicates it is powered by a star bright enough to produce an observable ultracompact (UC) HII region.
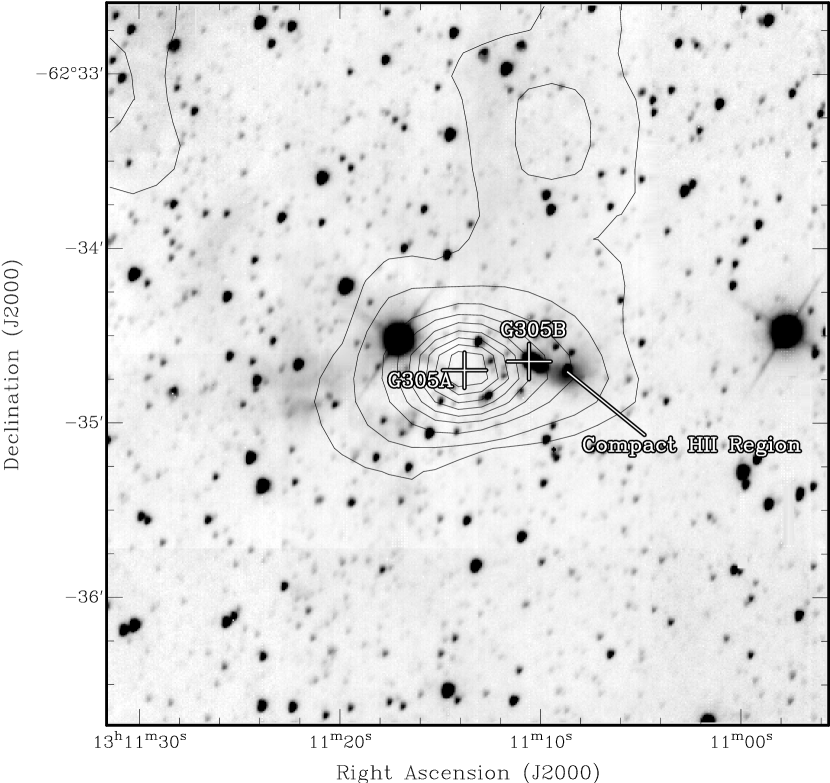
The nature of this region is puzzling. It is not clear why such a bright infrared source associated with G305B has no radio continuum counterpart. Furthermore, it is not known why the brightest maser site, G305A is not associated with a bright infrared source, nor a radio continuum source. Figure 1 shows 1.2 mm continuum contours, which show a source centred on G305A, suggesting there is a dense dust core. The emission appears to be slightly elongated in the direction of G305B. Therefore it appears G305B may be associated with a weaker dust core, which is spatially unresolved with these observations. In this paper, we attempt to better understand these sources by looking for mm molecular line emission, to trace the dense gas and chemistry of the region.
2 Mopra Observations
The Australia Telescope National Facility Mopra telescope is a 22 m antenna located 26 km outside the town of Coonabarrabran in New South Wales, Australia. It is at an elevation of 850 metres above sea level and at a latitude of 31∘ south.
The receiver comprises of a set of cryogenically cooled low noise SIS mixers which operate between 85 and 115 GHz The backend is a digital autocorrelator which was used to provide a bandwidth of 64 MHz over 1024 channels.
Observations were performed between 15-19 October, 2004. They typically took place during overcast weather conditions. Maps were obtained using a new on-the-fly (OTF) method for Mopra, where the telescope scanned in the Right Ascension direction whilst data were being accumulated. Data were reduced using livedata and gridzilla, which are both AIPS++ packages written for the Parkes radiotelescope and adapted for Mopra.
Table 1 summarises the molecular and ionic line transitions mapped towards G305.2+0.2.
| Observed | Rest Frequency | Map |
|---|---|---|
| Line | (GHz) | Size |
| 13CO (1–0) | 110.201353 | 5′ 5′ |
| HCO+ (1–0) | 89.188518 | 5′ 5′ |
| N2H+ (1–0) | 93.173258 | 5′ 5′ |
| CH3CN (5–4) | 91.987089 | 3.5′ 4′ |
| CH3OH (–)A+ | 96.741420 | 5′ 4′ |
| CH3OH (–)A- | 86.615578 | 2.5′ 2′ |
3 Results
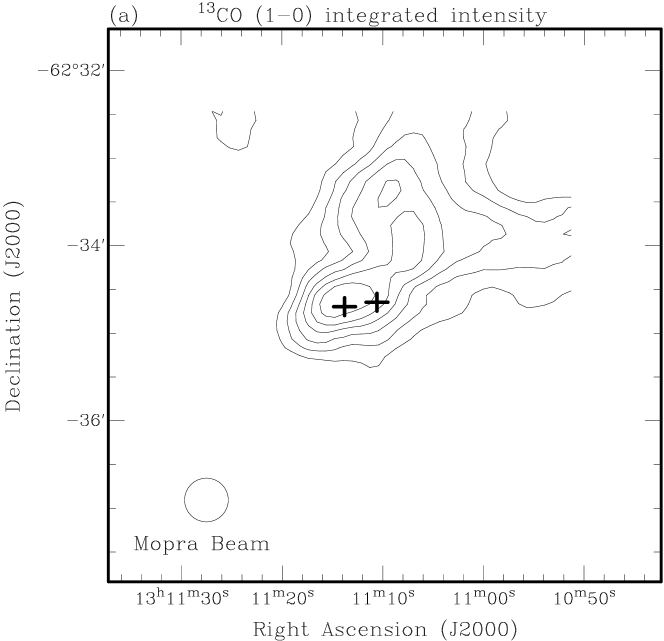
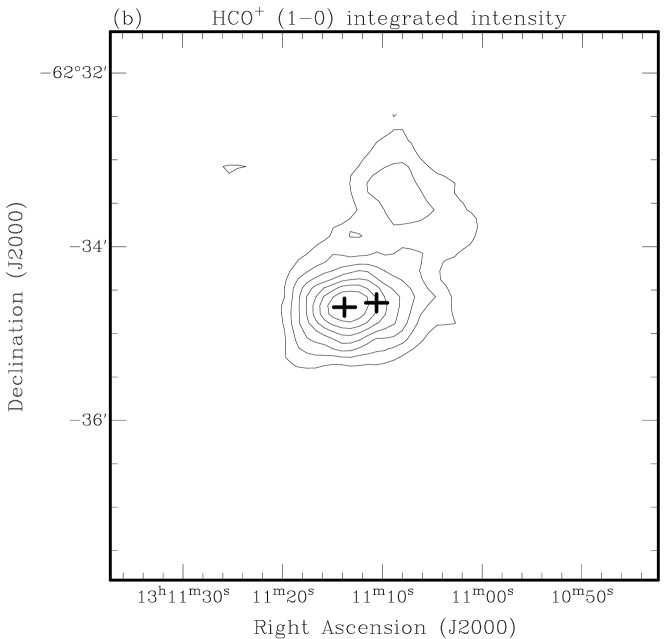
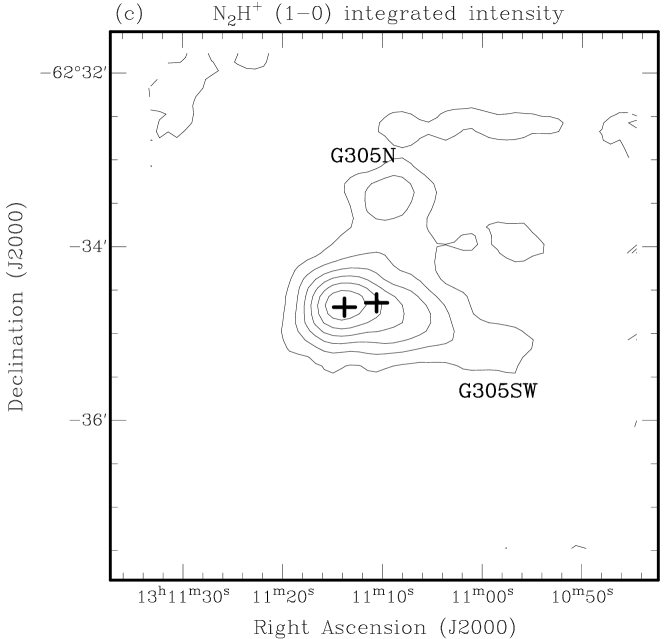
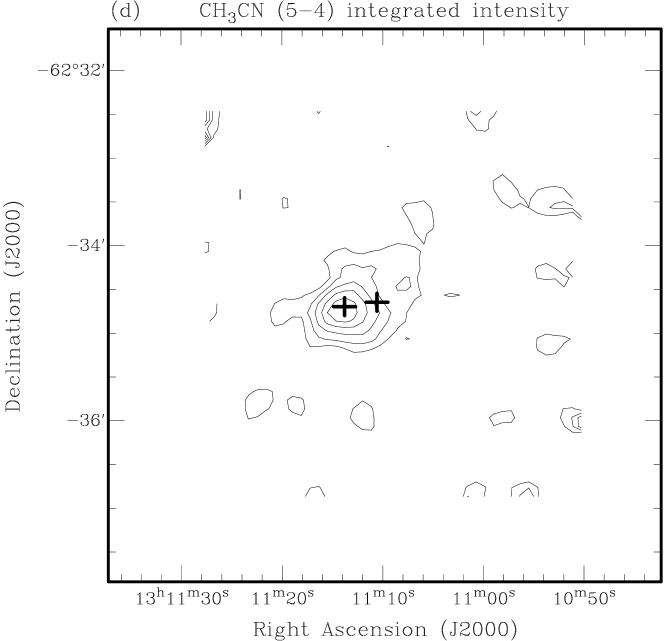
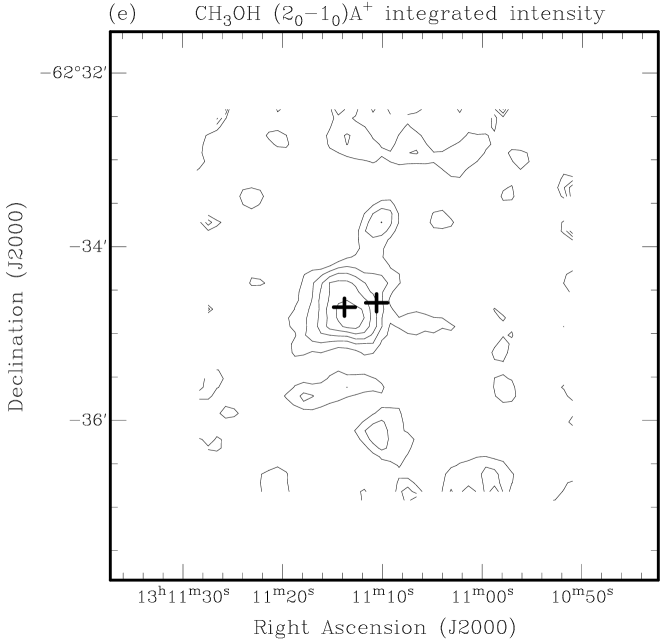
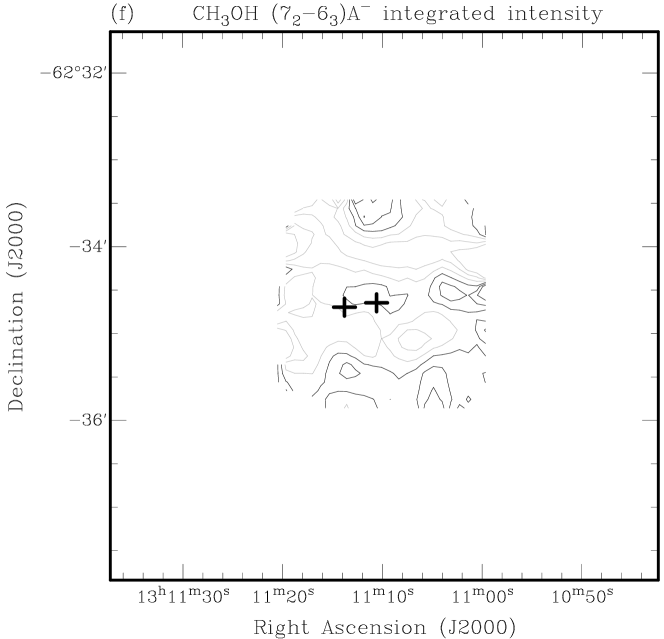
Integrated intensity maps of the observed transitions are shown in Figure 2. It can be seen from the figure that the five detected lines appear to peak at the position of G305A. Only CH3OH (–)A- transition at 86.6GHz was not detected. Furthermore, 13CO, HCO+, N2H+ and CH3OH all show extended emission, with most of the emission centred on G305A together with a spur of emission to the north extending approximately 2′ (hereafter G305N). In addition to this, N2H+ also shows a spur to the SW of G305A, extending about 2′ (hereafter G305SW). CH3CN appears to show some extended emission leading away from G305A to the west, but this lies close to the orientation of the OTF scan and is close to the noise level in the map. It may be an artifact. Therefore we consider the CH3CN emission to be essentially unresolved and centred on G305A, although we do not discount the possibility that there is extended emission to the west, close to the noise level of our observations. Whilst there does appear to be emission in all detected species at the position of G305B, it is always weaker than that found coincident with G305A.
Figure 3 shows integrated spectra of each line, covering a square box of 30″ on a side (approximately one beam), centred on G305A, which is the peak of the emission in most cases. 13CO, HCO+ and N2H+ are all well detected at this position, whereas the spectra for both CH3OH and the CH3CN transition do not clearly show a detection. This is partly due to the poor baselines of the spectra, which are a result of the mediocre weather. However, we can be sure that we have detected the CH3OH (–)A+ and CH3CN (5–4) lines, as they clearly show up as 7 and 5 detections in Figure 2, respectively. We note that both 13CO and HCO+ show some evidence for redshifted outflow wings.
 |
 |
 |
 |
 |
 |

3.1 Column densities, abundances, LTE and virial masses
For the three strongly detected species (13CO, HCO+ and N2H+), we can derive physical parameters for the gas, on the assumption of optically thin emission. Since N2H+ has hyperfine structure, we are able to determine an optical depth at the positions of G305A, G305N and G305SW. We have used the hfs hyperfine line fitting routine in class (Forveille et al., 1989) to determine the optical depth of the N2H+ spectrum at the position of G305A. We find the optical depth is in the strongest hyperfine component (F = 23 - 12). This is comparable to N2H+ optical depths found for a selection of massive molecular cloud cores (Pirogov et al., 2003), where the average optical depth is 0.5. We caution that the N2H+ spectrum is heavily blended and may well show non-gaussian components. This may affect the optical depth determination, and so we consider the formal error on the optical depth given above to be optimistically small. However, we believe the error will not be so large that the N2H+ emission is optically thick. At the positions of G305N and G305SW, we find similar optical depths (0.1) of the strongest component. Therefore, we assume that the N2H+ emission is optically thin throughout the field of view.
| (1) |
where
| (2) |
where is the permittivity of free space, is the dipole moment (0.11 Debye for 13CO, 3.3 Debye for HCO+ and 3.4 Debye for N2H+, with 1 Debye = C m) and is the line integrated intensity. We assume the temperature of the gas (T) to be 20 K. The derived column densities are shown in Table 2.
| Core | Dust Derived | Integrated | Line | Radius | Column | Relative | MLTE | MVIR |
|---|---|---|---|---|---|---|---|---|
| Name | Mass | Intensity | FWHM | (pc) | Density | Abundance | (M⊙) | (M⊙)22footnotemark: 2 |
| (M⊙)11footnotemark: 1 | (K km s-1) | (km s-1) | () | |||||
| 13CO (1–0) | ||||||||
| G305A | 2700 | 110 | 6.8 | 0.7 | 33footnotemark: 3 | 1600 | 6800 | |
| G305N | 370 | 99 | 5.9 | 0.7 | 1400 | 5100 | ||
| G305SW | 3044footnotemark: 4 | 45 | 4.5 | 0.6 | 650 | 2400 | ||
| HCO+ (1–0) | ||||||||
| G305A | 2700 | 63 | 7.3 | 0.6 | 55footnotemark: 5 | 990 | 9100 | |
| G305N | 370 | 28 | 5.1 | 0.6 | 440 | 3100 | ||
| G305SW | 30 | 12 | 3.3 | 0.6 | 180 | 1200 | ||
| N2H+ (1–0) | ||||||||
| G305A | 2700 | 44 | 6.9 | 0.6 | 66footnotemark: 6 | 3600 | 8200 | |
| G305N | 370 | 19 | 5.2 | 0.6 | 1500 | 3200 | ||
| G305SW | 30 | 13 | 1.5 | 0.6 | 1100 | 540 | ||
a Hill et al. (2005) b Virial masses are calculated assuming a uniform density sphere. Virial mass upper limits are quoted in some cases because the emission is spatially unresolved. c Dickman (1978) d Non-detection of dust continuum emission. The 1 upper limit is given. e Bergin et al. (1997) f Pirogov et al. (2003)
Table 2 also quotes core masses derived from dust continuum measurements (Hill et al., 2005) for both G305A and G305N. Hill et al. (2005) did not detect any dust continuum emission associated with G305SW, and so we quote an upper limit based on the rms noise level.
Assuming LTE, we estimate the total gas mass, based on the column density of each line. In order to do so, we need to know the abundance of each species relative to hydrogen. We have chosen representative examples of relative abundances for 13CO, HCO+ and N2H+ from the literature, as given in Table 2. We caution that the LTE derived mass is heavily dependant on the relative abundance of each species, and discuss this further in §4.
We can also derive virial masses according to equation 3 (Pirogov et al., 2003):
| (3) |
where r is the radius of the core and is the line FWHM. We assume the virial mass is determined for a sphere of uniform density. For a sphere with a density profile that falls off as the square of the radius, then the virial mass is reduced by a factor of 1.68. Values for the virial mass are also shown in Table 2.
4 Discussion
4.1 G305A
Hill et al. (2005) calculate a core mass of for the 1.2 mm continuum peak centred on G305A, assuming a distance of 3.9 kpc. Compared to other cores in their survey, Hill et al. (2005) find that this mass is typical for cores that form massive stars. Therefore, even though no observed source has been detected, we believe that G305A harbours enough mass to form a massive star. Furthermore, the Class II methanol maser site associated with G305A strongly suggests there is MSF taking place here because no other Class II methanol maser site has been conclusively found associated with anything other than MSF, despite previous searches (Phillips et al., 1998b; Minier et al., 2003).
Together with the presence of methanol masers and 1.2 mm continuum emission, shown in Figure 1, the new Mopra observations of G305A conclusively show that the core is associated with bright mm-line emission. Since there is no known infrared or radio continuum tracer, G305A is likely to be an extremely young site of MSF. It compares well to the Class 0 phase of low mass star formation, as it shows strong mm continuum emission, but no detectable IR emission. The Class 0 phase of low mass star formation is characterised by these observational constraints, but is also considered to be a phase of active accretion (André, Ward-Thompson & Barsony, 1993). We caution that we currently have no evidence for ongoing accretion in this high mass case, apart from the indirect evidence of the red outflow wings, as seen in Figure 3. The spatial resolution of the Mopra data is insufficient to establish whether or not G305A is the powering source of the outflow. We cannot assume accretion is taking place because accretion processes are expected to proceed on much shorter timescales than for low mass star formation. Therefore, it is conceivable that accretion has ceased in G305A but it still remains extremely deeply embedded and is thus not seen in the IR. On the other hand, G305A may be in the short-lived accretion phase. In any case, G305A is an excellent test case for accretion processes in MSF.
Because G305A does not show any signs of near-infrared (Walsh et al., 1999) or mid-infrared (Walsh et al., 2001) emission up to 20 m, the presence of strong Class II methanol maser emission is somewhat of a mystery. Class II methanol masers are thought to be pumped by infrared photons from warm (T 150 K) dust (Cragg, Sobolev & Godfrey, 2002). Current observations extend only to 20 m, and so the pumping photons may well be found only at longer wavelengths. However, the peak of a 150 K black body should be about 20m, suggesting that there should be a bright mid-infrared source where there is bright methanol maser emission. In any case, G305A should be a useful testbed of methanol maser pumping regimes.
Table 2 shows that the LTE and virial derived masses from 13CO, HCO+ and N2H+ are all consistent within a factor of a few. LTE masses derived using 13CO and HCO+ appear lower than the mass derived from the dust measurements, however it is difficult to pinpoint the cause of this, since there are many possible reasons, for instance the lines may be tracing slightly cooler gas and so the assumption of 20 K gas temperature may be incorrect. We note that if the gas temperature were only 10 K, then the LTE masses would increase to 4000M⊙ for 13CO and 2500M⊙ for HCO+. Another possibility is that there is some depletion of these species onto dust grains, causing an apparent drop in the LTE mass. It is also possible that the emission is optically thick, which would also have the effect of reducing the apparent LTE mass. At this stage, it is impossible for us to disentangle these contributing factors.
4.2 G305B
G305B is coincident with a deeply embedded infrared source with a steeply rising SED. At 10 m, this is the brightest source within the field of view. Based on the infrared data, Walsh et al. (2001) expected that such a bright IR source should produce a detectable radio continuum source. However, none was detected. In fact, Walsh et al. (2001) show G305B to have one of the largest discrepancies between the bright infrared emission and the undetected radio continuum emission in their sample of 31 sources. This suggests that G305B is also at a very early stage of evolution. Presumably, a massive star has already formed at the centre due to the presence of the near-infrared source, yet no detectable radio continuum source has developed. It is unclear exactly why this might happen, although theories such as accretion through an UC HII region (Keto, 2003) could explain this.
4.3 G305SW
N2H+ emission is seen to extend to the south-west of the two maser sites, ending in the peak G305SW. G305SW appears only in the N2H+ integrated intensity map. This is an unexpected result because the critical density for N2H+ (; Ungerechts et al. 1997) is two orders of magnitude higher than that of 13CO (; Ungerechts et al. 1997). Therefore, we would expect any high density core such as G305SW to also exhibit emission in low density tracers. Figure 4 shows spectra at the position of G305SW, integrated over a square box 30″ on a side. The figure shows that whilst there is some 13CO and HCO+ emission at this position, it is much weaker in comparison to G305A. Furthermore, the 13CO and HCO+ emission does not match in radial velocity to the N2H+, with a difference of 1.5 km s-1: the radial velocity of 13CO and HCO+ more closely matches that of the emission associated with G305A. With such a large velocity difference, it is unlikely that this is the result of self-absorbed gas moving along the line of sight (in this case the motions would be outward, rather than the usual infall motions). We conclude that most of the low density gas, traced by 13CO and HCO+, is not associated with G305SW and is probably associated with G305A.
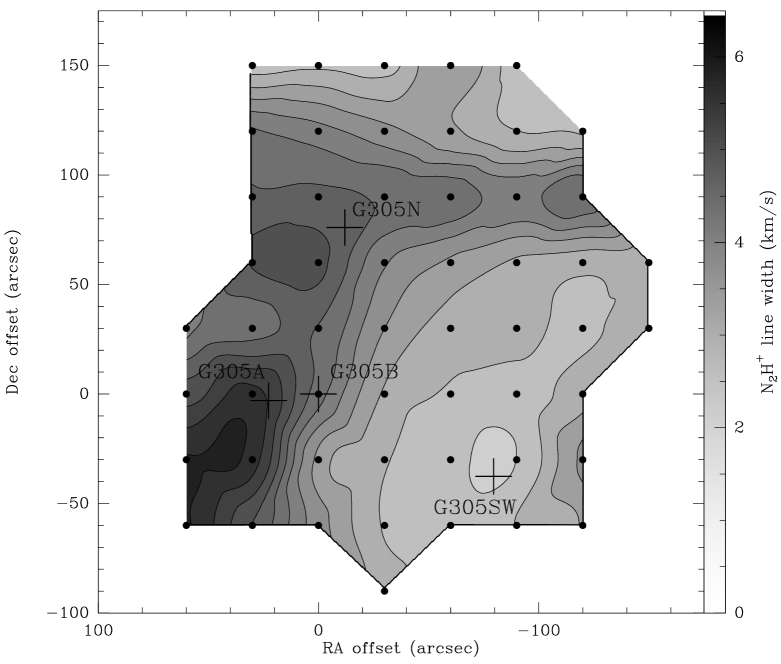
G305SW is also unusual in that the N2H+ line width is only 1.6 km s-1. This is very narrow compared to the line width of the N2H+ spectrum in Figure 3 for G305A of 6.4 km s-1. Figure 5 shows the distribution of N2H+ line widths across the field of view, using those spectra with strong enough emission to fit the hyperfine structure. The minimum line width is clearly seen at a position coincident with G305SW.
Figure 1 shows that no 1.2 mm continuum emission was detected at the position of G305SW. Assuming a black body temperature of 20 K, a gas to dust ratio of 100:1 and a mass absorption coefficient of 0.1 m2 kg-1, any source located at G305SW must be less than 30 . This is an unusually low mass compared to G305A. Even if our assumption of the dust temperature is incorrect, a dust temperature of 10 K yields a mass upper limit of only 75 . This can be compared to the LTE-derived mass (Table 2) of 1100 M⊙. Thus, there appears to be a discrepancy between the dust upper limit and the N2H+ source by at least an order of magnitude.
The virial mass is then . Equation 3 assumes a uniform density profile. However, if we assume a density profile that falls off as then the virial mass will be . In either case, the virial mass upper limit is about an order of magnitude higher than the mass upper limit calculated from the 1.2 mm continuum observations. Our virial mass estimation is only an upper limit because the N2H+ emission is unresolved with the Mopra observations. It is certainly conceivable that G305SW is much smaller than this, bringing the virial and dust masses more in line, however the N2H+ LTE mass is still much larger than expected.
What is the nature of G305SW? One possible explanation for the lack of other tracers than N2H+ is that the region may be very cold and dense, where all other species have frozen out of the gas phase onto grains, leaving N2H+ – one of the last species to freeze out (Tafalla et al., 2002) – in the gas phase. The fact that the 1.2 mm continuum observations indicate there is less than 100 in G305SW and yet the N2H+ emission is consistent with an LTE mass about an order of magnitude larger, confirms that chemistry must play a significant role. G305SW may well be a cold, quiescent core perhaps about to undergo star formation. The narrow N2H+ linewidth of G305SW also supports this scenario. The fact that the virial mass may be much larger than the mass derived from the dust continuum measurements suggests that G305SW may well be an unbound, transient phenomenon, and we cannot rule this out.
To fully assess the nature of G305SW, it is clear that higher spatial resolution observations are needed. It is conceivable that the N2H+ emission breaks up into a number of small cores at higher resolution, in which case the individual cores may well be bound.

4.4 G305N
G305N appears as a peak of 1.2 mm continuum emission, as well as in the 13CO, HCO+, N2H+ and CH3OH () A+ integrated intensity maps, but does not show any infrared, radio continuum nor methanol maser emission. Hill et al. (2005) calculate a core mass of . Hill et al. (2005) detect eight 1.2 mm continuum sources in their field of view around G305.2+0.2, with masses ranging from 39 to , of which G305N is a typical source. They commonly find other 1.2 mm continuum sources with comparable masses to G305N, so it is possible that this source will form massive stars. Since G305N does not show any signs of MSF – no masers, radio continuum or bright infrared sources – it may also be a good candidate for examining the early stages of MSF.
5 Conclusions
We have used the Mopra radiotelescope to image mm line transitions of 13CO, HCO+, N2H+, CH3CN and CH3OH in the massive star forming region G3052.+0.2. We show that the main centre of line emission is G305A, a methanol maser site that has no detected infrared or radio continuum emission and is likely to be a massive star in an early stage of formation, similar to the Class 0 stage of low mass star formation. G305B is a second methanol maser site, coincident with a bright, red infrared source whose bolometric luminosity suggests it should produce a detectable HII region, yet none has been detected. This suggests that G305B may also be at a very early stage of evolution, but probably older than G305A.
G305SW is a newly detected source which only shows up clearly in N2H+ emission. Its lack of other tracers and narrow linewidth suggest that it may be a cold, quiescent prestellar core, although it may also be an unbound, transient phenomenon.
Other prestellar cores may exist (eg. G305N), and on the other hand more evolved massive star forming sites occur (eg. the compact HII region to the west of G305B). Thus, this region shows a range of massive star formation sites at different evolutionary stages within the GMC complex.
References
- André, Ward-Thompson & Barsony (1993) André, P., Ward-Thompson, D. & Barsony, M. 1993, ApJ, 406, 122
- Bergin et al. (1997) Bergin, E. A., Ungerechts, H., Goldsmith, P. F., Snell, R. L., Irvine, W. M. & Schloerb, F. P. 1997, ApJ, 482, 267
- Cragg, Sobolev & Godfrey (2002) Cragg, D. M., Sobolev, A. M. & Godfrey, P. D. 2002, MNRAS, 331, 521
- De Buizer (2003) De Buizer, J. M. 2003, MNRAS, 341, 277
- Dickman (1978) Dickman, R. L. 1978, ApJS, 37, 407
- Forveille et al. (1989) Forveille, T., Guilloteau, S., & Lucas, R. 1989, CLASS Manual (Grenoble: IRAM)
- Hill et al. (2005) Hill, T., Burton, M. G., Minier, V., Thompson, M. A., Walsh, A. J., Hunt-Cunningham, M. & Garay, G. 2005, MNRAS, in press
- Keto (2003) Keto, E. 2003, ApJ, 599, 1196
- Minier et al. (2003) Minier, V., Ellingsen, S. P., Norris, R. P. & Booth, R. S. 2003, A&A, 403, 1095
- Norris et al. (1993) Norris, R. P., Whiteoak, J. B., Caswell, J. L., Wieringa, M. H. & Gough, R. G., 1993, ApJ, 412, 222
- Phillips et al. (1998a) Phillips, C. J., Norris, R. P., Ellingsen, S. P. & McCulloch, P. M. 1998a, MNRAS, 300, 1131
- Phillips et al. (1998b) Phillips, C. J., Ellingsen, S. P., Rayner, D. P. & Norris, R. P. 1998b, MNRAS, 294, 265
- Pirogov et al. (2003) Pirogov, L., Zinchenko, I., Caselli, P., Johansson, L. E. B. & Myers, P. C. 2003, A&A, 405, 639
- Tafalla et al. (2002) Tafalla, M., Myers, P. C., Caselli, P., Walmsley, C. M. & Comito, C. 2002, ApJ, 569, 815
- Ungerechts et al. (1997) Ungerechts, H., Bergin, E. A., G oldsmith, P. F., Irvine, W. M., Schloerb, F. P., & Snell, R. L. 1997, ApJ, 482, 245
- Walsh et al. (1998) Walsh, A. J., Burton, M. G., Hyland, A. R., Robinson, G., 1998, MNRAS, 301, 640
- Walsh et al. (1999) Walsh, A. J., Burton, M. G., Hyland, A. R. & Robinson, G. 1999, MNRAS, 309, 905
- Walsh et al. (2001) Walsh, A. J., Bertoldi, F., Burton, M. G. & Nikola, T. 2001, MNRAS, 326, 36