A deep XMM-Newton observation of the ultraluminous X-ray source Ho II X-1 : the case against a 1000M⊙ black hole.
Abstract
We present results from a 112 ks long look by XMM-Newton at the ultraluminous X-ray source (ULX) Holmberg II X-1, long thought to be the one of best candidates for the missing class of intermediate mass black holes (IMBHs). Our data comprises the first high quality XMM-Newton/RGS spectrum of an ULX, and an XMM-Newton/EPIC spectrum with unprecedented signal-to-noise. A detailed timing analysis shows that any variability on time-scales of minutes to hours is very weak ( few per cent fractional rms), though larger amplitude variations on much shorter time-scales could be hidden by photon counting statistics. This result suggests that if Ho II X-1 harbours an IMBH, then we are observing this source in a highly unusual and atypical state when compared with the known variability behaviour of other accreting systems of large mass. Moreover unlike Galactic X-ray binaries, our spectral analysis indicates the possible presence of an optically-thick low temperature corona. Taken together our timing and spectral analysis suggests that the compact companion is most-likely a high luminosity analogue of black hole binary systems similar to GRS 1915+105, the Galactic microquasar, harbouring a compact object of mass no greater than M⊙.
keywords:
black hole physics – X-rays: binaries – X-rays: galaxies.1 Introduction
Einstein and Rosat observations of nearby galaxies revealed a new population of point-like extra-nuclear X-ray sources with luminosities far in excess of the Eddington limit for spherical accretion onto a 10 M⊙ black hole ( erg s-1, e.g. Fabbiano & Trinchieri 1987; Roberts & Warwick 2000), the so-called ultraluminous X-ray sources (ULXs). In fact, the erg s-1 X-ray luminosities of ULXs, if due to sub-Eddington rate spherical accretion onto a compact object, imply masses of – M⊙. ULXs may therefore represent the so-called “missing class” of intermediate-mass black holes (hereafter IMBHs), the purported primordial building blocks of super-massive black holes and galaxies (e.g. Ebisuzaki et al. 2001; Madau & Rees 2001). The best current evidence in favour of IMBHs underlying ULXs derives from recent XMM-Newton spectroscopy of several ULXs, where a “soft excess” in the spectra may be fit by a relatively low temperature ( eV) accretion disc model (e.g. Miller et al. 2003; Miller, Fabian & Miller 2004). This is considerably cooler than found in stellar-mass black hole X-ray binaries (XRBs), and points to a larger, cooler disc surrounding a more massive (M⊙) black hole. However, X-ray spectral results based on continuum modelling may be open to some ambiguity, so these detections are not necessarily conclusive in all cases (Roberts et al. 2005). Other possibilities involving stellar-mass black holes have been mooted to explain the extreme X-ray luminosities of ULXs, notably anisotropic radiation and/or relativistic beaming (King et al. 2001; Körding et al. 2002) or truly super-Eddington accretion discs (Begelman 2002; Ebisawa et al. 2003).
A more direct determination of the mass of the compact accretor in ULXs is the key to further progress in this field. Perhaps the best method for determining the mass of the compact object in ULXs from X-ray data is through a comparison of their Power Spectral Density (PSD) with those of XRBs and Active Galactic Nuclei (AGN). The PSD of all known accreting systems are remarkably similar (Edelson & Nandra 1999, Uttley et al. 2002). In AGN, PSD shapes corresponding to both low ‘hard’ accretion state systems (NGC 3783, Markowitz et al. 2003) and high ‘soft’ accretion state systems (NGC 4051, McHardy et al. 2004) previously seen in XRBs are now seen. Significantly, the location of the characteristic PSD break-frequency scales inversely with the mass of the black-hole (Uttley et al. 2002, Markowitz et al. 2003, Vaughan et al. 2005) for objects with masses ranging from 10 M⊙for a typical stellar mass black hole (eg. Cyg X-1, 1 Hz) to – M⊙ for the central supermassive black hole in nearby Seyfert 1 galaxies. For the latter, black hole masses have been independently verified using both the stellar velocity dispersion and reverberation mapping techniques (Gebhardt et al. 2000, Ferrarese et al. 2001). This method has been applied to ULX data on at least two previous occasions (Cropper et al. 2004, Soria et al. 2004); though putative breaks were detected, the data were insufficient to place strong constraints on the black hole mass in either case.
In order to progress, one requires the best possible X-ray data from an ULX. Here we present an X-ray spectral and timing analysis for an unprecedented long look with XMM-Newton at the ULX Holmberg II X-1 (hereafter Ho II X-1). This is one of the most luminous () nearby ULXs, located in the Mpc dwarf star-forming galaxy Holmberg II. Of the 87 candidate ULXs catalogued by Colbert & Ptak (2002), Ho II X-1 had the highest observed ROSAT count rate making it an ideal target for PSD analysis. It is a very well-studied object; ROSAT and ASCA observations (Zezas, Georgantopoulos & Ward 1999; Miyaji, Lehmann & Hasinger 2001) revealed a relatively soft X-ray spectrum, and variability consistent with an accreting black hole. The detection of a soft excess in the X-ray spectrum, that can be modelled as the accretion disc around a M⊙IMBH, was confirmed in three short ( ks) XMM-Newton observations (Dewangen et al. 2004). This ULX is also embedded in a spectacular nebula, visible in both optical emission lines (Pakull & Mirioni 2003, Kaaret, Ward & Zezas 2004, Lehmann et al. 2005) and radio continuum (Miller, Mushotzky & Neff 2005). Crucially, the flux in the high-excitation HeII line around the position of the ULX implies a lower bound on its isotropic X-ray luminosity of erg s-1 (Kaaret, Ward & Zezas 2004). Hence Ho II X-1 is one of the strongest candidate IMBHs in the local universe.
2 A long look at Ho II X-1 with XMM-Newton
Ho II X-1 was scheduled for a 112-ks XMM-Newton observation on 2004 April 15 (observation ID 0200470101), though the onset of intense background flaring in the later stages of the observation caused it to be truncated to no more than ks exposure per instrument. The pn was operated in full-field mode, whilst both MOS detectors utilised the large window mode, and the medium filter was used for all EPIC detectors. Both the RGS and OM were in standard modes, in the latter case monitoring Ho II with a series of UVW1 observations (though we defer discussion of this data to a later work).
Data for the analysis were extracted from the pipeline product event lists using the appropriate XMM-Newton sas version 6.0.0 tools. The pn data were filtered to leave only events with flag=0 and pattern 4; MOS data were filtered for pattern 12 and the #XMMEA_EM flag. We quantified the background flare contamination by examining a 10 – 15 keV full-field light-curve from the pn detector. This showed the first ks of the observation to be relatively clean, with only a few minor flares. However, subsequent to that strong background flaring dominated the light-curve. In fact, a good time intervals (GTI) file selected from this light-curve for quiescent background times (count rate count s-1) leaves only 38.1 ks clean data for the whole observation.
2.1 Spectral analysis
The GTI file was used to produce the cleanest possible imaging and spectral products for the dataset. Ho II X-1 is clearly detected in the data, with a combined EPIC (0.3 – 10 keV) count rate of . EPIC spectra and response matrices were generated using the especget tool. MOS and pn source spectra were all extracted from an 11-pixel ( arcsec) radius circular aperture over the position of Ho II X-1111We limit ourselves to this relatively small aperture to avoid extracting data over pn chip gaps, though we note that of the source flux lies within this radius.. A background spectrum for the pn was extracted from a slightly larger circular aperture on an adjacent chip, at a similar distance from the chip readout nodes as Ho II X-1. MOS background data were taken from two small circular apertures at the bottom-right and -left of each large window. RGS source spectra, background spectra, and response matrices were generated using the standard sas pipeline script, rgsproc. All spectral data were grouped to a minimum of 20 counts per bin, in order to provide adequate statistics for spectral fitting using minimization within xspec version 11.3.1.
2.1.1 RGS observations
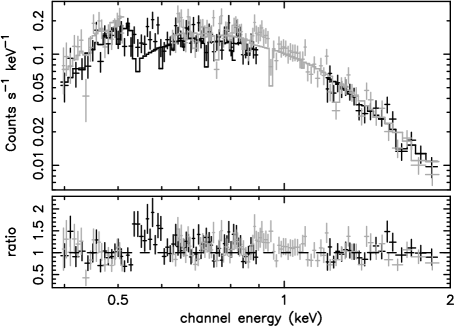
The data extraction produced a total of 7088 source counts for both RGS modules combined, integrated over the whole (flare-filtered) exposure. The resulting spectrum and residuals, compared to the best-fit absorbed power-law model, are shown in Figure 1. We note that this is the first reasonable quality, high resolution X-ray spectrum of an ULX. A fit statistic of for 367 degrees of freedom (dof) is obtained for the absorbed power-law model, where the absorption is modelled by a solar-abundance WABS model (based on the absorption cross-sections of Morrison & McCammon 1983), with a rejection probability () of 99%. The photon index over the 0.3 – 2.0 keV band was , with an absorption column of cm-2, significantly above the known Galactic column density towards Holmberg II of cm-2 (Dickey & Lockman 1990). The measured flux over the 0.3 – 2.0 keV RGS band is ergs cm-2 s-1 corresponding to an unabsorbed luminosity of ergs s-1 at 3.2 Mpc.
The residuals to the absorbed power-law fit show a clear excess of counts between 0.5 – 0.6 keV, blue-wards of the neutral O edge. This excess can be fitted with a single, broadened emission line centered at eV, with an equivalent width of eV and a velocity width of eV (8900 km s-1). The fit statistic then improves to . The line energy is consistent with emission from a blend of lines from the He-like O VII triplet (at 561 eV – 574 eV). We therefore refitted this excess with three narrow, unresolved lines corresponding to the forbidden, intercombination and resonance lines from the O VII triplet. Two lines are detected, the forbidden line measured at eV and the resonance line at eV, both with equivalent widths of eV, for 363 dof. The flux in either line is photons cm-2 s-1 corresponding to a line luminosity of erg s-1.
One plausible explanation for the origin of the line emission is from an optically-thin thermal plasma, as has previously been suggested for this source (Dewangan et al. 2004). If we fit the mekal model in xspec to the spectrum, in addition to the underlying absorbed power-law continuum, then we can place a limit on the contribution of such a plasma to the soft X-ray emission in HoII X-1. For solar abundances, it is found that the 90% confidence limit on the plasma luminosity is erg s-1, consistent with the value found by Dewangan et al. (2004), whilst the plasma temperature is constrained at eV. Thus an optically thin plasma is not likely to contribute more than 3% of the total soft X-ray flux in Ho II X-1.
Alternatively, the excess of counts above 0.5 keV may arise from incorrectly modeling the neutral O edge in the absorber model. To test this assumption, we refitted the absorbed power-law model using the TBVARABS absorption model, based on the improved abundances and cross-sections tabulated by Wilms, Allen & McCray (2000). We find that the O abundance is now with respect to solar, while the column density (in excess of the Galactic value of cm-2) is now cm-2. The fit statistic is improved significantly, with , i.e. a rejection probability of %, so formally acceptable. The decrease in for this fit is due to both the lower O abundance value relative to solar and the lower absolute abundance of O tabulated by Wilms, Allen & McCray (2000). The underlying photon index is then slightly flatter (), whilst the absorption corrected luminosity in the 0.3 – 2.0 keV band is erg s-1. In this scenario no O VII emission is formally required, as the depth of the O I edge is reduced, resulting in little excess emission between 0.5 – 0.6 keV. That Ho II X-1 lies in a low-metallicity environment should perhaps come as no surprise; the O/H ratio for the Holmberg II galaxy is of the solar abundance (Hidalgo-Gámez, Sánchez-Sacedo & Olofsson 2003)222The somewhat higher metallicity suggested by our RGS data in the local environment of Ho II X-1 may be a consequence of the local star formation and/or the progenitor star for the compact object in the ULX.. Indeed, Soria et al. (2005, and references therein) suggest that low metallicity environments could favour the formation of larger black holes ( M⊙), and hence preferentially host ULXs. Sub-solar abundance absorption along our line-of-sight to Ho II X-1 therefore seems the most likely explanation for the apparent 0.5 – 0.6 keV excess in the RGS spectrum.
2.1.2 EPIC observations
EPIC spectral data were fit over the 0.3 – 10 keV band, though within this we only fit the MOS over 0.3 – 6 keV (above this the data were noise-dominated), and the pn over 0.7 – 10 keV (known calibration inaccuracies between 0.5 – 0.7 keV are particularly prominent in this spectrally-soft dataset). We allowed for residual calibration uncertainties between the three detectors in our fits by introducing a constant term into our spectral fitting; in practice the variation between the detectors was . Each model we fit to the data was subject to a fixed Galactic absorption column of cm-2, modelled using a solar-abundance xspec WABS cold absorption model.
We began, as with the RGS analysis, by fitting an absorbed power-law continuum model, using a second WABS component to fit additional line-of-sight absorption to Ho II X-1 (which is presumably intrinsic to either the ULX itself, or its host regions in Holmberg II). This fit was rejected at high significance (see Table 1), though its best fit parameterisation was similar to that of the narrower-band RGS result (, cm-2). However, we also attempted a second fit, this time using the TBVARABS model, with the actual abundance of the absorbing medium set to 0.56 times solar as suggested by the RGS O I edge feature. This produced a vastly improved fit ( for the same dof). This improvement was predominantly down to the use of the TBVARABS model itself, which includes (amongst other improvements) a much lower absolute O abundance than WABS. We tabulate the results of these two fits, plus a TBVARABS fit set to solar abundance, in Table 1. However, even though the fit is greatly improved by the use of TBVARABS, a simple power-law continuum fit is still significantly rejected.
We next attempted two-component models consisting of a power-law continuum plus an accretion disc model, similar to previous work on ULXs, and the empirical model for X-ray emission from a black hole X-ray binary. As with previous work, we utilised the xspec DISKBB model, based on the multi-colour disc blackbody approximation (e.g. Mitsuda et al. 1984). This model provides an improvement to the fit; however, as Table 1 shows the magnitude of this improvement is highly dependent upon the choice of absorption model, with the solar abundance WABS fits showing the largest improvement ( for 2 extra dof), and the best actual fit, whilst the most physical absorption model (sub-solar TBVARABS) shows the smallest improvement ( for 2 extra dof) and worst fit. In all cases the DISKBB temperature was relatively cool ( keV), albeit hotter than found in the previous observations of Ho II X-1 by Dewangen et al. (2004), and the power-law continuum remains steep ()333We note that we also attempted the “non-standard” form of the DISKBB + power-law model, as described by Stobbart et al. (2004) and Roberts et al. (2005). This model was only marginally less successful than the standard usage, by for TBVARABS models, with best fits showing keV for the accretion disc, and for the power-law continuum..
The DISKBB + power-law model is only a first-order approximation of the physics of an accretion disc plus corona system. Hence we next tried a more physically-realistic, self-consistent model, namely the DISKPN + COMPTT combination (see Gierliński, Machiolek-Niedźwicki & Ebisawa 2001; Titarchuk 1994 for descriptions of these models) that describes an accretion disc modified for e.g. relativistic effects, and a Comptonised corona. We link the two models by setting the seed photon temperature of the corona, , to the maximum temperature of the disc , and we set the inner radius of the disc to the innermost stable circular orbit (). This model provides a statistically-acceptable solution to the spectrum, regardless of the absorption model used (as the modelled absorption is relatively low, there is little difference between the models in this case). Whilst the disc again appears cool ( keV), the best-fit model shows a remarkable corona, in that it appears both quite cool ( keV) and optically thick (). We show the best fit spectrum, with the contributions from the two components decomposed, in Fig. 2, and tabulate the interesting parameters in Table 1. These models provide an observed 0.3 – 10 keV flux measurement of erg cm-2 s-1, which converts to an intrinsic luminosity of erg s-1 for a distance of 3.2 Mpc (this intrinsic luminosity is similar to the RGS estimate - taken from a much narrower band - as the absorption correction is considerably smaller in our more complex EPIC modelling).
We have also investigated whether an optically-thin corona also provides a reasonable solution to the spectral data, as one might expect given the DISKBB + power-law fits to the data. This was done by attempting two new fits with the coronal temperature set to 50 and 100 keV respectively, indicative of the range seen in Galactic black hole binaries, in the DISKPN + COMPTT models. These fits did indeed provide reasonable solutions to the data, with a best-fitting (the other parameters did not change substantially from the values in Table 3 for the optically-thick solution) and . However, they were still worse than the optically-thick solutions by for one extra dof, which equates to a significance of according to the F-statistic. Therefore we regard the presence of an optically-thick corona as far more likely than an optically-thin one, though we obviously cannot exclude the latter.
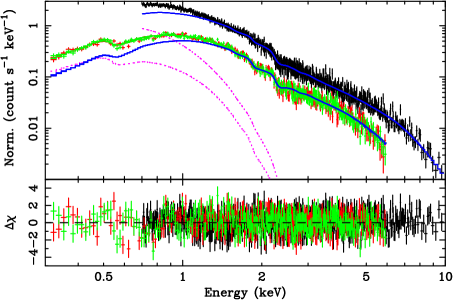
Finally, as Fig. 2 demonstrates, the data show no obvious signs of emission lines including Fe K. We place a limit on the possible contribution of a narrow, neutral (i.e. 6.4 keV) Fe K line by adding a Gaussian line model to the best-fit spectra; from this we derive a 90% upper-limit of eV on the equivalent width of such a feature.
2.2 Temporal analysis
Temporal data for Ho II X-1 were extracted from the EPIC detectors in the same circular apertures as used in the spectral analysis. Background data were extracted from same-sized apertures on the same CCD chip as the source. Given the relative spectral softness of the ULX, and the comparatively hard X-ray nature of background flaring detected by XMM-Newton, we maximised our temporal signal-to-noise by selecting only data in the 0.3 – 6 keV range. The use of relatively small apertures, in combination with excluding hard X-ray data, ensured that the source signal per unit area dominated above even the strongest background flaring. We demonstrate this for the pn data in Fig. 3, which shows the full light-curve for this observation of Ho II X-1 binned to 100 s resolution.

Although Ho II X-1 shows substantial variability on time-scales of months-years (e.g. Dewangan et al. 2004), the XMM-Newton light curve shows very little variability on time-scales of less than a day (barring a very weak monotonic trend throughout the observation). To quantify and constrain the variability more precisely, we extracted a 0.3–6.0 keV EPIC-pn light curve at the highest possible resolution (73.4 ms for full-frame mode), corresponding to the first 48.2 ks of data, which is free of telemetry dropouts and significant background flaring. We split the light curve into five equal segments and measured the PSD of each segment (with power determined in units of ), then merged and averaged the resulting PSDs by binning in frequency, so that each bin corresponds to a factor of 1.1 increase in frequency (with the proviso that each bin contains at least 20 individual PSD measurements). The errors on the averaged powers were calculated from the rms scatter on individual PSD measurements in each frequency bin. The resulting PSD was found to be completely flat, consistent with variations being due to photon counting statistics only. To constrain the strength of any intrinsic source variability, we used xspec to fit the PSD. We obtain an excellent fit ( for 88 degrees of freedom) for a constant power of Hz-1 (errors are 90% confidence). The expected power level due to Poisson noise for the observed count rate is 0.81 Hz-1. The fact that the observed constant power is smaller than expected may be related to weak instrumental effects (eg. pileup, deadtime).
The fit residuals relative to the best-fitting constant are plotted in Figure 4. No systematic features are apparent. At first glance, the data might suggest that the fastest intrinsic variability of the source occurs on time-scales longer than observed (day), thus supporting the idea that the source is an intermediate mass black hole. However, AGN with black hole masses M⊙ show significant variability on time-scales of minutes-hours (e.g. McHardy et al. 2004), and we would therefore expect the same if the source is an intermediate mass black hole, unless it occupies a state with unusually low variability power. To demonstrate this fact more quantitatively, we attempted to fit the PSD with a constant plus a broken power-law of low-frequency slope , and slope above the break, similar to the PSD shape observed in several AGN and Cyg X-1 in the high/soft state (e.g. McHardy et al. 2004, 2005; Uttley & McHardy 2005). In units of powerfrequency (), a PSD slope of corresponds to a constant value (which when multiplied by natural log of 10 gives the power per decade in frequency). In the AGN observed to date, and in Cyg X-1 and other black hole XRBs, this constant value is .
For a break frequency of Hz, which is even lower than those observed in several AGN (and corresponds to a black hole mass of M⊙, assuming linear scaling of characteristic time-scales from the Hz break seen in Cyg X-1), the 99 per cent upper limit to is . For a PSD break at 1 Hz or higher, which would correspond to black hole masses of 100 M⊙ or less, the limit is , which corresponds to an intrinsic fractional rms over the entire observed PSD of less than 1 per cent. In some black hole XRBs in the high/soft state, the amplitude of variability is diluted significantly by the presence of strong constant blackbody emission from the disc which dominates the X-ray spectrum and dilutes the variability in the power-law component. However, our spectral fits show that the X-ray emission we observe is not dominated by the putative disc component (that accounts for only of the observed counts in the 0.3 – 6 keV pn data), hence we conclude that the source cannot be accreting in a state with timing properties similar to the high/soft state of Cyg X-1 or AGN with good PSD measurements.
We next consider the possibility that the PSD is ‘band-limited’ (e.g. see van der Klis 2005), that is, the source does vary significantly but that variability is confined to a limited frequency range (perhaps a decade or two, or even smaller if the variability is dominated by strong QPOs). Such band-limited PSDs are observed in black hole XRBs in the low/hard state (where relatively hard () power-law emission dominates the X-ray spectrum) and also the very-high state, where the spectrum shows strong, steep power-law emission, similar to that observed here (see McClintock & Remillard 2003 for more detailed descriptions of these states). The high-frequency cut-offs in these PSDs typically occur around 1–10 Hz, and simple mass-scaling arguments then imply that the peaks in band-limited power should be sampled by our observed frequency range, for intermediate mass or stellar mass black holes. In that case, we may not detect these peaks due to lack of sensitivity, which decreases at high-frequencies due to the Poisson noise contribution to the PSD444Note that for a band-limited component with constant rms and constant width in decades, the peak power also remains constant in units, but the noise level increases linearly with frequency, hence the reduction in sensitivity at high frequencies..


To determine upper limits on the amplitude of band-limited noise which may be hidden in the PSD, we fitted the PSD with a constant plus Lorentzian model. The Lorentzian represents the band-limited contribution: it’s coherence or -value (the centroid frequency divided by the full width at half-maximum) can be changed to represent different observed types of band-limited noise or QPOs. For the incoherent band-limited noise typically observed in black hole XRBs in either state, we assumed (e.g. see Pottschmidt et al. 2003). For the strong, sharp QPOs which are also often observed in very-high states (and which would be easier to detect than band-limited noise of the same fractional rms), we assumed (e.g. see Remillard et al. 2002, van der Klis 2005). For these two types of Lorentzian, we fitted the PSD to obtain the 90 and 99 per cent upper limits on variability amplitude (in terms of the square of fractional rms contributed by the Lorentzian), which is permitted as a function of Lorentzian centroid frequency. The resulting contour plots are shown in Fig. 5(a,b). The limits we can place on the presence of significant variability from band-limited noise are very stringent. For example, the typical observed fractional rms in a single Lorentzian is per cent, i.e. fractional rms-squared , which is ruled out at 99 per cent confidence for frequencies less than Hz and Hz for and respectively.
Assuming linear scaling of time-scales with black hole mass, these limits on the allowed frequencies of the expected band-limited noise suggest that the black hole mass should be of order M⊙ or less, assuming that X-ray timing behaviour is similar for all black holes, regardless of black hole mass. In fact the lack of observed variability is consistent with the PSD being similar to that observed in certain states of the microquasar GRS 1915+105, which, although famous for showing highly variable and complex light curves, also shows states (the class of behaviours, see Belloni et al. 2000) where the long-term X-ray variability (on time-scales up to months) can be remarkably constant, with all the variability power being concentrated at high frequencies ( Hz or higher).
3 Discussion
Our analysis of the RGS data for Ho II X-1 shows that it is likely that the X-ray emission we observe from the ULX is subject to absorption by a sub-solar abundance medium, almost certainly within the Holmberg II galaxy, and possibly in the immediate environment of the ULX itself. Interestingly, this result has implications for parameterisation of the EPIC X-ray spectrum. In particular, the mis-modelling of the neutral O edge as an solar-abundance absorber leads to an over-estimation of the magnitude of the soft excess in the empirical models (power-law continuum and power-law + DISKBB models) of the data. The main implication of this is that it can lead to an over-estimate of the mass of the putative IMBH derived from the DISKBB parameters. Using equations (5) and (8) of Makishima et al. (2000), and the best-fit parameters from the empirical power-law + DISKBB fits, the IMBH mass is estimated as M⊙for the solar-abundance WABS absorption model555 is the inclination of the accretion disc to the line-of-sight, and relates to the spin of the black hole ( in the Schwarzschild metric, and for Kerr black holes).. When the sub-solar TBVARABS model is used instead, the black hole mass reduces to M⊙, down to of the previous estimate. This explicitly demonstrates the sensitivity of the estimated IMBH masses to the assumed absorption model, and may imply that previous masses in the literature derived by this technique are somewhat over-estimated.
Furthermore, we caution that mass estimates derived from modelling the soft-excess are likely very highly uncertain. Gierlinski and Done (2004) in a systematic study of all radio-quiet PG quasars observed with XMM-Newton, found that the temperature of the soft excess was remarkably constant despite the 3 orders of magnitude range in black hole mass (their Figure 1, panel b) and order of magnitude range in . This apparent insensitivity of the soft-excess to either mass or luminosity has been noted before (Walter and Fink 1993; Czerny et al 2003; Porquet et al. 2004), and casts strong doubt on the interpretation of soft excesses as an accretion disc signature in QSOs.
If the same uncertainty is applied to ULXs, we may require a different explanation for the origin of the soft excess. One possibility is an optically thick, low temperature photosphere. This phenomenon should naturally arise in sources accreting at or close to the Eddington limit (King & Pounds 2003) without appealing to large black hole masses. In the King and Pounds model, any black hole accreting at close to Eddington will produce a strong Compton-thick outflow with an effective photospheric size of a few tens of from the central source. Using their equation 18, and scaling down their numbers for the PG quasar 1211+143, then for a 10 black hole accreting at close to Eddington we predict an outflow rate of /yr, which implies an effective blackbody temperature for the photosphere of a few eV, similar to the value we measure for Ho II X-1. However, we note that the largest challenge for this model is to explain how we still observe the hard X-ray component through the Compton-thick outflow (cf. Miller, Fabian & Miller 2004).
If we return to the standard assumption - namely, the soft excess does originate in the thermal emission of an accretion disc - then the mass estimates assume that the disc is in the “high” spectral state (i.e. radiating from the innermost stable circular orbit around the black hole, for a Schwarzschild black hole). We might then expect the rest of the X-ray spectrum and its variability characteristics to conform to this state. Unlike some other ULXs, Ho II X-1 does display the steep power-law continuum (in the empirical power-law + DISKBB fit), , characteristic of the high state (cf. Roberts et al. 2005). However, it does not display the correct variability characteristics. This is a particular problem as if an IMBH is present, even with the reduced mass derived above, the X-ray luminosity implies it is apparently accreting at LEdd. This accretion rate regime is observed in both AGN and XRBs, all of which show a substantial level of variability in the high state. Assuming that accretion physics works similarly for IMBHs, this apparent failure of XRB properties to “scale-up” to an IMBH is a severe problem.
There is a second way in which this ULX appears “abnormal” compared to Galactic XRBs in the high state. Physical modelling of the source spectrum reveals its putative coronal component is probably both optically-thick and cool ( keV), in stark contrast to the optically-thin, hot ( keV) coronae found around Galactic black holes. The coronal X-ray emission also quantitatively dominates the observed X-ray emission, contributing of the 0.3 – 10 keV flux, unlike Galactic black holes in the high state (cf. McClintock & Remillard 2005666A caveat must be that if an IMBH is present, then to provide a fair comparison one would have to use a softer X-ray band than the 2 – 20 keV band these authors use to define their black hole emission states. One might argue that our 0.3 – 10 keV data provides this, and is still very corona-dominated.) In fact, an X-ray spectrum dominated by coronal emission is more indicative of the very high state. Interestingly enough, an optically-thick medium could provide a plausible means to explain the lack of any accretion disc features (in particular an Fe K line) in the X-ray spectrum. However, these arguments again imply that this ULX does not appear to be operating as a scaled-up high state XRB. Hence models assuming a M⊙IMBH in the high state underlies Ho II X-1 face considerable new challenges on the basis of our data.
Is there an alternative explanation for the spectral and temporal characteristics of this source? The Galactic microquasar GRS 1915+105 might hold the key. In particular, Zhang et al. (2000) have demonstrated that its X-ray spectrum can be modelled by a three-layer atmospheric structure, broadly similar to the solar atmosphere. These three layers are: (i) a cold and optically-thick disc ( keV); (ii) a “warm layer” overlaying the cold disc with keV and ; and (iii) a hot, optically-thin corona ( keV, ), though this last component is not always present777Broad-band spectral studies of GRS 1915+105 can require models far more complex than this simple model, see for example Done, Wardzinski & Gierlinski (2004); Zdziarski et al. (2005).. This model has striking similarities to our physical model, in particular a cool disc seeding a warm, optically-thick scattering medium. Our lack of variability could then be explained by the non-detection (within our limited spectral range) of the optically-thin coronal component and/or the source being in the -class of GRS 1915+105 behaviour. Indeed, as the -class of GRS 1915+105 appears typical of the very high state (Zdziarski et al. 2005), as is a corona-dominated X-ray spectrum, then the mass limit derived from band-limited variability considerations may be appropriate. Crucially, when combined with the non-dependence of the black hole mass on the disc temperature in this model, this allows us a far smaller black hole than conventionally assumed for this ULX ( M⊙). This in turn implies that Ho II X-1 must be accreting at (or perhaps above) the Eddington limit. We note that theoretical models for ULXs as stellar-mass black holes accreting from high mass donor stars certainly permit sufficient mass transfer to fuel such high luminosities (Rappaport, Podsiadlowski & Pfahl 2005), and speculate that this excessive mass transfer may also result in enough material transfering to the corona to make it optically-thick.
Therefore we conclude that it remains plausible that Ho II X-1 may possess a black hole no larger than a few tens of solar masses radiating at or above the Eddington limit.
4 Summary
We present an unprecedented deep observation of one of the best IMBH candidate ULXs, Ho II X-1. This data provides a challenge to previous results suggesting the presence of a M⊙ IMBH, most notably in the lack of significant variability over the timescales probed by our data, and the possible detection of an optically-thick corona, both of which are inconsistent with the simple argument for IMBHs based on the “scaling-up” of a Galactic XRB. A plausible alternative is that Ho II X-1 is behaving like GRS 1915+105 in its -class very high state; in this case the lack of observed variability places a limit on the mass of the compact accretor in Ho II X-1 at M⊙.
Acknowledgments
We would like to thank the anonymous referee for a careful reading of the manuscript and for a number of helpful suggestions which led to an improvement in the work presented here.
M.R. Goad and T.P. Roberts acknowledge financial support from PPARC. P. Uttley is supported by an NRC Research Associateship. This work is based on observations with XMM-Newton, an ESA science mission with instruments and contributions directly funded by ESA member states and the USA (NASA).
References
- (1) Begelman M.C., 2002, ApJ, 568, L97
- (2) Belloni T., Klein-Wolt M., Méndez M., van der Klis M., van Paradijs J., 2000, A&A, 355, 271
- CP (2002) Colbert E.J.M., Ptak, A.F., 2002, ApJS, 143, 25
- (4) Cropper M., Soria R., Mushotzky R.F., Wu K., Markwardt C.B., Pakull M., 2004, MNRAS, 349, 39
- (5) Czerny, B., Nikolajuk, M. Rózańska, A. Dumont, A.-M. 2003, A&A, 412, 317.
- DMGL (2004) Dewangan G., Miyaji T., Griffiths R.E., Lehmann I., 2004, ApJ, 608, L57
- DL (1990) Dickey J.M., Lockman F.J., 1990, ARA&A, 28, 215
- (8) Done C., Wardzinski G., Gierlinski M., 2004, MNRAS, 349, 393
- (9) Ebisawa K., Zycki P., Kubota A., Mizuno T., Wataria K., 2003, ApJ, 597, 780
- (10) Ebisuzaki T., et al., 2001, ApJ, 562, L19
- EN (1999) Edelson R., Nandra, K., 1999, ApJ, 514, 682.
- (12) Fabbiano G., Trinchieri G., 1987, ApJ, 315, 46.
- FPMD (2000) Ferrarese L., Pogge R.W., Peterson B.M., Merritt D., Wandel A., Joseph C.L., 2001, ApJ, 555, L79
- (14) Gebhardt K., et al., 2000, ApJL, 543, L5
- (15) Gierlinski M., Maciolek-Niedzwiecki A., Ebisawa K., 2001, MNRAS, 325, 1253
- (16) Gierliński, M. and Done, C. 2004, MNRAS 349, L7.
- (17) Hidalgo-Gamez A.M., Sanchez-Salcedo F.J., Olofsson K., 2003, A&A, 399, 63
- (18) Kaaret P., Ward M.J., Zezas A., 2004, MNRAS, 351, L83
- (19) King A.R., Davies M.B., Ward M.J., Fabbiano G., Elvis, M., 2001, ApJL, 552, L109
- (20) King, A.R. and Pounds, K.A. 2003, MNRAS 345, 657.
- (21) Körding E., Falcke H., Markoff S., 2002, A&A, 382, L13
- (22) Lehmann I., et al., 2005, A&A, 431, 847
- (23) Madau P., Rees M.J., 2001, ApJL, 551, L27
- (24) Makishima K. et al., 2000, ApJ, 535, 632
- (25) Markowitz A., et al., 2003, ApJ, 593, 96
- (26) McClintock J. E., Remillard R. A., 2005, in Compact Stellar X-ray Sources, ed. Lewin W. H. G., van der Klis M., Cambridge University Press (Cambridge), in press (astro-ph/0306213)
- (27) McHardy I. M., Papadakis I. E., Uttley P., Page M., Mason K., 2004, 348, 783
- (28) McHardy I. M., Gunn K. F., Uttley P., Goad M. R., 2005, MNRAS, 359, 1469
- (29) Miller J.M., Fabbiano G., Miller M.C., Fabian A.C., 2003, ApJL, 585, L37
- (30) Miller J.M., Fabian A.C., Miller M.C., 2004, ApJ, 607, 931
- (31) Miller N.A., Mushotzky R.F., Neff S.G., 2005, ApJ, 623, L109
- (32) Mitsuda K., et al., 1984, PASJ, 36, 741
- (33) Miyaji T., Lehmann I., Hasinger G., 2001, AJ, 121, 3041
- (34) Morrison R., McCammon D., 1983, ApJ, 270, 119
- (35) Pakull M.W., Mirioni, L., 2002, preprint (astro-ph/0202488)
- (36) Pourquet, D., Reeves, J.N., O’Brien, P., and Brinkmann, W. 2004 A&A 422, 85.
- (37) Pottschmidt K., et al., 2003, A&A, 407, 1039
- (38) Rappaport S.A., Podsiadlowski Ph., Pfahl E., 2005, MNRAS, 356, 401
- (39) Remillard R. A., Muno M. P., McClintock J. E., Orosz J. A., 2002, in New Views on Microquasars, ed. Ph. Durouchoux, Y. Fuchs, and J. Rodriguez, Center for Space Physics: Kolkata (India), 49 (astro-ph/0208402)
- (40) Roberts T.P., Warwick R.S., 2000, MNRAS, 315, 98.
- (41) Roberts T.P., Warwick R.S., Ward M.J., Goad M.R., Jenkins L.P., 2005, MNRAS, 357, 1363
- (42) Soria R., Cropper M., Pakull M., Mushotzky R., Wu K., 2005, MNRAS, 356, 12
- (43) Soria R., Motch C., Read A.M., Stevens I.R., 2004, A&A, 423, 955
- (44) Stobbart A., Roberts T.P., Warwick R.S., 2004, MNRAS, 351, 1063
- (45) Titarchuk L., 1994, ApJ, 434, 570
- (46) Uttley P., McHardy I. M., 2005, in prep.
- (47) Uttley P., McHardy I.M., Papadakis I.E., 2002, MNRAS, 332, 231.
- (48) Vaughan S., Iwasawa K., Fabian A.C., Hayashida K., 2005, MNRAS, 356, 524
- (49) van der Klis M., 2005, in Compact stellar X-ray sources, ed., W. H. G. Lewin, M. van der Klis, Cambridge University Press (Cambridge), in press (astro-ph/0410551)
- (50) Walter, R. and Fink, H.H. 1993, A&A 274, 105.
- (51) Wilms J., Allen A., McCray R., 2000, ApJ, 542, 914
- (52) Zdziarski A.A., Gierlinski M., Rao A.R., Vadawale S.V., Mikolajewska J., 2005, MNRAS, 360, 825
- (53) Zezas A.L., Georgantopoulos I., Ward M.J., 1999, MNRAS, 308, 302
- (54) Zhang S.N., Cui W., Chen W., Yao Y., Zhang X., Sun X., Wu X.-B., Xu H., 2000, Science, 287, 1239