PulsarSpectrum: simulating gamma-ray pulsars for the GLAST mission
Abstract
We present here an overview of PulsarSpectrum, a program that simulates the gamma ray emission from pulsars. This simulator reproduces not only the basic features of the observed gamma ray pulsars, but it can also simulate more detailed effects related to pulsar timing. It is a very useful tool to understand the GLAST capabilities in the pulsar science.
1 Introduction
Pulsars are among the most exciting gamma ray sources in the Universe and can serve as unique sites for the study of emission processes in extreme physical environments. The Gamma ray Large Area Space Telescope (GLAST) will increase dramatically our knowledge of gamma ray pulsars physics. In particular the Large Area Telescope (LAT), the main GLAST instrument, will provide more detailed observations of the known gamma ray pulsars and potentially will discover many new pulsars that emit gamma rays. To better understand the capabilities of GLAST for pulsar science we developed PulsarSpectrum, a program that simulates gamma ray emission from pulsars. This simulator can be easily interfaced with the Monte Carlo software that simulates the response of the LAT.
1.1 Gamma ray pulsars in the GLAST era
Pulsars have been associated with high energy gamma ray astronomy since the first experiment capable to resolve point sources. The Small Astronomy Satellite(SAS-2), launched in 1972, identified three intense sources in the sky, that in the following turned out to be the Vela, Crab and Geminga pulsars. A signal modulated at the radio period was found for Vela [\refciteKniff74] and Crab [\refciteThomp75], but for Geminga no radio counterpart was found and this source remained quite mysterious until it was identified as an X-ray and gamma-ray pulsar. The Energetic Gamma Ray Experiment (EGRET) aboard the Compton Gamma Ray Observatory (CGRO) detected three more pulsars, B1706-44 [\refciteThomp92], B1055-52 [\refciteFierro93] and later B1951+32 [\refciteRaman95]. Another one, B1509-58 was observed at energies between 60 keV and 2 MeV by the three CGRO experiments, the Burst and Transient Source Experiment (BATSE)[\refciteWilson93], the Oriented Scintillation Spectrometer Experiment (OSSE), [\refciteUlmer93] and the Imaging Compton Telescope (COMPTEL)[\refciteBennet93], but it was not seen by EGRET, because the spectrum shows a cutoff at energies lower than the instrument’s threshold. Recently the millisecond pulsar PSR 0218+4232 was detected by analyzing the EGRET data [\refciteKuiper00], increasing to eight the number of detected gamma ray pulsars, seven of them are radio-loud pulsars and only Geminga seems to be radio quiet.
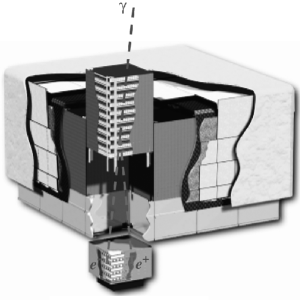
The GLAST Large Area Telescope (LAT) (fig 1), is a pair conversion telescope based on the most advanced high energy detectors. It consists in a precision silicon strip tracker, a hodoscopic calorimeter and a segmented anticoincidence shield for particle background rejection. The LAT high sensitivity (2 10-9 ph/cm2/s) and effective area (8000 cm2) will permit the discovery of a lot of new pulsars: the estimates range between tens to hundreds depending upon the model adopted. Moreover the low dead time of the detector (20 s) will allow the detailed reconstruction of pulsar lightcurves. One of the most exciting possibilities of the LAT will be the coverage of the energy window from 30 GeV up to 300 GeV, a still unexplored range. At these energies the theoretical models make different previsions on the high energy spectral cutoff and the spectral coverage of LAT will be of primary importance for constraining and discriminating among the models. In order to study the LAT response to specific gamma ray sources, various simulation packages have been developed. Here we present PulsarSpectrum, that can simulate the observed pulsars and create new fake pulsars for the LAT threshold detection identification.
2 The PulsarSpectrum simulator
2.1 Overview of the simulator
The basic idea behind PulsarSpectrum is to construct a 2-dimensional histogram representing the differential flux vs. energy and pulsar phase. This histogram contains all the basic informations about lightcurve and spectrum. How it is built depends upon the model we want to use: a phenomenological model, based only on observations, or a physical one, based on a specific theoretical model. At present only a phenomenological model has been implemented because it is more flexible and completely independent from the chosen theoretical scenario. The input parameters of the simulator can be divided in two categories:
-
•
Observational parameters, (i.e the flux or the ephemerides);
-
•
Model-dependent parameters, (i.e. the spectral index);
These parameters are placed in two specific data files used by both PulsarSpectrum and the LAT simulation tools. PulsarSpectrum creates the lightcurve and the spectrum from these parameters and combines them to obtain a two-dimensional matrix that represents the flux in ph/m2/s/keV. The photons are then extracted such that the interval between two subsequent photons is determined by the flux integrated over the energy range of interest.
2.2 The phenomenological model
The currently implemented phenomenological model allows the user to generate pulsar lightcurves in a general way using a single or double Lorenzian peak profile whose shape is determined from random generated numbers. The lightcurve can be generated alternatively from a user-provided profile. This is useful for simulating the already observed gamma ray pulsars. The spectral shape is assumed to be a power law with exponential cutoff (according to [\refciteNelDj95]), as in the observed gamma-ray pulsars and can then be modeled as:
| (1) |
The normalisation constant K is determined by the photon flux above 100 MeV and the other four parameters can be varied; the values for the EGRET pulsars are obtained from real data by fitting procedures (e.g. [\refciteNelDj95]).
2.3 Timing issues
Once the differential flux histogram is created the time interval between two subsequent photons is computed according to the flux. If the previous photon came at time t0 the next photon will appear at such that:
| (2) |
The interval between two photons is computed assuming that the pulsar period does not change with time and the photons arrival times are computed into a reference system fixed relative to stars. This is not the ”real world”. Pulsar timing is affected by more complicate effects, as (1)- The motion of the spacecraft through the Solar System and the relativistic effects due to gravitational well of the Sun (see 2.3.1); (2)- Period changes with time (see 2.3.2). For pulsars in binary systems an additional modulation to the orbital period should be taken into account. For a precise pulsar simulator intent to produce a realistic list of photon arrival times we need to include all these effects (to transform to the observational frame). All these procedures are now implemented in the code and only the binary demodulation is not yet implemented. The real arrival time of a photon from a pulsar must be first barycentered and then phase assigned.
2.3.1 Barycentric effects
The first step to analyze pulsar data is the conversion from the arrival times at the spacecraft, usually expressed in Terrestrial Time TT or TAI, to the arrival times at the Solar System barycenter, expressed in Barycentric Dynamical Time TDB. Taking into account both the motion of spacecraft through space and the general relativistic effects due to the gravitational field of the Sun (i.e. Shapiro delay), the simulator computes the opposite of the barycentric correction by considering the position of the Earth and of the spacecraft in the Solar System, and the position of the Sun. The accuracy for the computation of these ”de-corrections” is hard-coded in the program.
2.3.2 Period change and ephemerides
The rotational energy of a radio pulsar decreases with time and hence the period increases with time. For gamma ray pulsar science the radio ephemerides are fundamental for assigning the correct phase to each photon. If we know the frequency f) and its derivatives and at a certain time t0, known as epoch, the phase is then:
| (3) |
The interval between two photons must be ”de-corrected” for this effect. In the parameters file the user can specify a set of ephemerides with the relative epoch of validity expressed in Modified Julian Date. The simulator then computes the opportune arrival time such that, after applying the barycentric corrections and the equation 3, the correct phase is obtained.
3 Conclusions
PulsarSpectrum has been successfully used by the GLAST collaboration for testing the functionality of the LAT Science Analysis Tools, a set of analysis programs specifically designed to analyse the LAT data after launch. Periodically these tools are evaluated through specific Checkout phases. In absence of real data there is strong need of detailed simulated data, most of them provided by PulsarSpectrum. PulsarSpectrum is the most probable candidate to be used as pulsar simulator in the GLAST Data Challenge 2, an analysis phase where some months of LAT data are simulated. A new interesting opportunity is now raising from the creation of the LAT Science Groups, to study GLAST science opportunities on specific topics. Our simulator has all the characteristics to fit well the requirements of the LAT Pulsar Science Group.
References
- [1] D.A. Kniffen et al. Nature 251, 397 (1974).
- [2] D.J. Thompson et al. ApJ 200, L79 (1975).
- [3] D.J. Thompson et al.Nature 359, 615 (1992).
- [4] K. Bennet at al.Proc 23d Int. Cosmic Ray Conf (Calgary) 1, 172 (1993).
- [5] J.M. Fierro et al.ApJ 413, L27 (1993).
- [6] M.P. Ulmer et al.ApJ 417, 738 (1993).
- [7] R.B. Wilson et al.Isolated Pulsars, ed. K.A. Van Riper,R.Epstein, and C.Ho (Cambridge:Cambridge Univ. Press) 257 (1993).
- [8] H.I. Nel and O.C. De Jager Astrophysics and Space Science 230, 209 (1995).
- [9] P.V. Ramanamurthy et al. ApJ 447, L109 (1995).
- [10] L.Kuiper Pulsar Astronomy, 2000 and Beyond, IAU Colloquium 177, Astronomical Society of Pacific, San Francisco , 355 (2000).
- [11] X. Yan, Phys. Rev. E61, 4745 (2000).