Looking for z7 galaxies with the Gravitational Telescope
Abstract
We summarize the main results obtained recently by our group on the identification and study of very high- galaxies (z7) using lensing clusters as natural gravitational telescopes. A description of our pilot survey with ISAAC/VLT is presented, aimed at the spectroscopic confirmation of z7 candidate galaxies photometrically selected from deep near-IR, HST and optical ground-based imaging. The first results issued from this survey are discussed, in particular the global photometric properties of our high- candidates, and the implications for the global star formation rate at very high-.
(1) Observatoire Midi-Pyrénées, Laboratoire d’Astrophysique, UMR 5572, 14 Avenue E. Belin, F-31400 Toulouse, France
(2) Geneva Observatory, 51 Ch. des Maillettes, CH–1290 Sauverny, Switzerland
(3) OAMP, Laboratoire d’Astrophysique de Marseille, UMR 6110 traverse du Siphon, 13012 Marseille, France
1 Introduction
Considerable advances have been made during the last decade in the exploration of the early Universe, from the discovery and detailed studies of redshift galaxies (the so-called Lyman break galaxies, LBGs, e.g. Steidel et al. 2003), over 4–5 galaxies found from numerous deep multi-wavelength surveys, to galaxies at 6–7, close to the end of reionisation epoch of the Universe (e.g. Hu et al. 2002, Kodaira et al. 2003, Cuby et al. 2003, Kneib et al. 2004, Stanway et al. 2004, Bouwens et al. 2004b). Extending the searches beyond 6.5 and back to ages where the Universe was being re-ionized (cf. Fan et al. 2002) requires extremely deep observations in the near-IR bands. Indeed, astounding depths can be reached in ultra-deep fields, such as demonstrated e.g. recently with J and H imaging of the NICMOS Ultra-Deep Field (UDF; Thompson et al. 2005; Bouwens et al. 2004a, Bouwens et al. 2005) from which 5 faint ( 27) candidates at 7–8 have been identified (Bouwens et al. 2004b).
We present in this paper a summary of our results on a deep survey of lensing clusters with ISAAC/VLT, aimed at constraining the abundance of star-forming galaxies at taking benefit from lensing magnification to improve the search efficiency and subsequent spectroscopic studies (see more details in Pello et al. 04 and Richard et al. 05). We briefly describe the photometric technique used to identify very high- objects, the construction and analysis of the photometric catalogs, the luminosity funtions (LFs) derived for star-forming galaxies up to , and the implications for the cosmic SFR. Throughout this paper we adopt standard cosmological parameters (, , ).
2 Photometric Survey and Selection of High-z Candidates
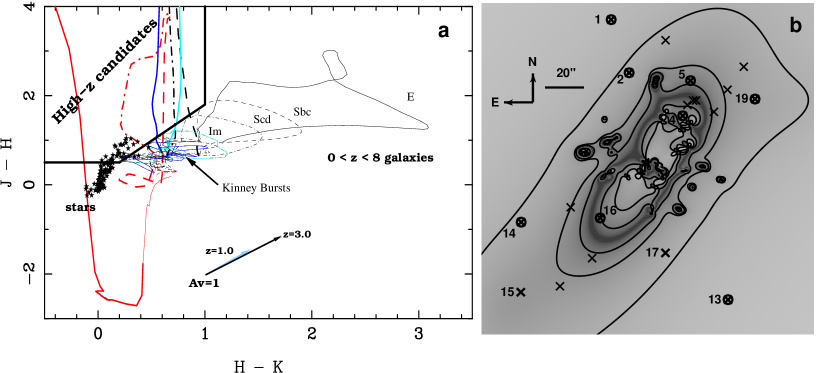
The objective of our Survey was to obtain deep near-IR photometry from 1.0 to 2.4 m, in order to derive accurate photometric redshifts for optical dropouts in the critical domain . Simulations have been done to define the observing strategy to target high- sources using the evolutionary synthesis models by Schaerer (2002, 2003) for Population III and extremely metal deficient starbursts, together with the usual templates for normal galaxies. The main relevant signatures of genuine star-forming sources at , which are common to all models, are well known: they are optical dropouts, displaying a strong break and “red” optical vs. IR colors, whereas they exhibit a “blue” SED redwards due to UV rest-frame emission. Different redshift intervals are defined using the appropriate set of near-IR filters in combination with optical data through the Lyman break technique, by constraining both the position of the break and the restframe UV slope. Figure 1 illustrates this technique in the domain.
The two lensing clusters used in this study were AC114 () and Abell 1835 (). AC114 is a well-known gravitational telescope, with a lens model well-constrained by a large number of multiple-images at high- (Smail et al. 1995, Natarajan et al. 1998, Campusano et al. 2001). A1835 is the most X-ray luminous cluster in the sample (Ebeling et al. 1998), thus potentially one of the most efficient gravitational telescopes. We observed these clusters in the 0.9 to 2.2 m domain between September 2002 and April 2004, covering as far as possible the , , , , and bands. Optical images between and bands were available from previous surveys and data archives (Table 1).
| Filter | seeing | pix | depth | Reference | ||||
| [ksec] | [′′] | [′′] | [mag] | [nm] | [mag] | |||
| AC114 | 20.00 | 1.3 | 0.36 | 29.1 | 365 | 0.693 | Barger et al. 1996 | |
| 9.00 | 1.2 | 0.39 | 29.0 | 443 | -0.064 | Couch et al. 2001 | ||
| 21.60 | 1.1 | 0.47 | 28.5 | 547 | 0.022 | Smail et al. 1991 | ||
| 24.90 | 0.13 | 0.100 | 28.4 | 700 | 0.299 | Natarajan et al. 1998 | ||
| 20.70 | 0.3 | 0.100 | 26.8 | 801 | 0.439 | Smail et al. 1991 | ||
| 6.48 | 0.52 | 0.148 | 25.5 | 1259 | 0.945 | Richard et al. 05 | ||
| 13.86 | 0.40 | 0.148 | 24.7 | 1656 | 1.412 | Richard et al. 05 | ||
| 18.99 | 0.34 | 0.148 | 24.3 | 2167 | 1.873 | Richard et al. 05 | ||
| A1835 | 3.75 | 0.76 | 0.206 | 28.1 | 543 | 0.018 | Czoske et al. 2002 | |
| 5.40 | 0.69 | 0.206 | 27.8 | 664 | 0.246 | Czoske et al. 2002 | ||
| 7.50 | 0.12 | 0.100 | 27.7 | 700 | 0.299 | Smith et al. 2003 | ||
| 4.50 | 0.78 | 0.206 | 26.7 | 817 | 0.462 | Czoske et al. 2002 | ||
| 6.36 | 0.70 | 0.252 | 26.7 | 919 | 0.554 | Richard et al. 05 | ||
| 21.96 | 0.54 | 0.148 | 26.9 | 1063 | 0.691 | Richard et al. 05 | ||
| 6.48 | 0.65 | 0.148 | 25.6 | 1259 | 0.945 | Richard et al. 05 | ||
| 13.86 | 0.50 | 0.148 | 24.7 | 1656 | 1.412 | Richard et al. 05 | ||
| 18.99 | 0.38 | 0.148 | 24.7 | 2167 | 1.873 | Richard et al. 05 |
Near infrared photometry of extremely faint sources requires a careful data reduction, described in details by Richard et al. (2005). In summary, after a standard pre-reduction (ghost, dark and flat-field corrections), we used the IRAF package XDIMSUM111XDIMSUM is a modified version by the IRAF group of the Deep Infrared Mosaicing Software package by P. Eisenhardt et al. See ftp://iraf.noao.edu/extern-v212/xdimsum for details for a two-step sky-subtraction. During the first pass, each image is sky-subtracted using the sky pattern obtained from a group of adjacent frames and a bad-pixel mask is created in the process. Images are registered and combined using integer shifts values to preserve the noise properties, with bad-pixel rejection. Then, sources are detected in order to create an object mask, and a second sky-subtraction is applied to the data. Several versions of the final images were produced, using slightly different reduction recipes, in order to cross-check the final catalogs.
Photometry in the near-IR bands was obtained after matching all images to a common seeing with a gaussian convolution, the worst case being the band for both clusters. The package (Bertin & Arnouts 1996) was used for source detection and photometry. We optimized the parameters to detect very faint unresolved sources, in order to build an -band selected sample. The original images were used to derive the error bars in each band through detailed simulations. Also limiting magnitudes in the Table 1 and completeness levels in the different filters were obtained in this way. The final catalogs include photometry within 1.5′′ apertures for all objects detected in the band; we were able to measure photometry of very faint sources (, and 23.5) with a relatively good accuracy (S/N 3-4). The fraction of spurious detections expected in our photometric catalogs, for objects detected only in the reference filter , was estimated from a special band noise image where all astronomical sources were removed by subtracting by pairs sequential images acquired with similar seeing conditions, and then coadding them using the same procedure as for astronomical images. The result is an image with the same noise properties compared to the final stacks, but without astronomical sources. We find that for the faintest magnitude bins considered in this survey, the maximum number of false-positive detections should be typically lower than 50 %, for sources detected only in the reference filter , and no spurious detections are expected up to (AB).
A catalog of optical dropouts was selected (i.e., objects non-detected in all the optical images, from to bands). First-category sources are those detected in at least two near-IR bands. Among them, 89% of sources detected in the -band reference image in A1835 (and 75% in AC114) are also re-detected in the pseudo- image. The later was obtained from the combination of individual , and images, normalized by the noise 1 image, and weighted by the square root of the corresponding exposure-time maps. After careful manual inspection, the final catalog of first/second-category dropouts for Abell 1835 and AC114 contains 18/6 and 8/2 sources respectively, and number of third category sources (dubious after manual inspection, detected only in the reference filter) close to the critical lines.
The position of optical dropouts in the different color-color diagrams provides an estimate of their photometric redshift, and an objective criterium to classify them into different intervals. The majority of optical dropouts in the two clusters fulfill the high- requirements in Fig. 1. Those located in the region of the diagram fulfill the ERO selection criterium (), and some of them could be intermediate-redshift dusty starbursts. The and color-color diagrams were used to select candidates in the range and respectively. For about 30 of our candidates, the S/N is enough to derive photometric redshifts based on SED-fitting using an adapted version of the public software (Bolzonella et al. 2000). Objects unambiguously identified as low- galaxiess are excluded from the sample, as well as sources whose nature could not be determined with the present data (either variable sources or “bright” EROs with ambiguous but plausible low- solutions).
High- candidates were selected based only on their photometric properties, irrespective of their positions with respect to the critical lines. However, objects located close to the high- critical lines are of greater interest, because of the larger magnification. The minimum magnification factor over the region covered by our near-IR survey is at least 0.7 magnitudes, and at least 1 magnitude over 50 % of the ISAAC field of view. Thus, the effective limiting magnitudes reached here are, at worst, similar to those attained in the HDFS (Labbé et al. 2003) in (respectively AB 26.8, 26.2 and 26.2). Our limiting magnitudes in the band are also very close to the typical magnitudes of the -dropouts detected by Bouwens et al. (2004b) in the Hubble Ultra Deep Field, with 26.0 to 27.3, after correction for a typical magnification factor of at least 1 magnitude.
3 Luminosity Function and Cosmic Star Formation Rate
The typical magnification values of our candidates range between 1.5 ( 0.44 mags) and 10 (2.5 mags). For some objects very close to the critical lines, we found magnifications values . Interestingly, although the selection criteria are only based on near-IR colors irrespective of magnitudes, almost all the photometric candidates fulfilling our selection criteria turn out to be fainter than (AB ). Only three exceptions are found in Abell 1835 among the possible low- EROs, as described above. After correction for magnification accross these fields, the lack of “bright” sources means that we have not detected young starbursts at more massive than typically a few 108 M⊙ (under standard assumptions for the IMF).
We derived the unlensed luminosity, at 1500 Å restframe, for all high- candidates, using the adopted photometric redshift. luminosities were converted into Star Formation Rate (SFR) through the usual calibration from Kennicut (1998). The typical SFR obtained for objects included in the final sample is 10 Myr-1, with extreme values ranging from a few units to 20 M⊙ yr-1. The restframe UV slope of our candidates is extremely blue, usually ranging between and , a systematic trend also reported by Bouwens et al. (2004b) for their sample of candidates. Although optical-dropouts are stretched by the magnification factor , they appear as point-like sources in our ground-based images. The physical size of these objects at is likely to be smaller than 1.7 kpc, with the magnification factors involved.
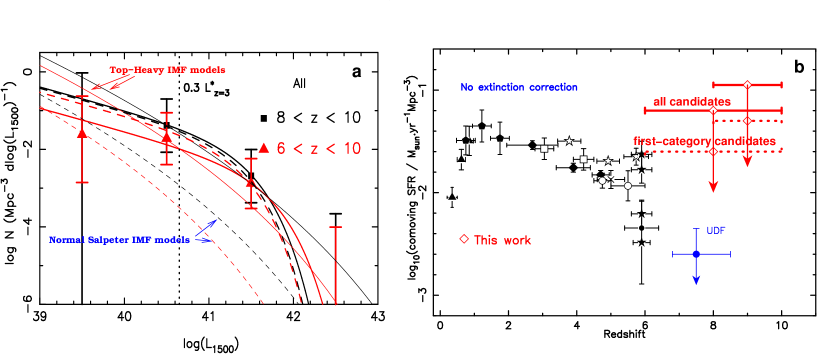
Magnification and dilution effects by the lensing field were carefully taken into account to compute number densities and derived quantities, in particular to estimate the LF at 1500 Å . The observed sample of candidates was also corrected for incompleteness using mock simulations (see details in Richard et al. 2005). The combined LFs for both clusters, with the corresponding error-bars, are given in Fig. 2. Only first-priority candidates have been considered, but the difference obtained when using the full sample is within error bars. STY fits (Sandage, Tammann & Yahil 1979) to the data are also presented in Fig. 2. The typical value found for is ergs s-1 s-1 Å -1, with a fixed value (i.e., Steidel et al. (1999) determination for LBGs at ). The STY fit to the data is in remarkably good agreement with the LF found by Steidel et al. for LBGs at , with the usual correction to account for the surface brightness increase with redshift due to size scaling for a fixed luminosity, without any additional renormalization. A fairly good agreement is also found when comparing with the LF derived by Bunker et al. (2004) for their sample of candidates in the UDF, i.e. a density of sources (-0.8 dex) smaller as compared to LBGs at , still within our error bars. We compare the observed LFs to the predictions obtained from a simple model for halo formation based on Press-Schechter formalism, assuming that all haloes convert a constant fraction of their baryonic mass into stars somewhen between and , with a correction for the visibility time of starbursts, and using two extreme IMF assumptions: a standard Salpeter and a top-heavy IMF (stars between 50 and 500 M⊙). “Top heavy” IMF models provide a better fit for the bright end of the LF, but this simple model can hardly explain simultaneously the behaviour of the bright and faint ends of the LF.
Figure2 displays the upper limits for the Cosmic SFR value obtained for each redshift bin, by integrating the LFs down to , compared to other surveys.
4 Discussion and Conclusions
Taken at face value, the cosmic SFR density found in this survey is in good agreement with the theoretical estimates for the redshift domain considered here derived by Barkana & Loeb (2001; see their Fig. 29), for a reionization redshift . However, there is a discrepancy by a factor of between our results and previous studies at similar redshifts, in particular in the UDF (Bouwens et al. 2004, 2005). In all cases, the sources detected are photometric candidates, and thus upper limits to the actual UV flux densities. The effective fields surveyed are dramatically small, thus leading to strong field-to-field variations in the number of sources. Cluster-to-cluster fluctuations are clearly seen in our sample, although lensing and photometric considerations could account for most of them. A positive magnification bias could still be present in this survey (the incompleteness of our sample in the relevant magnitude domain is smaller than in blank-field surveys), producing a systematic trend as compared to blank fields. Could this result be confirmed on a larger sample of lensing clusters and blank fields, the slope of the number counts at could be precisely constrained, at least for the brightest part of the LF.
Up to now, our spectroscopic survey with ISAAC has targeted 2 candidates in AC114, and 7 in Abell 1835 (4 first priority targets and 3 secondary ones; Pelló et al. 2004); 2/3 of objects in this sample display emission lines. The efficiency of our survey nowadays could range between and 50%, with interesting low- by-products. A large majority of our high- candidates still need to be confirmed, either by a redetection of the faint emission line, or by the non-detection of other lines expected at low-.
The results presented here are to be confirmed in different ways. An enlarged spectroscopic survey is urgently needed to determine the efficiency of our selection technique. Also, increasing the number of lensing fields with ultra-deep near-IR photometry is essential to get tighter constraints on the abundance and physical properties of starburst galaxies.
Acknowledgements. Based on observations collected at the European Southern Observatory, Chile (069.A-0508,070.A-0355,073.A-0471), the NASA/ESA Hubble Space Telescope operated by the Association of Universities for Research in Astronomy, Inc., and the Canada-France-Hawaii Telescope operated by the National Research Council of Canada, the French Centre National de la Recherche Scientifique (CNRS) and the University of Hawaii. Part of this work was supported by the CNRS and the Swiss National Foundation.
References
- [1] Barkana, R. & Loeb, A. , 2001, Physics Reports, 349, 125
- [2] Bertin, E., Arnouts, S., 1996, A & AS, 117,393.
- [3] Bolzonella, M., Miralles, J.M., Pelló, R., 2000, A & A, 363, 476.
- [4] Bouwens, R. J., Illingworth, G. D., Blakeslee, J. P., Broadhurst, T. J., & Franx, M. 2004a, ApJ 611, L1.
- [5] Bouwens R. J., Thompson R. I., Illingworth G. D., et al. 2004b, ApJ 616, L79
- [6] Bouwens, R. J., Illingworth, G. D., Thompson, R. I., Franx, M., 2005, ApJ, 624, L5.
- [7] Bunker, A. J., Stanway, E. R., Ellis, R. S., & McMahon, R. G. 2004, MNRAS, 355, 374
- [8] Campusano, L.E., Pelló, R., Kneib, J.-P., et al. 2001, A & A, 378, 394.
- [9] Cuby, et al. 2003, A&A 405, L19.
- [10] Ebeling, H., Edge, A. C., Bohringer, H., et al. 1998, MNRAS, 281, 799.
- [11] Fan, X., et al. 2002, AJ, 123, 1247.
- [12] Giavalisco M., et al., 2004, ApJ, 600, L103.
- [13] Hu, E. M., Cowie, L. L., McMahon, R. G., et al. 2002, ApJ 568, L75.
- [14] Kennicutt, R. C. 1998, ARA&A, 36, 189
- [15] Kneib, J.-P., Ellis, R.S., Santos, M.R., Richard, J., 2004, ApJ 607, 697.
- [16] Kodaira, K., et al. 2003, PASPJ 55, L17.
- [17] Labbé, I., Franx, M., Rudnick, G., et al. 2003, AJ, 125, 1107.
- [18] Lilly, S. J., Le Fevre, O., Hammer, F., & Crampton, D. 1996, ApJ 460, L1.
- [19] Natarajan, P., Kneib, J.-P., Smail, I., Ellis, R.S., 1998, ApJ, 499, 600.
- [20] Pelló, R., Schaerer, D., Richard, J., Le Borgne, J.-F., Kneib, J.-P., 2004, IAU Symp. No. 225: The Impact of Gravitational Lensing on Cosmology, Y. Mellier and G. Meylan, Eds., [astro-ph/0410132]
- [21] Richard, J., Pello, R., Schaerer, D., Le Borgne, J. F., Kneib, J.-P., 2005, submitted to A & A
- [22] Sandage, A., Tammann, G. A. & Yahil, A. 1979, ApJ 232, 352
- [23] Schaerer, D. 2002, A & A 382, 28.
- [24] Schaerer, D. 2003, A & A 397, 527.
- [25] Smail, I., Couch, W.J., Ellis, R.S., Sharples, R.M., 1995, ApJ, 440, 501.
- [26] Stanway, E. R., Bunker, A. J., McMahon, R. G., et al. 2004, ApJ, 607, 704
- [27] Steidel, C. et al., 2003, ApJ 592, 728.
- [28] Thompson, R.I., Illingworth, G., Bouwens, R., et al., 2005, AJ, 130, 1.