Bar instability in cosmological halos
Abstract
Aims. We want to investigate the growth of bar instability in stellar disks embedded in a suitable dark matter halo evolving in a fully consistent cosmological framework.
Methods. We perform seven cosmological simulations to emphasise the role of both the disk-to-halo mass ratio and of the Toomre parameter, Q, on the evolution of the disk.We also compare our fully cosmological cases with corresponding isolated simulations where the same halo, is extracted from the cosmological scenario and evolved in physical coordinates.
Results. A long living bar, lasting about 10 Gyr, appears in all our simulations. In particular, disks expected to be stable according to classical criteria, form indeed weak bars. We argue that such a result is due to the dynamical properties of our cosmological halo which is far from stability and isotropy, typical of the classical halos used in literature; it is dynamically active, endowed of substructures and infall.
Conclusions. At least for mild self-gravitating disks, the study of the bar instability using isolated isotropic halos, in gravitational equilibrium, can lead to misleading results. Furthermore, the cosmological framework is needed for quantitatively investigating such an instability.
Key Words.:
Galaxies: evolution, kinematics and dynamics, spirals, halos1 Introduction
Several work on bar instability in stellar disks has been done using N-body spherical halos (Sellwood (1981); Athanassoula et al. (1987); Debattista & Sellwood (2000); Patsis & Athanassoula (2000); Mayer & Wadsley (2004)).
Curir & Mazzei (1999) were the first to emphasise
the role of both the geometry and of the dynamical state of a
live dark matter (DM) halo in
enhancing the bar formation. Progressive efforts
for improving models of the halo have been made in
the last years (Mazzei & Curir (2001); Athanassoula & Misiriotis (2002)),
taking into account also the informations coming from the cosmological hierarchical
clustering scenario of structures formation about density distribution and
concentration of DM halos.
In the meanwhile, the ever-growing computing power available to the community
has made possible to start simulations of formation and evolution of
galaxies in a fully cosmological context.
First works devoted to deep our understanding of disk galaxies in such a
scenario (Governato et al. (2004); Abadi el al. (2003)) have shown that is very difficult to obtain pure
disk galaxies mainly because of the
high angular momentum loss of the gaseous component. Even with
a careful choice of the hosting DM halo, the simulated
galaxies appear to have over–massive bulges compared to their disks.
In a recent paper, Robertson et al. (2004) claim to have overcome
most problems, however the bar instability has not yet been
analysed in a cosmological framework.
Furthermore, the high CPU cost of such simulations does not yet
allow to explore the role of several
parameters, most related to the phenomenological treatment of the
star formation rate and
feedbacks, on the morphologies of the generated
galaxies (Mazzei & Curir (2003); Mazzei (2003)).
In this work we present the first attempt to analyse the growth of bar
instability in a fully consistent cosmological scenario.
We embed a pure stellar disk inside a cosmological halo selected in a
suitable slice of Universe and follow its evolution inside a cosmological
framework.
We want to explore how the bar instability behaves
and what is the role of such a scenario. In particular we want to address,
besides the role played by the disk-to-halo mass ratio, that of
the dynamical state of such an halo as given by
its substructure and infall, or more generally by its evolution.
Our model cannot be
viewed as a general, “all-purpose” galaxy evolution model, since the
gradual formation and growth of the stellar disk is a fundamental
component of the galaxy evolution itself. However
our approach allows to vary parameters like the disk-to-halo mass ratio
and the disk temperature, as given by Q parameter,
to analyse the growth of the bar instability and its dependence on such
parameters for the first time in a self-consistent cosmological framework.
We analyse further the
influence of the cosmological environment by comparing these results
with those in an isolated scenario with the same halo.
The plan of the paper is the following: Section 2 and 3 describe technical
details, in particular the recipe for the initial system and our framework,
focusing on the cosmological evolution and on the properties of the halo.
In Section 4 we present the whole set of our disk+halo
simulations; in Section 5 we point
out our results in the cosmological context and the comparison with isolate runs. In Section 6 is our discussion
and in Section 7 our conclusions.
In the Appendix we analyse
the robustness of our results, checking for particle
resolution and softening length effects.
2 Numerical method
Our galaxy model consists of a truncated exponential disk (Curir & Mazzei, 1999), self-consistently
embedded in a suitable DM halo extracted from a cosmological simulation.
To select the DM halo, we perform a low-resolution (1283 particles)
simulation of a “concordance” CDM cosmological model:
=0.3, =0.7, ,
=0.7, where is
the total matter of the Universe, the
cosmological constant, the normalisation of the power spectrum,
and the value of the Hubble constant in units of
km s-1 Mpc-1.
The
box size of our simulation is Mpc, which allows us
an adequate cosmological tidal field and no boundary effects
on our disk. The initial redshift is 20.
We employ the public parallel N-body treecode GADGET (Springel et al., 2001).
Our initial condition code has been adapted from the setup code of ART
(Kravtsov et al. (1997); Kravtsov (1999); courtesy of A. Klypin).
From this simulation
we identify the DM halos at z=0 in the mass
111In the following, we will refer to the mass as
the virial mass i.e. that enclosed in a sphere with overdensity
(Navarro et al., 2000). range
0.5- 510 M with a standard
friends-of-friends algorithm.
We discard the halos belonging or near to
overdense regions (see Sect. 3). Then we follow back
the simulation and discard those which suffer significant
mergers after a redshift of 5.
So we select one suitable DM halo with a mass
M1011 M⊙ (at z=0). We
resample it with the multi-mass technique
described in Klypin et al. (2001). The particles of the DM halo, and those
belonging to a sphere with a radius Mpc, are followed
to their Lagrangian position and resampled to an equivalent resolution of
1024 3 particles.
The total number of DM particles in the high resolution region
is which corresponds to a DM mass resolution of
M⊙.
The needed high frequency power is added without modifying
the low-frequency Fourier phases of the CDM power spectrum
in our low resolution run. The high resolution zone is surrounded by three
shells with lower and lower resolution, the lowest one including all the
remaining (not resampled) particles among the initial 1283 set.
The size of the initial Lagrangian region is large enough to resolve with high
resolution not only the DM halo, but also its accreting
sub–halos.
The high-resolution DM halo is followed
to the redshift z=0. We checked that no lower
resolution particles (intruders) are ever present at a radius lower than
2 Mpc from its centre. This corresponds
to the particle with the minimum gravitational energy.
Our approach allows
us to account for the cosmological tidal field acting on the DM halo
and to accurately follow the evolution of the selected halo in a self-consistent
way.
We carried out two sets of simulations embedding the
galactic disk in the halo at the redshifts and respectively.
The first choice corresponds to 10.24 Gyr down to in our chosen cosmology, the second one to
7.71 Gyr.
Details of our model disk are presented elsewhere (e.g. Curir & Mazzei, 1999). Here we
summarise the main features of the disk.
The spatial distribution of the star particles follows the
exponential surface density law:
where is the disk scale length, kpc, and
is the surface central density. The disk is truncated at five scale lengths with
a radius:
kpc. To obtain each disk particle’s position according
to the assumed density distribution, we used the rejection method (Press et al., 1986).
The vertical coordinate is extracted from a Gaussian distribution with a standard
deviation equal to 1% of the disk radius. Circular velocities are assigned
analytically to disk particles accounting for the global (disk+cosmological halo) potential,
.
The radial velocity dispersion is assigned through a Toomre
parameter Q. Q is
initially constant at all disk radii and is it defined as
, where
is the epicyclic
frequency, and the surface density of the disk.
According to the isothermal sheet approximation, the ratio of radial to
vertical dispersion is fixed and constant through the disk, moreover the azimuthal dispersion is linked to the radial dispersion via the
epicyclic approximation (Hernquist, 1993).
The final velocity distributions are Gaussian,
with the dispersions given above.
Assigning a constant
initial Q, we can classify easily our disks on the basis of
the initial
temperature.
We explore two values of Q: 1.5, which corresponds to a warm
disk, and 0.5, to a cold disk.
The average Q value of stars in the Milky Way is estimated
between 1 and 3 Binney & Tremaine (1987), however the evolution of such
a parameter starting from high z is not known.
Our model of galaxy is very simplified. Neither gas nor star
formation are introduced since we aim to focus on the
gravitational effect of the halo on the disk and to have hints on the
gravitational feedback of the disk itself on the halo.
Moreover,
our technique is such that the CPU cost of one simulation, while large, is still
much lower than the cost of galaxy formation simulation like
that by Abadi el al. (2003),
even if our force and mass resolution are comparable. Thus our work
could give insights into self–consistent galaxy formation scenario.
In the following we summarise the main steps of our approach:
i) the halo is identified at redshift ;
ii) its particles are tracked back to the selected redshift
(i.e. and ), and the minimum of their potential well is calculated;
iii) a sphere of radius Rsphere=3Rdisk is extracted from
the high resolution simulation; its bulk velocity and the position of
its centre are recorded. Rsphere is chosen to ease the comparison of our results with previous numerical work on disk stability, e.g. Curir & Mazzei (1999)
and Mazzei & Curir (2001).
Note that and
;
iv) the vector angular momentum and the gravitational
potential are calculated, inside ;
v) the disk, in gravitational equilibrium with the potential
and rotating in a plane perpendicular to , is generated;
vi) we embed the disk in the high resolution simulation, at the chosen redshift,
with its centre of mass in the minimum potential well of the DM halo;
vii) the bulk velocity of the halo is added to the star particles.
The cosmological simulation is evolved then,
in comoving coordinates, to the final redshift, .
3 The DM halo
After selecting the halo and resampling at the higher resolution the corresponding Lagrangian region, we run the DM simulation, to extract the halo properties in absence of any embedded stellar disk. The mass of our halo at , M⊙, corresponds to a radius, kpc, which entails 84720 halo particles. The nearest DM halo 222 Halos have been identified using the friends of friends algorithm with a linking length , mean interparticle distances, with more than 8 particles. more massive than is kpc away from the centre of our halo; the less massive one, having mass of , is kpc away. Moreover, the behaviour of the density contrast, , is monotonically decreasing with the radius, and falls below the unity value at physical kpc away from the centre of our halo at , and respectively. Therefore, we conclude that the selected halo is living in an under-dense environment.
| 0 | 18.0 | 1.03 | 94.7 | 84720 | 0.01 | 0.60 | 0.80 |
|---|---|---|---|---|---|---|---|
| 1 | 13.2 | 7.7 | 51.6 | 63886 | 0.02 | 0.78 | 0.92 |
| 2 | 8.3 | 5.2 | 30.9 | 42660 | 0.04 | 0.92 | 0.90 |
I col: redshift
II col: concentration parameter
III col: virial mass, in
IV col: virial radius, in physical kpc
V col: number of DM particles within the virial radius
VI col: spin parameter
VII col: triaxiality parameter within a sphere of radius physical kpc
VIII col: triaxiality parameter within a sphere of radius physical kpc
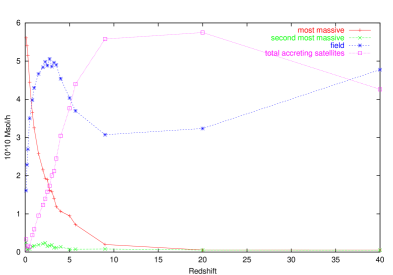
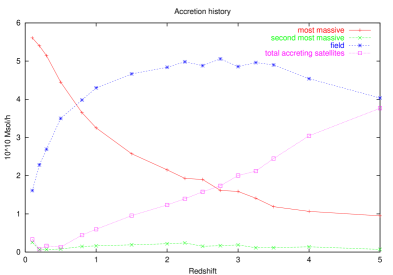
The accretion history of our halo has been
calculated as follows. Starting from redshift , we identified DM halos
using the public halo finder SKID
333http://www-hpcc.astro.washington.edu/tools/skid.html
(Stadel, 2001) at the redshift ,
corresponding to our previous simulation output.
We then define as progenitor of our halo a SKID group at the redshift
, if at least a fraction % of its particles come from the halo at the redshift . We also identify as accreting field particles
all the DM
particles not belonging to any SKID group but belonging to the halo. We then
iterate the procedure, using the simulation output corresponding to the
redshift ; the progenitors are now all the groups which have at least a
fraction of particles coming from progenitors at or from the accreting
field particles, and so on for the earlier redshifts. We check that the
qualitative behaviour of the accretion history is not dependent on the
value of (we also tested =20% and =50%) and on the parameters used in
SKID (we use a typical object size kpc but also the effect of
3 kpc and kpc have been explored).
From Fig. 1, we can note that the halo suffers its
last major merger (i.e. a merger between two progenitors whose masses have a
ratio which is not larger than 3) at .
After ,
the most important contribution to its mass comes from accreting field
particles.
This contribution declines after
becoming less and less important. At , the total accreting mass
is smaller than the mass of the larger sub–halo.
Thus we conclude that or halo has no significant merger during
the time hosting our stellar disk, nor immediately before.
The properties of the selected halo at three relevant redshifts are listen in
Table 1.
Its density profile is well–fitted by a NFW form (Navarro el al. (1996); Navarro et al. (1997))
at . The concentration,
444 We note however that
is defined against , the radius enclosing a sphere with overdensity equal to
200 times the critical density of the Universe, and not against as here;
therefore, in our cosmological model, it is always .
At our halo has .
here defined as
, takes an high value, 18.1, confirming that this halo does “form”
at quite high redshift (see Wechsler et al. (e.g. 2002) for a discussion about
the link between concentration and assembly history of the halo).
The dimensionless spin parameter of the halo is defined as:
(Bullock et al., 2001)
where is the angular momentum inside a sphere of radius and is the halo
circular velocity, . Its values in Table 1
are near to
the average ones for our cosmological model
(; Maller et al., 2002)
4 Disk simulations
We performed seven simulations of the disk+halo system as described here below (Sect. 4.1). By comparing results of such a set of 7 simulations (Sect. 5) with the DM-only, we disentangle the effect of the stellar disk on the halo evolution in the cosmological framework. Several simulations of the disk+halo isolated system are also run, to disentangle the effect of the cosmological environment (Sect. 4.2 and 5.2). We used 56000 star particles to describe our disk; the (Plummer-equivalent) softening length, the same for DM and star particles, is 0.5kpc in comoving coordinates 555Note that, since the disk is modelled in physical coordinates and embedded in the cosmological halo at redshifts and , its thickness is larger than the value of the Plummer softening we use.. We used a time-step criterion based on the local dynamical time (criterion “3” of the GADGET code), which provides time-steps from to (except one case, simulation 5 of Table 2 which needs only time steps). The most CPU–expensive of our simulations needed CPU hours to be completed on the SP4 computer (CINECA computing center).
4.1 Cosmological cases
| halo | ||||||||
|---|---|---|---|---|---|---|---|---|
| c1 | 0.5 | 1 | 2 | 0.64 | 0.64 | 1.9 | 0.67 | |
| c2 | 0.5 | 0.33 | 2 | 0.64 | 1.94 | 1. | 1.08 | |
| c3 | 0.5 | 0.1 | 2 | 0.64 | 6.4 | 0.9 | 1.68 | |
| c4 | 1.5 | 0.33 | 2 | 0.64 | 1.94 | 1. | 1.08 | |
| c5 | 1.5 | 0.1 | 2 | 0.64 | 6.4 | 0.9 | 1.68 | |
| c6 | 0.5 | 0.33 | 1 | 0.67 | 2.0 | 1.05 | 1.05 | |
| c7 | 0.5 | 0.1 | 1 | 0.67 | 6.7 | 1. | 1.6 | |
| i1 | 1.5 | 0.33 | 0.64 | 1.94 | 1 | 1.08 | cosm | |
| i2 | 1.5 | 0.1 | 0.64 | 6.4 | 0.9 | 1.68 | cosm | |
| i3 | 1.5 | 0.33 | 0.64 | 1.94 | 1 | 1.08 | cosm/frozen disk | |
| i4 | 1.5 | 0.33 | 0.95 | 2.87 | 0.85 | 1.5 | NFW | |
| i5 | 1.5 | 0.1 | 0.95 | 9.5 | 1.27 | 1.25 | NFW |
I col: simulation number and simulation type (c: cosmological simulations,
i: isolated simulations)
II col: Q initial value of the disk
III col: mass of the disk in
IV col: initial redshift (for the cosmological cases)
V col: initial DM mass inside the disk radius
VI col: initial halo-to-disk mass ratio inside the disk radius
VII and VIII cols: Efstathiou et al. (1982) parameters, where: , is
the maximum rotational velocity, and the corresponding radius.
IX col: type of halo used (for the isolated cases)
| bulge | bars in bars | ||||||
|---|---|---|---|---|---|---|---|
| c1 | 0.79 | 0.8 | 0.42 | 0.38 | 7 | y | n |
| c2 | 0.77 | 2.39 | 0.33 | 0.44 | 8 | y | n |
| c3 | 0.73 | 7.41 | 0.8 | 0.07 | 3.8 | n | y |
| c4 | 0.78 | 2.40 | 0.48 | 0.37 | 5 | weak | n |
| c5 | 0.73 | 7.41 | 0.70 | 0.08 | 6.5 | n | y |
| c6 | 0.79 | 2.43 | 0.35 | 0.42 | 6.8 | weak | n |
| c7 | 0.77 | 7.73 | 0.58 | 0.16 | 5.0 | n | y |
| i1 | 0.73 | 2.21 | 0.25 | 0.4 | 9.5 | y | n |
| i2 | 0.51 | 5.1 | 0.68 | 0.1 | 8 | n | y |
| i3 | 0.7 | 2.12 | 0.3 | 0.39 | 10 | y | n |
| i4 | 1. | 3.03 | 0.33 | 0.42 | 6 | y | n |
| 15 | 0.95 | 9.5 | 0 | 0 | 0 | n | no bar |
I col: simulation number and simulation type
II col: DM mass inside the disk radius in
III col: halo-to disk mass ratio inside the disk radius
IV col: maximum bar strength at : strong
bar Mazzei & Curir (2001) require
V col: bar strength evaluated according to Combes & Sanders (1981), stronger bar
corresponds to higher values of
VI col: major axis (physical kpc) corresponding to the maximum bar strength
VII col: morphology of the inner region of the disk
VIII col: peculiar features inside the disk
The main parameters and the initial properties of this set of simulations
are listed
in Table 2.
A global stability criteria for bar instability in a disk galaxy
is the one analysed in Efstathiou et al. (1982). In such paper the parameters and (where is the maximum
value of the disk rotational curve, the corresponding radius,
and is the disk mass) have been defined.
Efstathiou et al. (1982) stated the criterion over the range for a disk
model being stable to bar formation. The values of these parameters
are reported in Table 2.
Simulations c1, c2 and c3 in Table 2 refer to a cold disk
(). In simulation c1, at the final time (i.e. )
the baryon fraction inside ,
, is
44% less than its initial value, 0.53.
The final baryon fraction of simulation c2 is , compared
with its initial value, 0.28.
Simulation c3 provides at , 50% less than its initial value.
Simulations c4 and c5
provide the same final baryon’s fractions as the corresponding simulations with
the lower Toomre’s parameter.
Simulation c6 and c7, which explore the
role of the initial redshift on the bar instability, provide quite the same
final values of the baryon’s fraction as
the corresponding simulations c2 and c3.
Neither the Toomre parameter nor the initial redshift affect
the evolution of this ratio which is driven by the mass of the stellar disk.
While the baryon fraction of simulation c1
is too high to be consistent with the
cosmological value 0.166 (Ettori, 2003), all the other simulations give baryon
fractions in the allowed range. We however emphasise that the aim of the current work
is not to build a realistic galaxy model, but to study the effect of different
halo-to-disk mass ratios on the onset of the bar instability.
We verify that the inclusion of the disk
does not result in significant changes in the accretion history of the DM halo.
4.2 Isolated cases
We also performed several simulations of the isolated disk+halo system using
the same halo as extracted from our cosmological simulations at (Sect. 5.2
and Appendix).
By comparing results of this set of simulations with the previous ones
we aim to disentangle the effect of the large scale cosmological structure
and of cosmological expansion on the system evolution.
Moreover, such results are directly comparable both with
our previous works (Curir & Mazzei (1999); Mazzei & Curir (2001))
and with those in literature
(Athanassoula et al., 1987).
The initial and final values for these simulations are listed in Tables
2 and 3. We stress that our isolated
halo is produced by a non dissipative collapse in a cosmological scenario.
As a consequence its mass distribution is not spherically symmetric. Moreover
such a halo is anisotropic and endowed with a spin parameter and substructure.
Therefore it is different from the standard isolated halos used in literature
to study bar instabilities, since it keeps a relic cosmological signature.
When the halo is extracted from its cosmological environment, the large scale
structure, the continuing matter infall and the expansion of the Universe no
longer influence its evolution. Such a halo cannot be in gravitational
equilibrium, because its evolution has not yet completed neither at nor
at , as shown in Fig. 1. For this reason, the results
presented below, concerning the behaviour of the disk embedded in such a
“isolated” halo have to be compared with similar cases, in which
non–equilibrium DM halos are used, as e. g. in Curir & Mazzei (1999); Mazzei & Curir (2001).
After subtracting the CM velocity and embedding the disk, as
described in Sect. 2 items i-v, we integrated the
system in physical coordinates (the effect of the cosmological expansion
is therefore ruled out in these models) . A further
difference is that the softening length is now in physical units.
We have at least 10000 time steps
from the initial time to Gyr corresponding to redshift 0.
Finally, in order to disentangle the effect of the geometry and of the spin of an
isolated halo we also performed two simulations using a Navarro Frenk and
White (NFW) halo having the same virial radius and mass as our cosmological
one. The initial and final values of these two simulations are listed in the
two last lines of Tables 2 and 3.
5 Results
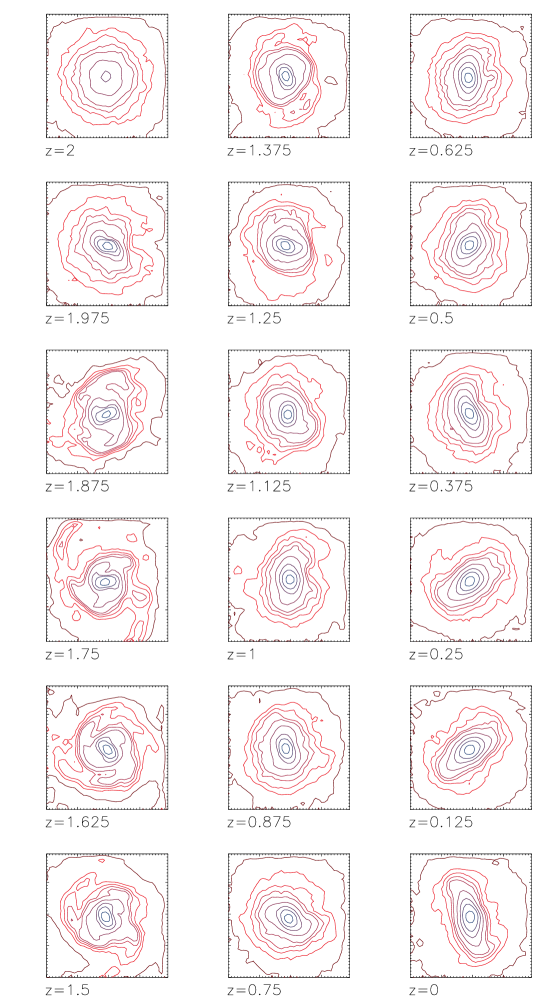
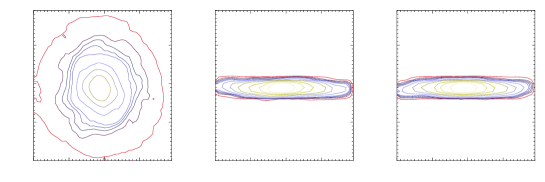
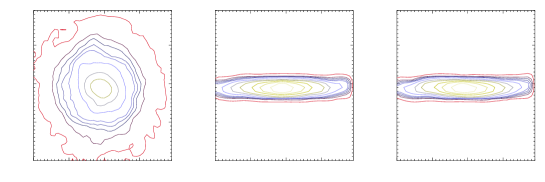
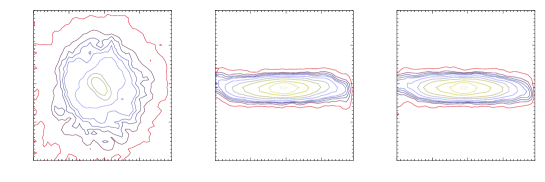
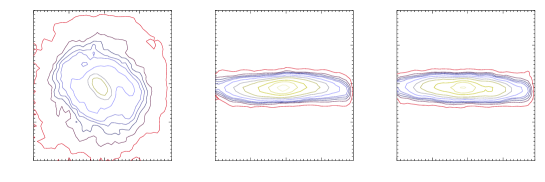
In this section we present the evolution of isodensity contours of the different cosmological simulations. From these contours we evaluate the final bar strengths which are reported in Table 3. Spatial resolution of the maps is always 0.5 physical kpc and the box size is 40 times the spatial resolution. Contours are computed at 11 fixed levels ranging from to in term of fraction of stars/spatial resolution within the total number–density of stars in the map. Following Curir & Mazzei (1999), we define, as a measure of the bar strength, the maximum value of the axial ratio, (Table 3): a strong bar corresponds to or to an ellipticity, , larger than 0.4.
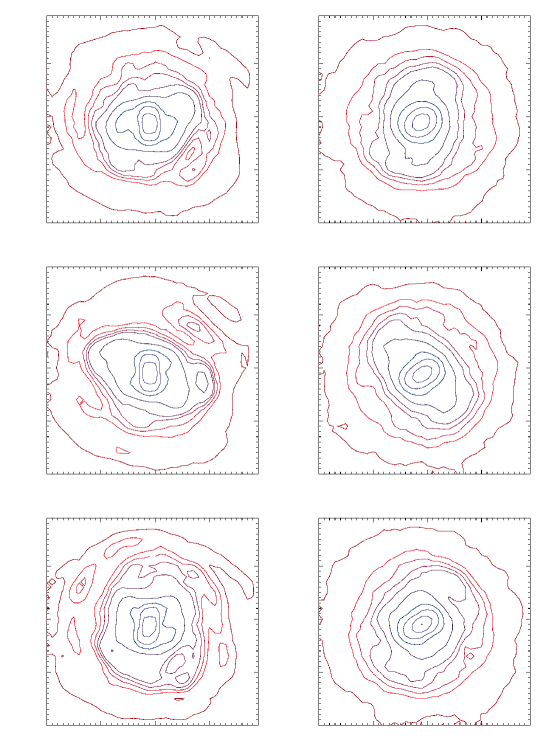
5.1 Morphologies of the stellar disk in the cosmological framework
Fig.s 2, 3 and 4 show the evolution of isodensity contours of simulations c1, c2 and c3. More massive cold disks suffer stronger lopsided instability (m=1) from the beginning of their evolution which degenerates in the m=2 instability, i.e. the bar instability, later on. The less massive cold disks, i. e. DM dominated cases, show a weaker m=1 instability. So bar instability develops before than in the corresponding more massive cases and the disk attempts to re-arrange before the end of the simulation.
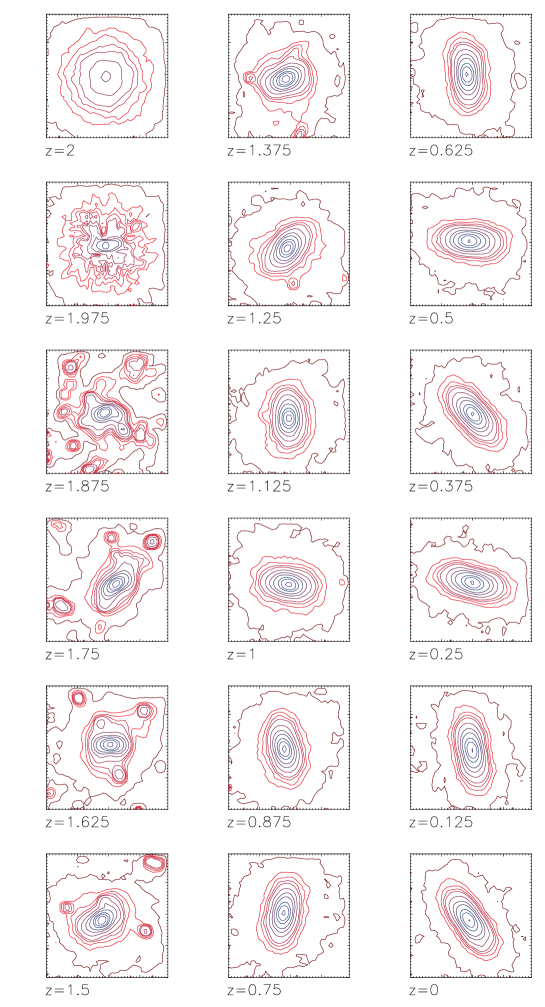
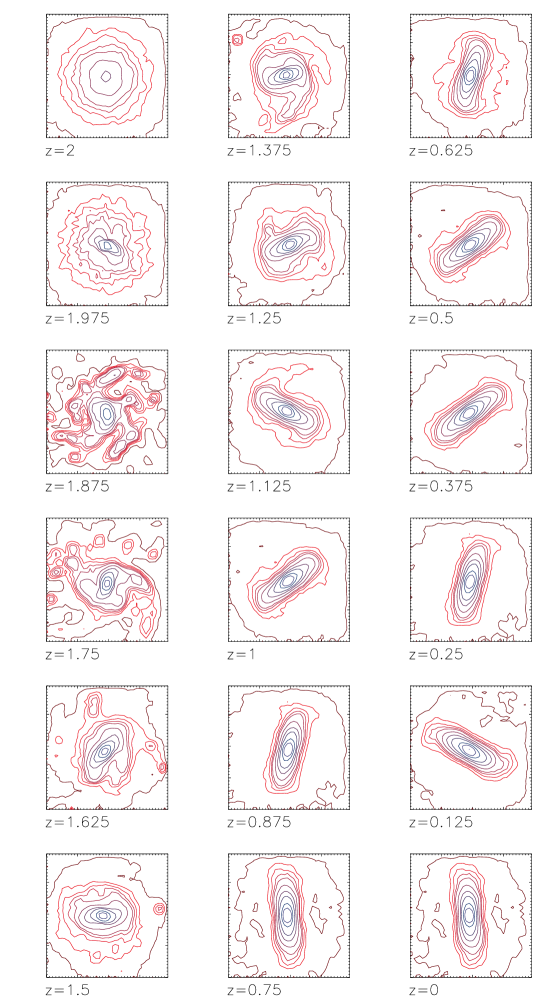
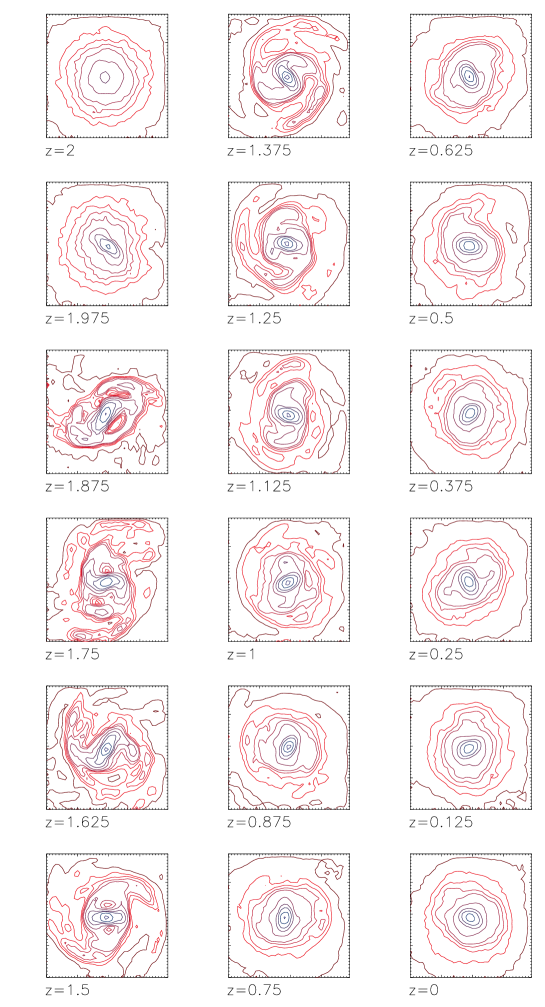
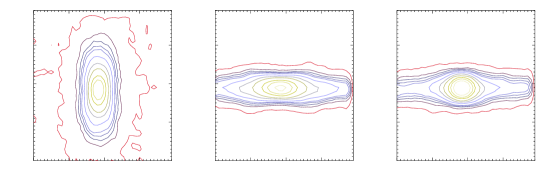
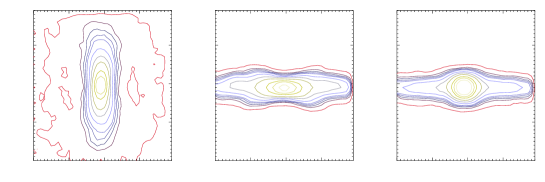
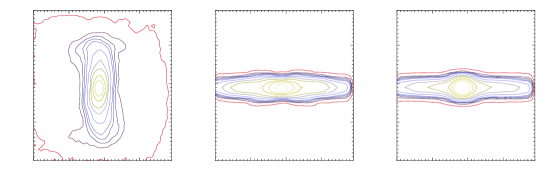
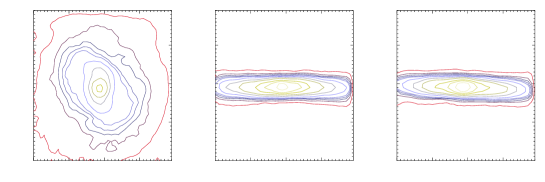
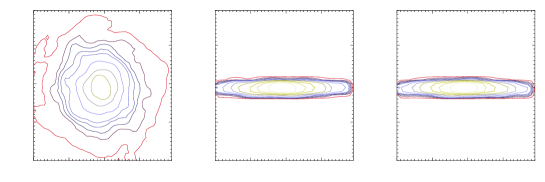
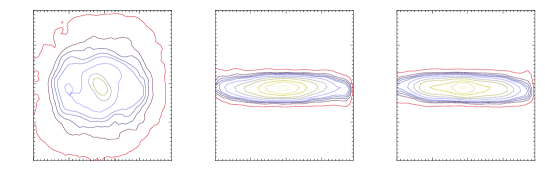
Fig.s 5 and 6 compare
face-on, side-on and edge-on isodensity contours of simulations c1 and c2 at .
We point out that
our cold intermediate mass case shows peanut-shape in the
side-on view and bulge-like contours in the edge-on view.
Therefore, in this case, a bulge could be mis-identified due to the bar feature.
However in the warm analogous case (Fig.7) this feature
does not arise. On the other hand, our more massive cold disk shows
edge-on isodensity contours with a less defined inner bulge and quite ticker
disk-like contours in the outer regions.
Its side-on view corresponds to a boxy image without an extreme peanut
feature.
Therefore the halo-to-disk ratio has a significant influence on the stellar
disk at ,
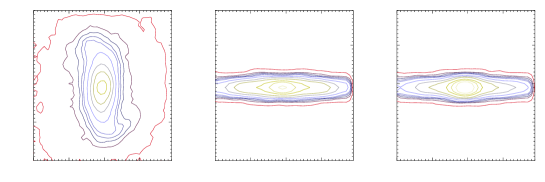
The Q parameter does not influence the final () morphologies of our
less massive disks, showing always disk-like shapes
(Fig.8).
This suggests to regard the cold intermediate mass case as a
peculiar one as far as
the peanut shape, is concerned. Such a feature has been
recognized by Combes & Sanders (1981) as caused by vertical orbital resonances.
Fig. 9
shows the isodensity contours of
simulation c4.
In this simulation the higher value of
the Q parameter stabilises the disk against
the local Jeans instability and the bar appears later than in
the corresponding cold case (simulation c2).


Therefore warmer disks are more stable against lopsided instability than the corresponding cold cases. Inside warmer and less massive disks, bars in bars, namely bar features at different isodensity levels, nested with twisting major axes, are also shown.
Isodensity contours of simulation c6 (Fig. 10), are quite similar to those of the corresponding simulation c2 (Fig. 6), which however starts at . Morphologies of both simulations c6 and c7 show thinner disks than simulations c4 and c5 given their shorter evolutionary time ( Gyr instead of Gyr).
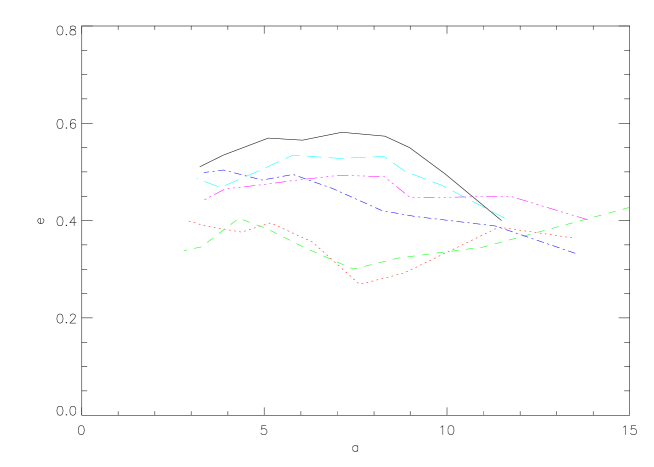
5.1.1 The bar strength
A variety of quantitative parameters have been suggested to evaluate the strength of the bar (see Buta & Block (2001) for a review). Firstly
we
quantify the growth of the bar instability studying the time evolution of
the ellipticity of our isodensity contours as a function of their major
axis, . The strength of the bar depends on the density contrast
accounted for, and it varies with the
distance from the centre; different choices can change its value but not the
trend outlined in Table 3.
Fig. 12 shows that in simulation c1 the strength of the bar increases
with time.
The length of the bar depends on the redshift too:
it grows until , and then shrinks to .
By comparing Fig. 13 and Fig. 14, which show the
ellipticity profiles of
simulations c2 and c4 respectively,
we point out that a greater Q, in intermediate mass disks, directly
reflects on the bar strength:
a stronger local gravitational instability, corresponding to a lower
Q value, triggers a stronger bar (Table 3).
For the less massive disks, Q is poorly influent
on the bar strength. In these cases, the local Jeans
instability has a small impact on the bar formation and evolution,
which is dominated instead by the dynamics of the DM halo.
The embedding redshift
does not have a major impact on the bar strength.
Its more important effect is the change of the bar length which can be
connected with the larger time span of simulation c2 (or c3) with respect to
simulation c6 (or c7).
Therefore, the halo evolution between and does not
seriously affect the disk instability, at least for the cold disk cases.
Combes & Sanders (1981) have defined the bar strength at radius R
by using the parameter:
where is
the maximum amplitude of tangential force at radius R and
is
the mean axisymmetric radial force, at the same R, derived from the
component of the gravitational potential.
We evaluated the components of the gravitational force on a
suitable two dimensional grid using the method described by Buta & Block (2001).
However information provided by such approach could be affected by
spiral arm torques and by some asymmetry in the bar itself (Buta & Block, 2001).
Nevertheless, we succeeded in monitoring the behaviour of such a parameter
for simulations c2, c4 and c6 (Fig. 15).
The cold cases end up with
almost the same value of even if their evolution starts from different
redshifts. The warmer case, instead, maintains a smaller
value of the bar strength during all the evolution, in agreement with results
obtained by using ellipticity parameter.
Table 3 shows that the final values (i.e. at ) of the
bar strength evaluated with both these methods are consistent.

According to the classification of Buta & Block (2001), we assign class 1 to our less massive barred galaxies if their evolution starts from (i.e. simulations c3 and c5), class 2 if they evolve from (i.e. simulation c7), and class 4 to all the other ones (i.e. simulations c1, c2, c4 and c6).
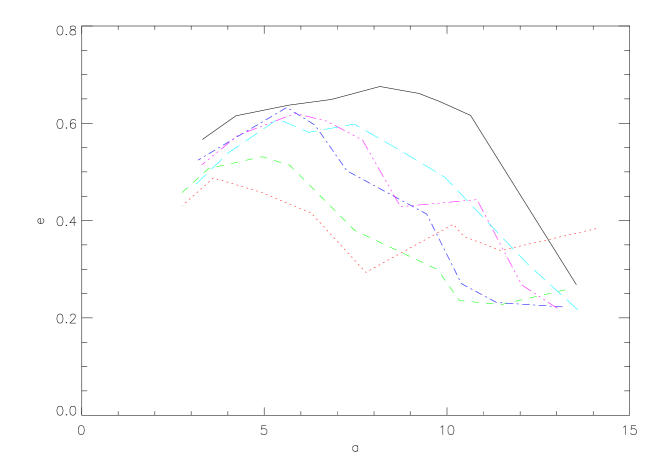
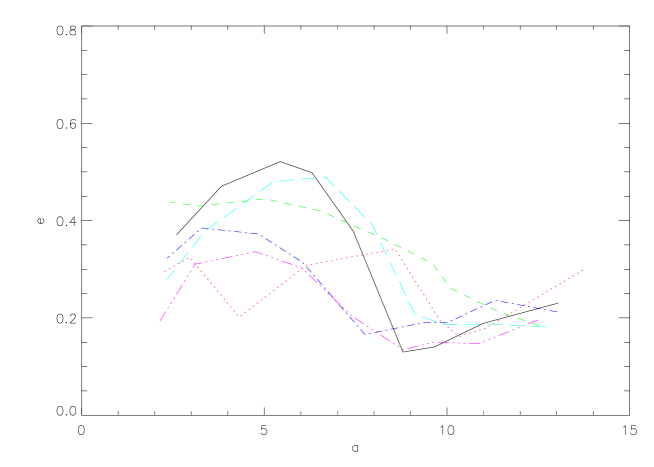
5.2 Comparisons with isolated cases
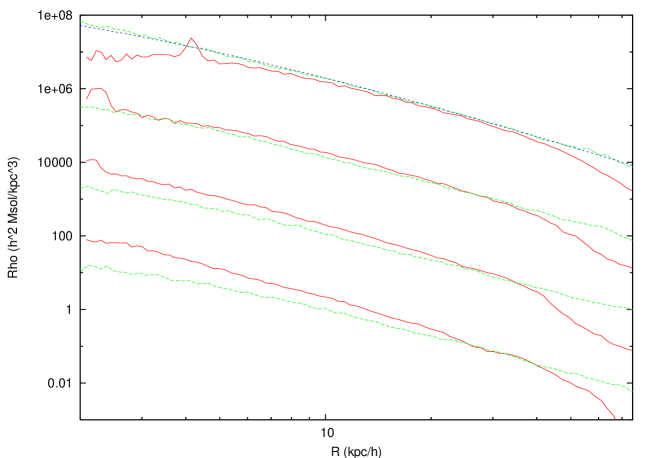
In order to investigate the role of the cosmological framework on the bar instability, we perform isolated simulations using the same halo and the same disk-to-halo mass ratios as in our cosmological setting (Sect. 4.2). We plug Q=1.5 as stability parameter in the disk. Our results show that the less massive disks do not show important differences as far as the bar feature is concerned: both the bar strength is the same and the same bar in bar features arise. In Fig. 16 we compare the halo radial density profiles of simulations c5 and i2. The density of the halo evolving in isolation becomes initially steeper, then it gradually flattens in the centre. In the outer regions, where the support of the cosmological environment is now lacking, the halo is slowly losing matter toward bigger scales and the profile is steadily steepening. On the other hand, the halo evolving in the cosmological environment, continues to accrete mass and small substructures from larger scales. Such accretion is still significant up to redshift at least (Fig. 1). Even if the dynamical evolution of the halo is different in cosmological and isolated simulations, the bar in the disk does form and evolves in a similar way. Thus we make the hypothesis that the common features of the two numerical experiments, namely the dynamical evolution and the anisotropy of the mass distribution, are the main engine for the bar instability.
The large scale cosmological environment becomes a second order effect
in the less massive disks. However the material accreting on the halo,
which has been cut off with the
halo segregation in a isolated system, plays a crucial role on the
degree of the disk instability if
the disk is not completely DM dominated.
We conclude that the use of isolated halos in gravitational equilibrium for
the study of the bar instability can give misleading results.
Taking into account our previous works in such isolated non cosmological framework
(Curir & Mazzei (1999); Mazzei & Curir (2001)), we derive that live unrelaxed halos correspond to the
most ”realistic” approach available to simplify the picture. Even if the
caveat outlined above cannot be forgotten,
the dynamical state of the halo, as outlined in our
works for the first time, plays a fundamental role in triggering and fuelling
such a instability.
In order to disentangle the role of the halo’s cosmological features like the prolate geometry and the spin on the instability, and to test the resolution effect, we produced an isolated halo with the same virial mass, radius and number of particles as our cosmological halo at , but with an isotropic NFW radial density profile. The procedure is described by Hernquist (1993). We used a rejection technique to sample the density profile and we then assign a velocity to each particle following a local Maxwellian velocity dispersion. We checked that after 7 Gyr of evolution, the radial density profile of the halo is not changed, except for the “evaporation” of some particles dwelling in its outskirts. We embedded then a disk having same mass, radius and Q as in our simulation c5 and c3. These two simulations are labelled in Table 2 and Table 3 as i5 and i4. According to the classical theory (Sect. 4.1), in simulation i5 the bar instability would be inhibited. We successfully reproduced this result with our live NFW halo (Fig. 17). Therefore the bar instability in simulation c5 is a genuine effect of the cosmological evolution and there is no evidence for a role of numerical noise. Moreover we note that in simulation i5 the reaction of the DM halo to the disk immersion has not triggered a long-lived bar instability (see Fig. 17).
6 Discussion
In this work we investigate the issue of the bar
instability in stellar exponential disks embedded in a DM halo
self-consistently evolving in a cosmological context.
We aim to disentangle the effect of few
well-defined disk parameters on this instability. We run also isolated simulations
using the same cosmological halo to analyse the effect of the whole cosmological framework
on the results. This paper is a re-visitation in such a cosmological scenario
of the work by Curir & Mazzei (1999).
To compare our results with such paper we use the ratio
in Table 2.
Critical threshold values against and instability for this
ratio have been calibrated also by Athanassoula et al. (1987). They claim for
a value around for the ratio to inhibit the lopsided instability (i.e. )
and around to suppress the swing amplification instability. Even if these values are derived in a very simply framework,
i.e. a isolated spherical and analytical DM halo, they are widely used
in literature (Bottema (2003); Elmegreen el al. (2003)),
therefore we will refer to this parameter to analyse our initial
condition, in addition to the Efstathiou et al. parameter introduced in
Sect. 4.1.
Looking at Table 2, we point out that simulations c1, c2, c4 and
c6, which develop strong final bars (Table 3), are
in the instability region for both these criteria.
In particular in simulation c1, which is below the
threshold of lopsided instability too (Athanassoula et al., 1987), the signatures of such a
instability are clearly shown in the
first phases of its evolution (Fig. 2).
On the other hand simulations c3, c5 and c7 are stable according to both the
criteria above. Nevertheless a weaker bar appears and lasts until
the end of such simulations.
Therefore the classical parameters are not good markers
of the onset
of the bar instability.
In particular, when the self-gravity of the disk is negligible,
i.e. the disk is DM dominated, the halo structure generated by the cosmology
plays a crucial role in triggering such a instability.
Our findings agree with results of
Mayer & Wadsley (2004) in the isolated framework. They found that stellar systems with disk-to-halo mass
ratios 0.1 become bar unstable, regardless of the halo concentration
and the Q value, inside
halos built up with suitable structural parameters derived
from -CDM cosmology, like their circular velocity at , , the NFW density profile and the spin parameter
(0.06 and 0.1). We point out that Mayer & Wadsley (2004) do not take into account
cosmological evolution for their halos.
With the same disk-to-halo mass ratio Athanassoula (2002) found
that such a instability is totally inhibited
inside isotropic, non rotating halos with different density profiles
(eq. 1 of Athanassoula, 2002),
in agreement with the result of our simulation i5
(Sect. 7).
This last result, together with those of simulations performed with different
number of disk particles and with different softening length (Sect. 7)
suggests that the development of long-living bars seen in our simulations is a
genuine physical effect and not a numerical artifact.
Bar instability in the DM dominated cases is strongly affected by the
halo models. Moreover structural details of the halo, related to the
cosmological framework, drive morphological features
of the stellar disk. Mayer & Wadsley (2004) found indeed a central bulge
after 7 Gyr which does not appear in our corresponding case. However such a bulge
shows up in our intermediate self-gravitating case (simulation i1 in Table 2).
This feature is also emphasised
in the work by Athanassoula & Misiriotis (2002)) and Athanassoula (2003)
for a disk-to-halo mass ratio 0.2, using the same halo presented in Athanassoula (2002) with
the higher halo concentration.
Our results here are in good qualitative agreement
with those by Curir & Mazzei (1999) concerning their simulations 3, 4, 7 and 8, with the same
disk-to-halo mass ratio as in simulation c1 of Table 2, and also
with their simulations 5 and 6
which correspond to a disk-to-halo mass ratio 0.2.
However, we remark that their simulations 3 and 4
correspond to a relaxed halo, whereas
5, 6, 7 and 8
to a unrelaxed halo. In particular the initial values of their simulations
5 and 6 are respectively above and very near the 2.2 threshold value of bar instability, nevertheless the bar
lasts until the end of their simulations ( Gyr).
Their simulations 1 and 2, which correspond to a
relaxed dynamical state of a halo with disk-to-halo mass ratio 0.2, emphasise however a very different behaviour as far as the
bar instability is concerned: the bar forms initially but degenerates then in a
dense nucleus.
Thus we argue that an unrelaxed dynamical state for
isolated halo systems is more suitable to mimic a realistic
“cosmological” halo, characterised by evolution, substructure and in-fall.
This finding is important, since a vast
majority of the work on the bar instability assumes a
gravitationally stable halo.
7 Conclusions
In this work we present the first attempt to analyse the growth of bar instability in a fully consistent cosmological framework. We investigate such a issue in stellar disks embedded in a DM halo self-consistently evolving in a cosmological context. We aim to disentangle the effect of few well-defined disk parameters on this instability. We run also isolated simulations using the same cosmological halo to analyse the effect of the cosmological framework. Our results show that:
-
•
stellar disks of different properties, i.e. mass and Q parameter, embedded in the same halo and evolving in a fully consistent cosmological scenario, develop long living bars lasting up to redshift 0.
-
•
The classical criteria to account for bar instability cannot be validated in a cosmological framework where a bar always develops, due the halo evolution.
-
•
The strength of the bar at is weakly depending on the Q parameter, for a given disk mass. However for the same disk-to-halo mass ratio, colder disks show stronger and longer bars. Thus the less massive warm disks entail the weakest bars, moreover bar in bar is a common feature in their face-on morphology.
-
•
Simulations performed embedding different disks in the same halo, extracted at from the cosmological framework, show that the effects of the large scale structures are negligible in the less massive, DM dominated disks.
Moreover by comparing results in this work with our previous paper (Curir & Mazzei, 1999),
we point out that live unrelaxed halos are the more suitable approach to mimic
cosmological halos and to analyse bar instability in the less massive disks.
The mass anisotropy and the dynamical evolution of the DM halo have a crucial
effect in enhancing and fuelling the bar instability, also in cases where ad hoc halo models provided stability predictions,
(e.g. Athanassoula, 2003).
The large–scale effects, such as the continuous matter infall on the halo and
the infall of substructures during the whole time–span of the
simulation, influence the bar strength and the details of its structure.
Acknowledgements
Simulations have been performed on the CINECA IBM SP4 computer (Bo, Italy), thanks
to the INAF-CINECA grants cnato43a/inato003 “Evolution of disk
galaxies in cosmological contexts”, and on the Linux PC Cluster of
the Osservatorio Astronomico di Torino. We wish to thank for useful
discussions: T. Abel, S. Bonometto, A. Burkert, E. D’Onghia,
F. Governato, A. Klypin & V. Springel.
Appendix A Numerical tests
A.1 Initialisation procedure
While the disk is built to be in equilibrium with the gravitational potential of the halo (Sect. 2), the opposite is not true. This means that the halo does contract when we embed the disk, the amount of such a contraction depending on the mass of the disk. This effect roughly mimics the so–called “adiabatic contraction” (e.g Jesseit et al., 2002) of a DM halo in a self–consistent galaxy formation scenario, when the gas firstly collapses to form a disk. Nevertheless, in our approach the disk appears suddenly and also contracts in reaction to the augmented DM concentration. This double effect could trigger a bar instability. Therefore we modified the code to allow for the presence of a frozen stellar component. Its particles do produce a gravitational force on the DM ones, but they are not subjected to any force. We built up a isolated frozen disk+halo system as described above (Sect. 4.2). Each particle of the disk is initially massless; such a mass increases linearly with the time until a final disk-to-halo mass ratio . The system has been integrated in physical coordinates until Gyr, which corresponds to (Sect. 4.2). After this period, a new disk having the same mass ratio is embedded, in equilibrium with the gravitational potential of the halo. We evolved this system up to the final time, Gyr. This simulation is presented in Table 2 and Table 3 as simulation i3. The presence of a very strong bar is seen during all the evolution. In Fig. 18 we compare the evolution of the maximum bar ellipticity and of the corresponding semi-major axis length for simulation i3 and i1, in which the disk was added impulsively.

We conclude that the
reaction of the DM halo to the disk immersion, and the following
counter-reaction
of the disk to the increased halo concentration, are not the most important
ingredient in producing the long–lasting bar we observe.
A.2 The mass resolution
Using a fixed number of star particles,
their mass varies by a factor of 10 in our simulations (Table
2). This can bring to a
different numerical scatter between star and DM particles.
Problems connected with the resolution could be the
occurrence of a bar instability triggered by numerical noise, which causes a poor
sampling of the density field in the central part of the halo, and
the numerical heating, which also depends on the number of particles involved
(Lacey & Ostriker, 1985), could artificially dump the bar instability.
Therefore we run isolated tests with different number of star
particles (= 9400,18800, 56000, 560000). We outline that results are slightly
depending on the mass resolution of disk particles (Fig. 19).
In particular also the disk with 10 times more particles than our fiducial
case keeps the bar feature, showing a more defined bar structure due to
the higher resolution.
We conclude that,
even if there is a slight dependence of the details of the bar structure on
the mass resolution of star particles, our main result, i.e. the
occurrence of a long lasting bar instability even with this disk-to-halo mass
ratio which would be classically stable, it is not caused by a
resolution effect.
We are currently performing new cosmological simulations (as in Sect. 4.1)
with higher mass resolution:
a new halo consisting of 282134 particles at (compare with Table 1)
and a stellar disk endowed with 280000 particles. The disk-to-halo mass
ratio, defined as in Sect. 4, is . The halo has a spin
=0.026, a viral mass of M⊙ at and a “quiet” mass accretion history, similar to
that of the DM halo used in this work.
Using such halo, evolving in a different cosmological environment,
we aim not only to improve the mass resolution of simulations in the
cosmological framework but also
to check how our results are depending on the properties of the halo.
Fig. 20 shows that a bar is present
for such a very light disk also with the higher resolution.


A.3 The softening length
Our fiducial softening is similar to the one suggested by Power et al. (2003) in their numerical convergence analysis of
the radial density profiles of DM halos. Accounting for our number of
particles, they suggest a minimum softening length:
, to prevent strong
discreteness effects. From Table 1, this value corresponds
to kpc at and
kpc at .
Thus we run three simulations of the
same isolated disk+halo system as in simulation i2 using three different
softening lengths: 0.36, 0.5 and
0.65 kpc. In Fig.21 we show the isodensity contours
at times corresponding to redshifts and in the cosmological
framework. The bar shapes and
strengths are similar at , where comparable inner bars (as given by two inner
levels) are shown. We note the same similarities at with the exception of
simulation with lower softening length, which shows more round inner contours.
We conclude
that, as far as the bar instability is concerned, varying the stellar
softening within such range has not a significant effect on the
results.
A.4 The disk radius
The last simulation we performed was devoted to explore if the radius of the stellar disk can affect the triggering of bar instability. Therefore we carried out a simulation with disk parameters as in simulation i1, but with both disk radius and scale length smaller by a factor of two. Results do not differ from the comparison case: the system shows a definite bar instability developing after 0.25 Gyr and lasting until the end of the simulation.
References
- Abadi el al. (2003) Abadi, M.G., Navarro, J.F., Steinmetz, M., Eke, V.R. 2003, ApJ 591, 499
- Athanassoula (2002) Athanassoula, E. 2002, in: Disks of Galaxies: Kinematics, Dynamics and Perturbations, ASP Conf. series 275, p. 141
- Athanassoula (2003) Athanassoula, E. 2003, MNRAS 341,1179
- Athanassoula et al. (1987) Athanassoula, E., Bosma, A., Papaioannou ,S. 1987 A&A, 179,23
- Athanassoula & Misiriotis (2002) Athanassoula, A., Misiriotis, A. 2002, MNRAS, 330, 35
- Binney & Tremaine (1987) Binney, J., Tremaine, S. 1987, Galactic Dynamics,(Princeton, NJ: Princeton Series in Astrophysics)
- Bottema (2003) Bottema, R. 2003, MNRAS 344, 358
- Bullock et al. (2001) Bullock, J. S., Dekel, A., Kolatt, T.S., et al. 2001, ApJ, 555,240
- Buta & Block (2001) Buta, R., Block, D. L. 2001, ApJ 550,243
- Combes & Sanders (1981) Combes, F., Sanders, R.H. 1981, A&A, 164,173
- Curir & Mazzei (1999) Curir, A., Mazzei, P. 1999 A&A, 352, 103
- Debattista & Sellwood (2000) Debattista, V.P., Sellwood, J.A. 2000, ApJ, 543, 704
- Efstathiou et al. (1982) Efstathiou, G., Lake, G., Negroponte, J. 1982, MNRAS 199, 1069
- Elmegreen el al. (2003) Elmegreen, B.G., Elmegreen, D.B., Leitner, S.M. 2003, ApJ 590, 27
- Ettori (2003) Ettori, S. 2003, MNRAS, 344L, 13
- Governato et al. (2004) Governato F., Mayer, L., Wadsley, J., et al. 2004, ApJ, 607, 688
- Hernquist (1993) Hernquist, L. 1993, ApJS, 86,389
- Jesseit et al. (2002) Jesseit, R., Thorsten, N., Burkert, A. 2002, ApJ, 571, 89
- Klypin et al. (2001) Klypin, A., Kravtsov, A., Bullock, J., Primack, J. 2001, ApJ, 554, 903
- Kravtsov (1999) Kravtsov, A. 1999, Ph.D Thesis
- Kravtsov et al. (1997) Kravtsov, A., Klypin, A., Khokhlov, A. 1997, ApJ, 111, 73
- Lacey & Ostriker (1985) Lacey, C.G., Ostriker J. P. 1985, ApJ, 299, 633
- Maller et al. (2002) Maller, A.H., Dekel, A., Somerville, R. 2002, MNRAS, 329, 423
- Mayer & Wadsley (2004) Mayer, L., Wadsley, J. 2004, MNRAS, 347,277
- Mazzei (2003) Mazzei P. 2003, in : Rec. Res. Devel. Astronomy and Astrophysics, 1, 457, Pandalai ed. (Kerala, India: Research Signpost)
- Mazzei & Curir (2001) Mazzei, P., Curir, A. 2001, A&A, 372, 803
- Mazzei & Curir (2003) Mazzei, P., Curir, A. 2003, ApJ, 591,784
- Navarro el al. (1996) Navarro, J.F., Frenk, C., White S.D.M. 1996, ApJ, 462, 563
- Navarro et al. (1997) Navarro, J.F., Frenk, C., White, S.D.M. 1997, ApJ, 490, 493
- Navarro et al. (2000) Navarro, J.F., Steinmetz, M. 2000, ApJ, 538, 477
- Patsis & Athanassoula (2000) Patsis, P. A., Athanassoula, E. 2000, A&A, 358, 45
- Press et al. (1986) Press, W.H., Flannery, B P., Teuloski, S.A., et al. 1986, Numerical Recipes, (Cambridge, UK: Cambridge University Press)
- Power et al. (2003) Power, C., Navarro, J.F., Jenkins, A., et al.2003, MNNRAS,338, 14
- Robertson et al. (2004) Robertson, B., Yoshida, N., Springel V., Hernquist, L. 2004, ApJ, 606, 32
- Sellwood (1981) Sellwood, J.A. 1981, A&A, 99, 362
- Sellwood and Evans (2001) Sellwood, J.A., Evans, N.W. 2001, ApJ, 546, 176
- Springel et al. (2001) Springel, V., Yoshida, N., White, S.D.M. 2001, New Astronomy, 6, 79
- Stadel (2001) Stadel 2001, Ph.D. Thesis, see http://www-hpcc.astro.washington.edu/tools
- Vitvitska (2002) Vitvitska, M., Klypin, A.A., Kravtsov, A.V., Wechsler, R.H., Primack, J.R., Bullock, J.S. 2002, ApJ, 581, 799
- Wechsler et al. (2002) Wechsler, R.H., Bullock, J.S., Primack, J.R., et al. 2002, ApJ, 568, 52