Observations on the Formation of Massive Stars by Accretion
Abstract
Observations of the H66 recombination line from the ionized gas in the cluster of newly formed massive stars, G10.6–0.4, show that most of the continuum emission derives from the dense gas in an ionized accretion flow that forms an ionized disk or torus around a group of stars in the center of the cluster. The inward motion observed in the accretion flow suggests that despite the equivalent luminosity and ionizing radiation of several O stars, neither radiation pressure nor thermal pressure has reversed the accretion flow. The observations indicate why the radiation pressure of the stars and the thermal pressure of the HII region are not effective in reversing the accretion flow. The observed rate of the accretion flow, M⊙ yr-1, is sufficient to form massive stars within the time scale imposed by their short main sequence lifetimes. A simple model of disk accretion relates quenched HII regions, trapped hypercompact HII regions, and photo-evaporating disks in an evolutionary sequence
Introduction
The formation of massive stars by the same accretion processes thought to form low mass stars appears problematic because the intense radiation pressure from the star and the thermal pressure from the HII region around the star may be sufficient to reverse the accretion flow and prevent matter from reaching the star. Simple scaling arguments in purely spherical geometry first proposed decades ago indicate that the luminosity to mass ratio of stars is sufficient to limit the growth of stars by accretion to about 8 M⊙. How then does accretion proceed through the pressure of the intense radiation field to form higher mass stars? A second limitation on stellar mass is posed by the ionizing radiation of early type stars. Stars of type B and earlier are hot enough to maintain an HII region around the star. The temperature of this ionized gas is two orders of magnitude greater than that of the surrounding molecular gas with a comparable increase in pressure. How does accretion proceed against the outward pressure of the HII region? Finally, does the short main sequence lifetime of massive stars, a lifetime that decreases with increasing stellar mass, impose a third limitation? For a star to gain the mass of an early O star before it evolves off the main sequence may require a very high accretion rate, M⊙ yr-1. Since these questions were first posed, more detailed theoretical investigations have found a number of ways for accretion to proceed past these limits, and observational investigations have found indirect evidence for the formation of massive stars by accretion, for example bipolar outflows and disk-like structures around stars as early as type B. Nonetheless, the question of how massive stars form by accretion remains. While the several theoretical hypotheses appear sound enough, and the previous observational evidence strongly implicates accretion, the observations have not so far demonstrated how stars solve the problem of radiation and thermal pressure. Here we show for the first time observations of the formation of massive stars with sufficient detail to see how the accretion flow is structured to pass through the radiation and thermal pressures. These new observations show that, exactly as suggested by previous theory, non-spherical geometry and the high density and momentum of massive accretion flows are the significant factors.
1 Theoretical Backround
1.1 The Precursors to Massive Stars
Early calculations of stellar evolution indicated that massive stars have very short pre-main sequence (PMS) lifetimes. For example, Iben (1965) estimated that a 15 M⊙ star has a PMS lifetime of yrs versus yrs for a 1.0 M⊙ star. The short time scale suggests that unless a massive star forms with a very high accretion rate, M⊙ yr-1, the star will begin burning hydrogen while still in the accretion phase. Iben’s calculations were for stars of a fixed mass and for a maximum mass of 15 M⊙. Stahler, Shu & Taam (1980, 1981a, 1981b) and Palla and Stahler (1993) calculated the PMS evolution of stars growing by accretion and confirmed that stars greater than several have no PMS phase. Beech & Mitalas (1994), Norberg & Maeder (2000), and Behrend & Maeder (2001), extended these results for stars up to 60 M⊙ for various accretion rates.
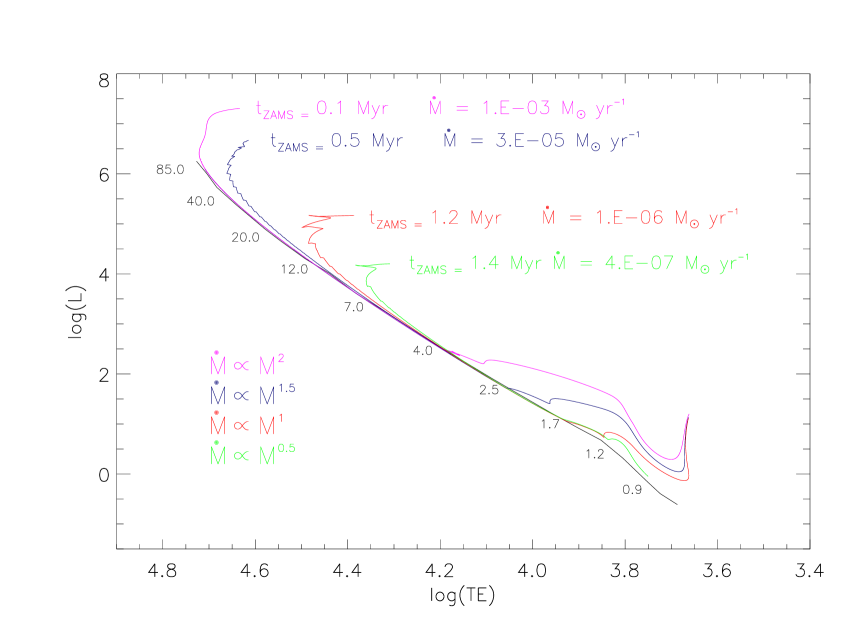
An example calculation (provided by Alessandro Chieffe based on the models in Chieffi, Staniero, & Salaris 1995) of the evolution of an accreting star starting from an initial mass of 1.0 M⊙ is shown in figure 1. The evolutionary tracks for different accretion rates intersect the main sequence line at about 4 M⊙ and follow that line as the star gains mass. These tracks indicate that a star that is gaining mass by accretion would appear little different in luminosity and temperature from a main sequence star of fixed mass. Thus the stellar structure calculations suggest that if massive stars form by accretion then the precursors to massive stars would not resemble protostars in a PMS phase. Rather, the precursors to massive stars would appear similar to main sequence A or B stars except that because of the ongoing accretion, they would likely have the characteristics associated with accretion. For example, they would be deeply embedded, show evidence for disks and bipolar outflows and possibly show maser emission from molecular gas excited by the stellar radiation.
1.2 Radiation Pressure
The simplest comparison between the outward force of the radiation pressure and the inward force of gravitational attraction, indicates that stars of mass 8M⊙ have sufficient luminosity to counter the gravitational attraction driving accretion (e.g. Beech & Mitalas 1994; Larson & Starrfield 1971; Yorke & Krugel 1977). Here is the dust opacity, the luminosity, the radius that cancels out of the equation, the speed of light, and the gravitational constant. Although this would seem to imply that stars of mass greater than 8 M⊙ could not form by accretion, the comparison is too naive. Kahn (1974) and Wolfire & Cassinelli (1987) showed that if the dust is destroyed out to some radius from the star, and if the accretion flow has sufficient momentum to push the dust grains into the zone of destruction, the accretion flow will be pushed into the dust free zone that is largely transparent to radiation. Nakano (1989) showed that the flattening of the accretion flow, as would be caused by rotation or magnetic fields, would allow thermal re-radiation from the dust grains to escape out the poles thus reducing the radiation pressure behind the ionization front. The same reduction in pressure will occur if the accretion flow is clumpy and the secondary radiation emitted by the dust can escape between the clumps. Jijina & Adams (1996) suggested that the radiation pressure in a rotating accretion flow would first cause the gas to fall onto the accretion disk at larger radii rather than immediately reversing the flow as in the case of spherical accretion. These several more detailed calculations suggest that radiation pressure might be a limiting factor in high mass star formation, but the limiting mass should be larger than 8 M⊙.
1.3 Thermal Pressure
While the problem posed by the radiation pressure has received more attention in the literature, the thermal pressure of ionized gas around the star is also capable of reversing the accretion flow (Nakano, Hasagawa & Norman 1995). All stars appear to form within dense clouds of molecular gas. Stars of spectral type B and earlier produce significant radiation shortward of the Lyman continuum limit that will ionize the molecular gas and form an HII region around the star. Because the temperature of the ionized gas is on the order of K while the temperature of the molecular gas is of order 100 K, the pressure of the ionized gas will be 100 times greater than in the surrounding molecular gas, and the HII region should expand outward reversing the accretion flow. This might imply that stars of spectral type B would be unable to grow by accretion once an HII region formed around the star. Keto (2002b) suggested that the increased pressure of the ionized gas would be irrelevant to the accretion flow as long as the zone of ionization were within the sonic radius where the escape speed from the star exceeded the sound speed of the ionized gas. This would occur if the gas in the accretion flow were dense enough that the radius of ionization equilibrium, where recombination balances the ionization, were smaller than the sonic radius.
1.4 The short main sequence lifetime
Even without the problems posed by the radiation pressure and thermal pressure, the short main sequence lifetime of high mass stars compared with the accretion timescale might be the limiting factor in high mass star formation (Nakano 1989, Bernasconi & Maeder 1996, Behrend & Maeder 2001). If the accretion rate is not high enough to supply sufficient fresh hydrogen to dilute the helium ash of hydrogen burning, then the star will evolve off the main sequence where stellar pulsations and the eventual ejection of the star’s envelope will disrupt and end the accretion onto the star. Figure 1 shows that the accretion rate has to be quite high M⊙ yr-1 to keep a growing star on the main sequence long enough to reach the mass of an O star. Because the main sequence lifetime is a decreasing function of stellar mass as indicated in figure 1, the accretion rate might have to increase as some function of the mass of the star. There is observational evidence that the accretion rate depends on the stellar mass from observations of both high and low mass stars (Churchwell 1998; Henning et al. 2000; Calvet et al. 2004).
1.5 Observational indications of accretion
A number of previous observations provide indirect evidence for the formation of high mass stars by accretion. Accretion flows toward massive stars have been observed in several high mass star forming regions (Ho & Haschick 1986; Keto, Ho, & Haschick 1987, 1988; Young, Keto, & Ho 1998; Zhang et al. 1998, 2002; Kumar et al. 2002, 2003). Massive accretion disks around high mass stars have been detected by both imaging and spectroscopic means (Zhang et al. 2002; Sandell et al. 2003; Olmi et al. 2003; Beltran et al. 2004; Chini et al. 2004). Evidence for bipolar outflows too massive to be powered by low mass stars also indicates massive accretion flows (Shepherd & Churchwell 1996; Beuther et al. 2002). Observations of stellar photospheres and bipolar outflows also indicate that the accretion rates depend on the stellar mass (Churchwell 1998; Henning et al. 2000; Calvet et al. 2004), as suggested by the theory of continuing accretion. Radio frequency spectral energy distributions observed from hypercompact HII regions are consistent with ionized accretion flows onto massive stars as pointed out by van der Tak & Menten (2005) and inferred retrospectively in the observations of Hofner et al. (1996) and Testi et al. (2000)
However, observational evidence that directly demonstrates the validity of the several theoretical hypothesis as to exactly how high mass stars form by accretion has been lacking. There are three principle difficulties in observing the formation of high mass stars: distance, extinction, and the short time scale for formation. Because most of the massive stars, with a few exceptions such as the Orion star forming region, are at kpc distances, it is difficult to obtain the sensitivity and angular resolution to measure the properties of accretion flows around individual high mass stars. Secondly, massive stars form within very dense molecular clouds with enormous extinctions through the near infra-red and even the millimeter radio. Third, because of the exceptionally short time scales, not many examples of massive O stars in formation would be expected.
These observational difficulties can be overcome. Centimeter wavelength radio waves are not much affected by dust emission and absorption and can be used to see into the densest molecular clouds. Even at large distances, accretion flows onto small groups of stars, with a higher combined mass, , than single stars, have accretion flows with velocities, typically proportional to , and size scales, proportional to , for sound speed , that are large enough to resolve with radio interferometers.
There is a second reason to target accretion flows onto small groups of massive stars. Formation in groups of a few stars may be the common mode in high mass star formation. The scalings above suggest that if massive stars form by accretion and the accretion rate depends on the stellar mass, then massive stars are more likely to form in binaries or small groups that can generate the massive accretion flows needed to overcome radiation and thermal pressure and the short main sequence time scale. There is also indirect observational evidence for this proposition. For example, observations by Okamoto et al. (2003) show that a number of HII regions contain several stars each. Prebisch et al. (2001) and Mermilliod & Garcia (2001) observed that massive stars form in binaries and small groups of three or four at a greater frequency than do low mass stars.
Although accretion flows onto groups of stars may be different than onto single stars, these flows may be characteristic of the accretion flows in high mass star formation. Thus we chose as a target for our observations the accretion flow onto a small group of stars at the center of the G10.6–0.4 cluster (Ho & Haschick 1986, Keto 2002a, Sollins et al. 2005).
2 Observations
The new observations were made with the Very Large Array (VLA) 111The National Radio Astronomy Observatory is a facility of the National Science Foundation operated under cooperative agreement by Associated Universities, Inc. radio interferometer on February 23, 2002. The array was in the ”A” configuration with baselines up to 36 km leading to an angular resolution of arcsec. The correlator was configured for a bandpass of 12.5 MHz with 64 channels of 195.31 kHz or 2.62 kms-1 at the observing frequency of the H66 recombination line of hydrogen at 22.36416932 GHz. The data were combined with H66 observations made in the D configuration and described separately in Keto (2002a) and images and spectra made with the combined data set. The sum of the channels off the spectral line yields a map of the continuum emission that when subtracted from the total emission yields a map of the H66 spectra. The noise level in the data is 0.7 mJy/beam per channel. After subtraction of the continuum flux, the noise level in the maps of line emission was 1.2 mJy/beam per channel.
2.1 The Accretion Flow
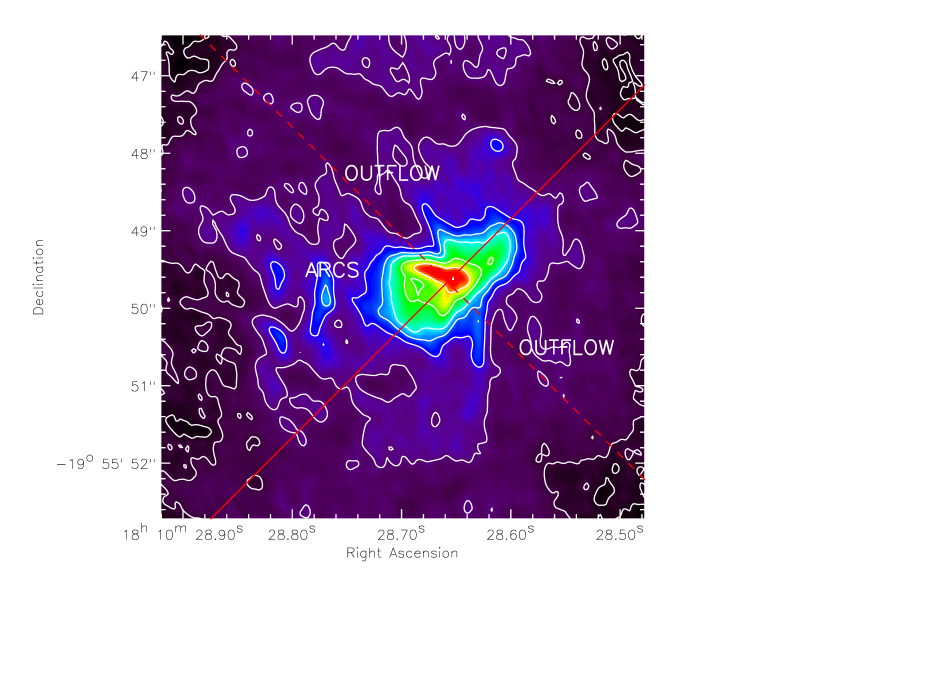
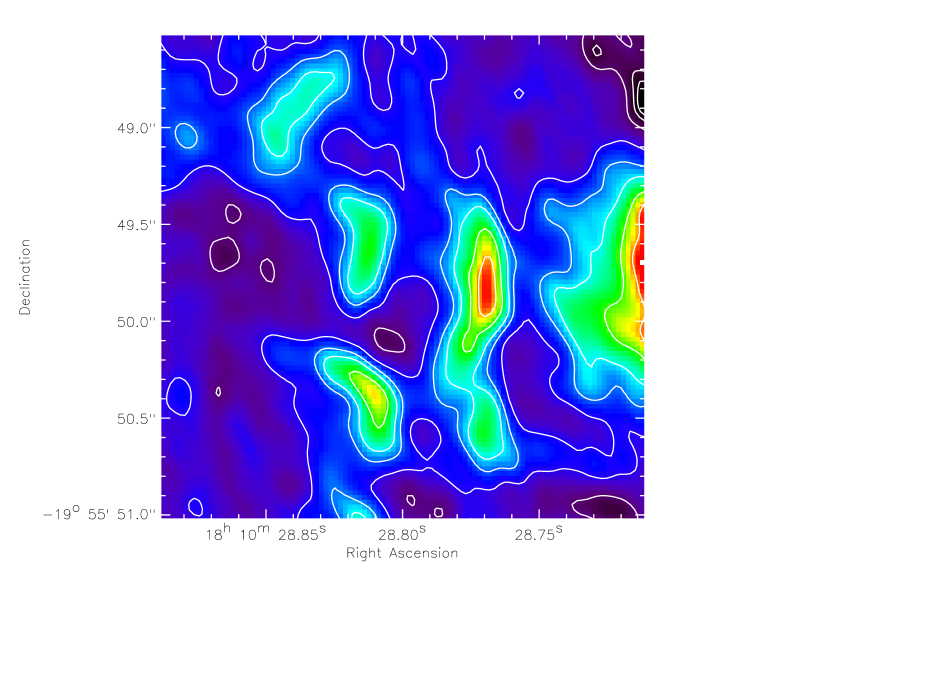
Figures 2 and 3 show the continuum emission around the group of stars. The plane of the accretion disk is indicated in figure 2 by the solid line at 45∘ across the figure. The orientation of a high velocity outflow perpendicular to the disk is shown by the dotted line. Figure 3 is a detail of photo-ionized arcs, previously identified in Sollins et al. (2005) to the left of the bright HII region. The location is marked as ”ARCS” in figure 2.
The bright continuum emission seen in the new high angular resolution observations of G10.6–0.4 is identified as a dense accretion disk or torus rather than a classical ionization bounded HII region by the orientation of the emission with respect to the accretion flow and by the presence of the nearby photo-ionized arcs. Previous observations (Keto 1990, Sollins et al. 2005) of molecular emission and absorption in G10.6–0.4 have mapped the structure of the molecular accretion flow onto the stars and identified the axis of rotation as projected onto a northeast-southwest direction (dashed line, figure 2). If the continuum emission were from a classical HII region with a boundary defined by equilibrium between ionization and recombination, the HII region would be extended down the density gradient in the direction of the lower density gas, perpendicular to the rotational flattening of the accretion flow. In this case the continuum emission would have an elliptical shape elongated in the direction of the rotation axis. However, the observations, figure 2, show that the continuum emission is seen elongated along the equatorial plane following the densest gas of the accretion flow.
The absence of an ionization boundary around the bright continuum emission is also indicated by the photo-ionized arcs most prominently on the southeast (left) side of the central ellipse, figures 2 and 3. The orientation of the photo-ionized arcs with their ionization fronts facing the stars indicates that these outlying clumps of high density molecular gas receive ionizing radiation from the stars. This would not be possible if there were an ionization front at the boundary of the bright continuum emission. The gas between the bright continuum ellipse and the photo-ionized arcs must be ionized to allow the stellar radiation to pass and reach the arcs, and the low continuum brightness between the arcs and the disk confirms that this gas has a lower density. Thus the apparent boundary of the bright continuum ellipse is set by the outwardly decreasing density of the ionized gas and the reduction in emitted continuum flux as the emission measure, , rather than by an ionization boundary.
While the bright continuum emission indicates the morphology of the densest ionized gas around the group of stars, the H66 line provides the information on the velocities within the ionized gas to identify this dense gas as an accretion disk or torus. In our data we are also able to identify two other components of the accretion flow, infall in a quasi-spherical envelope and a high velocity outflow aligned with the rotation axis.
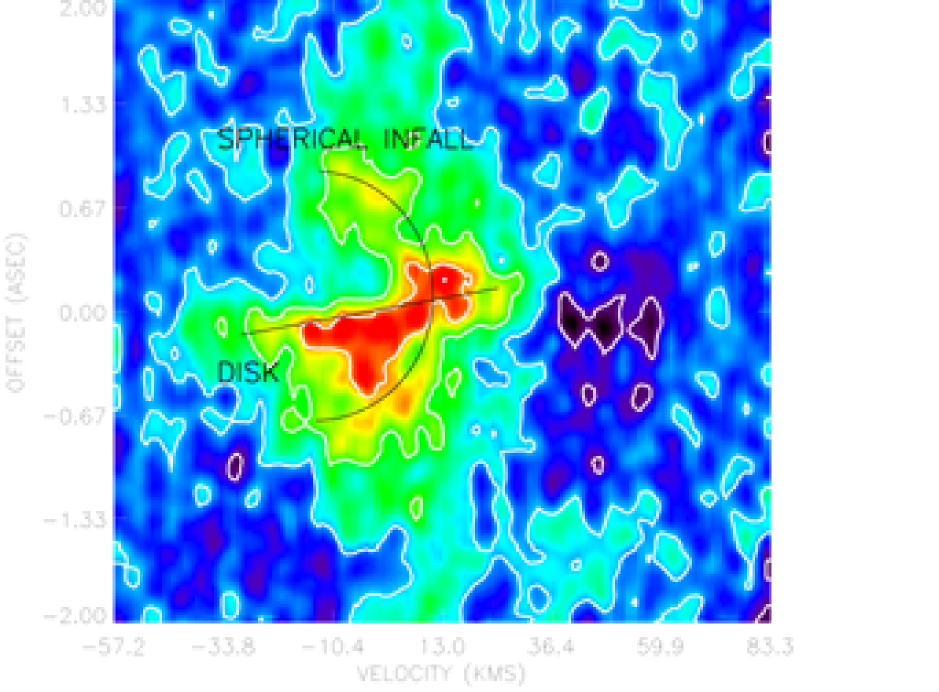
Figure 4 shows the trend of velocity with position in the direction along the equatorial plane of the disk, at the position marked by the solid line in figure 4. The backward ”C” of emission seen in figure 4 is characteristic of radial or spherical infall. The ”C” structure arises because on lines of sight progressively closer toward the center of the infall, the velocity of the emission is more red-shifted since the velocity of the radial infall is projected more directly along the line of sight. The ”C” shape is characteristic of emission from the front hemisphere of a spherical inflow in which the velocities are directed radially inward. Emission from the back hemisphere would produce a corresponding ”C” in the opposite orientation. Optical depth effects are likely responsible for the weakness of the emission from the back of the flow (Keto 2002a). The velocity of the quasi-spherical infall in the ionized envelope is indicated at kms-1 and the rotation at kms-1.
More rapid rotation of the accretion disk at a smaller scale toward the center of the group of stars is indicated by the breadth of the emission lines in the center of figure 4 and by the linear gradient in line center velocities across the figure, along the plane of the disk. The more rapid rotation toward the center of the disk and the more modest rotation in the envelope together show that the accretion flow is spinning up as the gas spirals in toward the stars.
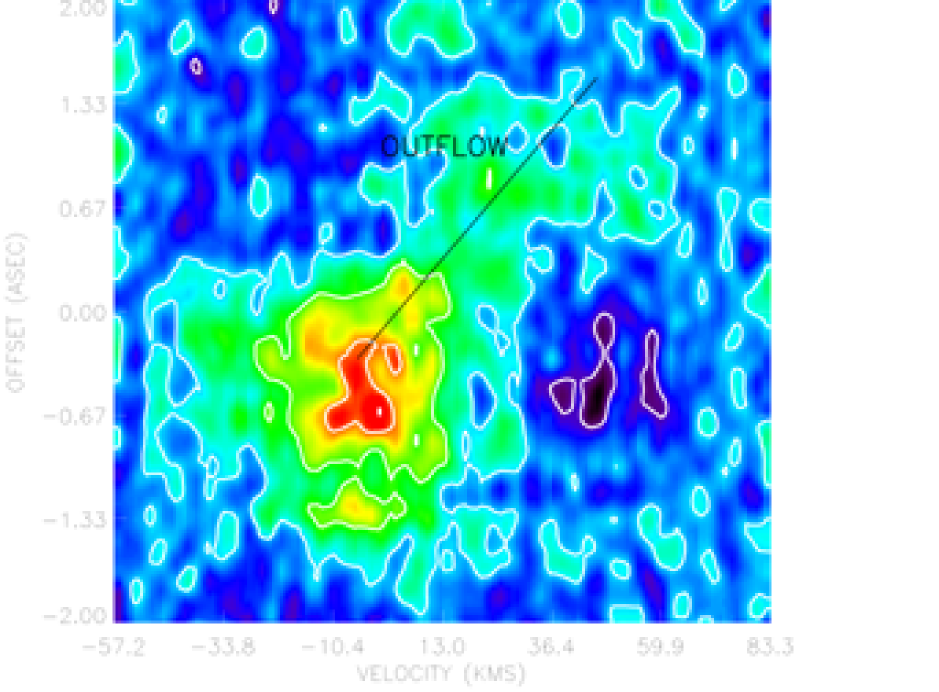
Figure 5 is a position-velocity diagram of the H66 emission along the axis of rotation through the middle of the ionized disk at the position marked by the dotted line in figure 2. A high velocity outflow of ionized gas is seen in figure 5 in the fainter emission extending northeast from the center of the disk, from a VLSR of near zero kms-1 to over 60 kms-1 where the recombination line emission falls below the sensitivity limit. Referring back to the map of continuum emission, figure 2, the northeast outflow appears bounded by two lines of continuum emission in a ”V” shape, previously identified in Sollins et al. (2005). There is a corresponding ”V”, of wider opening angle, extending to the southwest indicating a counter outflow. The opening angles of both outflows are wider than those of high velocity jets associated with individual high mass stars, and the outflow may be driven by the collective effects, stellar winds or individual jets, of the several massive stars in the central group. The gas density inside the outflow is quite low as indicated by the weakness of the continuum emission at the location of the outflow.
The lines in the high velocity outflows are narrower than in the center of the flow consistent with lower density gas in the outflow and a smaller velocity gradient. Figures 6 through 7 show the spectra of the H66 recombination line at three positions: the center of the flow at the intersection of the solid and dashed lines in figure 2 and at two positions 1′′ away from this intersection along the dashed line (rotation axis) to the northeast (figure 8) and southwest (figure 7). The breadth of the line kms-1 in the center of the disk is consistent with a combination of pressure broadening due to the high density of the gas in center of the disk (Keto et al. 1995) and high rotational velocities that are spatially unresolved.
3 A simple model of the accretion flow
The accretion flow onto G10.6–0.4 is quasi-spherical at larger distances ( pc) from the central group of stars where the flow is molecular and seen in absorption against the HII region (Keto 1990; Sollins et al. 2005). On the much smaller scale of a few thousand AU where the flow is ionized and seen in emission, the flow begins to flatten into an accretion disk. The extent of the bright ionized emission in the plane of the accretion disk is about 2′′ indicating a radius of about 5000 AU using the distance of 4.8 kpc derived by Fish et al. (2003). If G10.6–0.4 is at the further distance of 6 kpc derived by Downes et al. (1980), the scale would be a little larger and the derived mass below would be correspondingly greater. The infall and rotational velocities in the overlying molecular flow are similar at about 4.5 kms-1 and 2.5 kms-1 respectively (Keto 2002a), and the gas with these velocities must be outside of 5000 AU. The observed velocities in the ionized accretion flow are also similar and both kms-1, and the gas with these velocities must be inside of 5000 AU. The comparison of the molecular and ionized velocities indicates that the accretion flow spins up as it approaches the stars.
There is considerable uncertainty in pairing the gas velocity with a radius because the observations average the emission along the line sight through the source. Nevertheless, the separation of the flow into molecular and ionized regions provides a definite radius to work with. Second, there is uncertainty in the velocities themselves which are likely to be lower limits. The two velocity components are both derived from the difference of the velocity of the spectral lines line toward the center of the HII region or disk and toward the edge, and the blending along the line of sight reduces this difference. For example, in the case of the inflow velocity, because the flow is accelerating, the maximum velocity at the center of the HII region is blended with lower velocities from the overlying gas. Similarly, we never see the true tangential minimum velocity at the edge of the HII region because of blending with higher velocity overlying gas. Pressing on we may estimate the enclosed mass required to generate these velocities as where the total velocity is the quadrature sum of the components, . Calculating the mass using a radius of 5000 AU and the two velocity components of the ionized gas at 10 kms-1 each yields 1100 M⊙. Substituting the lower molecular velocities and assuming the same radius yields a mass of about 200 M⊙. The true enclosed mass may be between these limits. For definiteness we will suppose 300 M⊙ although the true mass could be higher. For reasonable gas densities, most of this mass must be in stars, and we assume that the mass is divided among some number, perhaps five, O stars.
A particularly simple model for an accretion flow that appears quasi-spherical at large distances and flattens to a disk at smaller radii is that of the gas orbiting on ballistic trajectories around a point mass (Ulrich 1976, Terebey, Shu & Cassen 1984). In this model for steady state accretion, the self-gravity and pressure of the gas are assumed negligible, the point mass at the center of the flow is constant, and the cloud has a specific angular momentum at infinity, , set equal to solid body rotation, which is then conserved on the flow trajectories. Where the trajectories would cross the mid-plane of the flow, the gas is assumed to collide with a similar flow from the other side of the plane so that the gas settles into a disk on the mid-plane. The model produces a reasonable approximation within the gravitational radius of the flow, , where the velocities are supersonic and the thermal pressure of the gas is negligible and away from the mid-plane where the densities in the model are formally infinite. The radius of disk formation, , where the centrifugal force equals the gravitational force, , divides the flow into an outer region where the inflow is quasi-spherical and an inner region where the flow is rotationally dominated. Figure 9 shows several trajectories of such a flow with the radius of disk formation, , in non-dimensional units at . The density in the flow, just off the mid-plane, is indicated by the color map at the base of the figure.
The observations of the accretion flow in G10.6–0.4 relate to this model as follows. The radiation of the stars is able to ionize the flow out to some distance. If the ionizing flux, the enclosed mass, and the density of the flow are such that the radius of ionization is within the sonic radius where the escape speed from the stars equals the sound speed, , of the ionized gas, , then the pressure of the ionized gas will be irrelevant to the dynamics of the flow (Keto 2002b). Thus although the molecular flow will become ionized at some radius , the increase in gas pressure due to the ionization will not significantly counter the gravitational attraction of the stars, and the accretion flow will transition from molecular to ionized while maintaining its continuity. In G10.6–0.4 because the molecular accretion flow is clumpy and does not have a smoothly increasing density gradient, the radius of ionization will be ragged and defined by the photo-ionized edges of clumps interspersed in lower density fully ionized gas. These edges appear as the photo-ionized arcs in figures 2 and 3. Where the molecular gas is most clumpy, the variations in the radius of ionization will be greatest. What is important for continuing accretion is that the inward flow, which may consist entirely of molecular clumps within low density ionized gas, must remain molecular until within the gravitational radius, , of the ionized gas. Despite the complexity imposed by the non-uniform density of the clumpy interstellar medium, we will continue the description of the model assuming a smooth density profile.
The simple scalings suggest that if the infall velocity is greater than the sound speed of the ionized gas, , the HII region, or more generally, the zone of ionization will be trapped within the accretion flow. Such trapping requires that the average (smooth) density gradient should decrease outward no faster than (Franco, Tenorio-Tagle, Bodenheimer 1990). This condition is generally satisfied by steady-state accretion models because the maximum infall velocity in steady state accretion is the free-fall velocity, . Conservation of mass then imposes a maximum limit on the density gradient of . Of course, if the density gradient is set by conditions other than the accretion flow, for example by the edge of the molecular cloud or the assumption of a particular density profile, for example that of a singular isothermal sphere, then the density gradient may be steeper, and in that case trapping is not possible. Notwithstanding, within the definition of the model of steady state accretion, if the radius of ionization is within the gravitational radius then trapping is inevitable.
As the accretion flow approaches the central mass, it will spin up and form a disk at the radius, defined above. Since , then if at the gravitational radius, , then the radius of disk formation will be within the maximum radius, , of a trapped HII region. Thus the radius of disk formation, depending on the flux of ionizing photons, could be within the ionized portion of the flow meaning that the accretion disk would be formed out of infalling ionized gas. Of course the accretion disk itself need not be fully ionized. Within the definitions of the model, the density of the accretion disk becomes arbitrarily high near the mid-plane, and therefore the center of the accretion disk may be neutral if the rate of recombination, which scales as the density squared, exceeds the rate of ionization. Nonetheless, the disk will be formed out of inward flowing ionized gas entirely within the ionized region of accretion flow.
In G10.6–0.4, the measured velocities within the ionized flow are kms-1, comparable to the sound speed of the ionized gas. Given the uncertainties in the velocities, it is possible that the conditions above that would result in a trapped HII region, , and an ionized accretion disk, , would apply. The observed morphology of the accretion flow with a quasi-spherical molecular flow at larger scales and an ionized accretion disk at smaller scales suggests that these conditions apply.
4 A numerical model for the ionization structure of the accretion flow
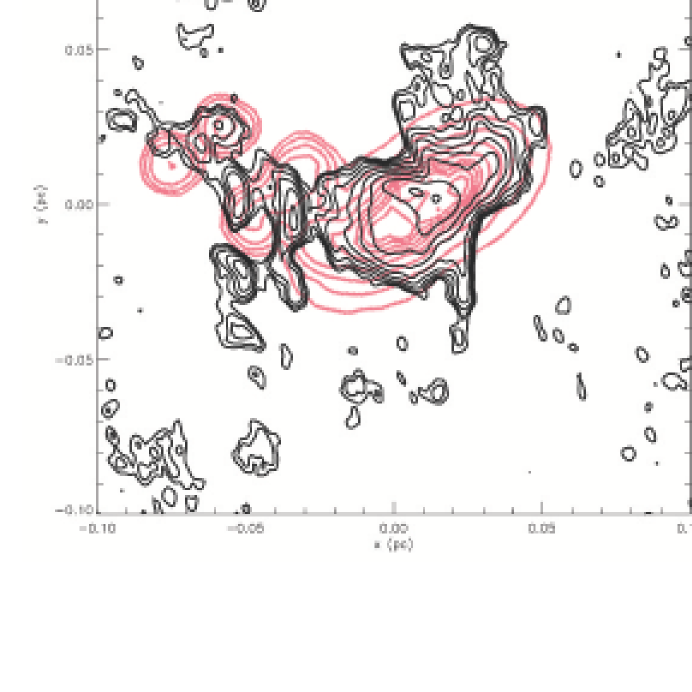
To illustrate the comparison between the theoretical and observed morphologies we show the results of a calculation of the structure of an accretion flow subject to a central source of ionizing radiation. Figure 10 shows the estimated 1.3 cm free-free emission from a model accretion flow with a TSC density profile with an accretion rate of M⊙ discretized onto a linear Cartesian grid AU on a side that is subject to an ionizing luminosity of s-1 in the continuum and a spectrum equivalent to a K, WM-basic model atmosphere from the library of Sternberg et al. (2003). (Because a TSC accretion flow is flattened due to rotation, the flow is concentrated in a smaller solid angle than a spherical flow. Thus a TSC flow has a lower accretion rate than a spherical flow with the same inward momentum, .) The ionization fraction and temperature of this model are calculated with a 3D Monte Carlo photoionization code (Wood, Mathis & Ercolano, 2004), and the observable free-free emission follows from the the free-free emissivity and opacity (Osterbrock 1989).
To further the comparison with the observations which show a clumpy rather than smooth density profile in the accretion flow, and to explore the effects of a clumpy accretion flow, we arbitrarily place around the flow six spherical high density clumps with radii of 2000 AU and uniform densities, to suggest the photoionized arcs in our observation, figure 3. An evacuated bipolar cavity is also included in the model as an approximation to the low density bipolar outflow seen in the observations. We expect that an outflow would appear along the rotation axis where the density gradient is steepest and where any excess pressure will find the easiest direction of breakout. But because the outflow must be due to forces not included in the infall model such as stellar winds or bipolar outflows from the individual stars, the outflow in our model is simply arbitarily imposed on the smooth TSC accretion flow.
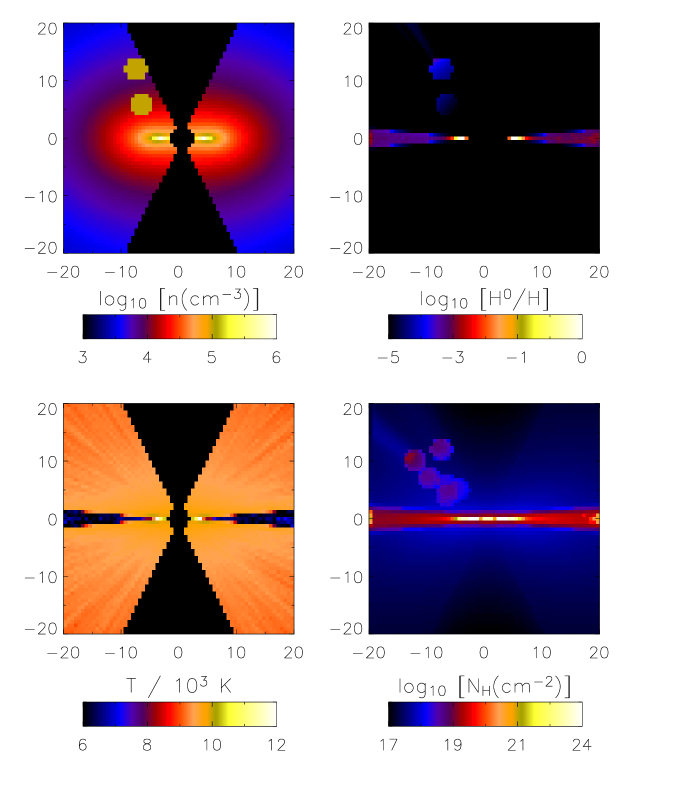
The calculation shows that the gas in the accretion flow is maintained in a highly ionized state, with the exception of the densest regions deep within the disk or torus where the recombination rate exceeds the rate of ionization. Figure 11 shows the density, and ionization structure and temperature on a one pixel wide slice through the model. Also shown is the column density of neutral gas. The model does not have the ionization front of a classical HII region, but because the free-free emission scales as the square of the density which falls off roughly as, but less steeply than, , the emission appears bounded. In the model there is continuum flux from the low density ionized gas surrounding the bright torus, but its level is below the detection limit of our observations. However, as discussed above, the differences between an accretion flow and a classical HII region can be discerned from the observations.
5 An estimate of the effect of radiation pressure on the accretion flow
Once we have described the accretion flow and have an estimate of the mass accretion rate and the inward velocity, we may compare the force deriving from the inward momentum of the accretion flow with the outward force deriving from the radiation pressure. The luminosity estimated from infrared emission is L⊙ (Fazio et al. 1978). The most naive estimate of the force deriving from this luminosity, assuming spherical geometry and the total absorption of the luminosity by the dust in the flow, would be dynes. A similarly simple estimate of the force deriving from the momentum of the accretion flow, assuming a spherical accretion rate of M⊙ yr-1 and velocity of 4.5 km s-1 at 5000 AU (Keto 2002b), would be, dynes. The similarity of the two estimates suggests that the inward momentum of the accretion flow is of the magnitude required to compete with the radiation pressure even in the absence of the mitigating effects of non-spherical geometry and a clumpy flow that are both indicated by the observed structure. Thus the observations of the accretion flow around G10.6–0.4 suggest that accretion may proceed despite the high luminosity L⊙ of the central stars.
6 The relation between photoionized accretion disks in trapped hypercompact HII regions, massive molecular accretion disks, and photoevaporating accretion disks
The observations of G10.6–0.4 suggest the model of disk formation out of fully ionized gas within a trapped HII region. The structure of this model accretion flow depends on the relative magnitudes of a few parameters. In particular, the extent of the ionization depends on the radiative flux of the stars and the density of the surrounding gas. The dynamics of the accretion flow depend primarily on the mass of the stars and the initial angular momentum of the surrounding gas. Because the extent of the ionization and the dynamics of the accretion depend on different parameters, it is possible to imagine that different combinations of parameters will result in accretion flows with different structures.
For example, the structure in G10.6–0.4 with an accretion disk formed out of ionized gas within the trapped HII region requires that or more specifically that . Suppose that the initial conditions that led to this flow instead included a higher angular momentum or lower ionizing flux so that . In this case, our model accretion flow would form a disk in the molecular portion of the flow. If in addition, the extent of the ionization were within the sonic radius, , there would be a small trapped HII region at the center of the flow. If the HII region were small and dense, as would be implied by its trapped condition, and perhaps optically thick, the observed continuum flux would be very low. This may be the appropriate model for those sources where a massive molecular accretion disk or torus is inferred from observations of a high mass proto-stellar candidate with no observed continuum emission or weak continuum emission from a hypercompact HII region (Zhang et al. 2002; Sandell et al. 2003; Olmi et al. 2003; Beltran et al. 2004; Chini et al. 2004).
We may consider the evolution of this alternate model accretion flow with a massive molecular rather than ionized disk. In Keto (2003) the following evolutionary scenario was proposed for trapped HII regions in a purely spherical accretion flow. We will review this spherical model and then apply the concepts to a model accretion flow with rotation and a disk.
The evolution in the spherical model takes place in three stages and the accretion flow passes through the three stages as the central star or stars gain mass and their temperatures and therefore their ionizing fluxes increase with their increasing masses. In the first stage when the ionizing flux is very low, the HII region may be quenched (non-existent) if the flux of neutral hydrogen atoms or molecules exceeds the flux of ionizing photons. In this case the HII region will not extend beyond the boundary of the star. This is the model discussed in Walmsley (1995). As the star or stars gain mass as a result of the continuing accretion, the flux of ionizing photons will increase eventually exceeding the flux of neutral hydrogen. At this point, provided that the density gradient of the accretion flow does not exceed the limit inherent in models of steady state accretion, , a trapped HII region will develop around the star. This is the second stage of evolution. As long as the limiting density gradient is not exceeded, trapping is inevitable in this model and requires no fine tuning of the parameters. As the star or stars continue to gain mass by accreting matter through the trapped hypercompact HII region, the temperatures and ionizing fluxes of the stars will further increase. Correspondingly, the size of the trapped HII will grow, not by pressure driven expansion, but simply owing to the increase in the ionizing flux. At some point, the size of the HII region will exceed the sonic radius where the escape velocity equals the sound speed of the ionized gas. In Keto (2002b) it was shown that at this point, the HII will begin hydrodynamic expansion and transition rapidly to the classical model described by pressure driven expansion (Spitzer 1978; Dyson & Williams 1980; Shu 1992). This is the third and final stage of evolution.
Let us consider what would happen in this evolutionary scenario if the accretion flow included high rotation and a massive molecular disk. In the initial stage when there is no HII region, then necessarily and the flow is described simply by the massive molecular accretion disk. In the second stage, a trapped hypercompact HII region will develop in the center of the disk. Because the gas in the disk is denser than the gas elsewhere around the star, the molecular accretion disk will not necessarily be fully ionized, but because , the ionized surface of the disk will not be expanding off the disk. Rather there will be a limited region, contained within the HII region, with an ionized accretion flow onto the disk. However, depending on the initial angular momentum in the flow, this region may be a very small with respect to the extent of the molecular disk. Outside this region, there will be a molecular accretion flow onto the disk. The third stage of evolution is defined by the condition, . In the non-spherical case, because the gas density around the star is a function of angle off the disk, the extent of ionization, will also be a function of angle. If the disk is reasonably sharply defined as in the Ulrich and TSC models, then in the third stage the HII region will expand around the disk. In this third stage, because , the surface of the disk, with the exception of the small region in the center, will be photo-evaporating with an outward flow of ionized gas off the disk as described in the models for photo-evaporating disks of Hollenbach et al. (1994), Johnstone et al. (1998), Lugo, Lizano & Garay (2004).
This discussion shows how a consideration of the simple accretion model of Ulrich (1976) or TSC that is subject to different degrees of ionization can unify the concepts of the quenched HII region of Walmsley (1995), the trapped hypercompact HII regions of Keto (2002b, 2003) and the photo-evaporating disks of Hollenbach et al. (1994) and Johnstone et al. (1998). In addition the three models are linked in an evolutionary sequence. All three of these models will prolong the time scale for accretion onto massive stars, and the latter two prolong the lifetimes of the hypercompact HII regions around the stars.
In the discussion above, the models assume a smooth accretion flow so that the ionized zone or HII region has a definite radius. The same theoretical considerations discussed above also apply to a clumpy accretion flow if one substitutes for the smooth ionization boundary, the radius at which the molecular clumps are ionized as they move toward the stars. Since this radius depends on the density within each clump, there may be a different radius of ionization for each clump. But on average there will be some characteristic radius that differentiates the ionized and molecular zones. In the case of a clumpy flow, this radius is the radius of ionization. If the gas between the clumps is ionized as is suggested by the observations of G10.6–0.4, then that gas may move outward or inward depending on whether it is outside or inside the gravitational radius, . As long as the density remains low, this gas will not have a strong dynamical influence on the clumpy, molecular accretion flow. The structure implied by this discussion of molecular clumps within a low density ionized flow has been described in some previous studies which we mention briefly in the section below.
7 Relevance of the observations to other models of ultracompact HII regions
The appearance of the photo-ionized arcs seen in figures 2 and 3 is similar to that expected for the evaporating or ablating clumps described in models of expanding HII regions proposed by Dyson, Williams & Redman (1995), Redman, Williams, & Dyson (1996), and Lizano et al. (1996). A significant difference between the HII region proposed in these models and the one observed in G10.6–0.4 is that on the scale of our observations, the ionized gas in G10.6–0.4 is flowing inward as an accretion flow toward the stars and not expanding outward as in the models. However, if the low density ionized gas in G10.6–0.4 extends to a scale beyond the gravitational radius (5000 AU), as indicated in lower angular resolution observations (Keto 2002a), while the molecular flow remains clumpy, then one could imagine that on this larger scale, low density outflowing ionized gas might stream around molecular clumps similar to the description of these models. This picture corresponds more closely to the model for subsonic outflow in Redman, Williams & Dyson (1996) rather than the models for supersonic wind-driven outflows in the other two references.
8 Considerations for the formation of early type O stars
As a point of speculation, let us consider the conditions required for early type O stars, those with masses above about 50 M⊙ where the requirements are most severe. The introduction discussed how massive accretion flows with high momentum were required to overcome the three problems of radiation pressure, thermal pressure, and the short main sequence life times of massive stars.
Accretion flows with low angular momentum, or more precisely low rotational velocities relative to infall velocities may be required to form early O stars. The reason is that once the accretion flow settles into a rotationally supported disk, the accretion rate may be reduced if accretion through the disk is moderated by some type of viscosity as is suspected for low mass stars. Of course, the stellar radii are so small compared to the accretion flow that if angular momentum is conserved, the flow must end up rotationally supported for almost any initial angular momentum no matter how low. However, the radius of the star may not be the important radius. First, in order to overcome radiation pressure, the accretion flow must have an initial angular momentum that is only low enough that the spin-up through conservation of angular momentum does not significantly reduce the inward momentum down to the radius of dust destruction. This radius is typically a few hundred AU as estimated by simple radiative energy balance (e.g. Scoville & Kwan 1976). Secondly, the spin-up itself might be reduced within the radius of ionization which could be, as in G10.6–0.4, at a distance of a few thousand AU. Once the flow is ionized, the gas may couple strongly onto any magnetic fields that may facilitate the outward transport of angular momentum and maintain a high rate of inflow to smaller radii. One might speculate whether the ionization surrounding massive stars helps rather than hinders the growth of massive stars by accretion.
9 Conclusions on star formation by accretion
The new observations of G10.6–0.4 show that the detailed structure of the accretion flow exemplifies several of the factors thought to be important in mitigating the three limiting factors, radiation pressure, thermal pressure, and the short main sequence lifetime of high mass stars.
The observations of G10.6–0.4 show that the force deriving from the inward momentum of the accretion flow, dynes, for M⊙ yr-1 and velocity of km s-1 is of the magnitude to compete with the outward force of the radiation pressure, dynes, deriving from the high luminosity L⊙ of the central stars. Furthermore, the non-spherical geometry and clumpy structure observed in the accretion flow should reduce the effective radiation pressure below the simple estimate above.
The observations of G10.6–0.4 show infall directly through the HII region despite the thermal pressure of the hot ionized gas. The simple model for the accretion flow indicates that the zone of ionization of the denser gas is within the gravitational radius of 5000 AU of the combined mass of the stars. Thus the gravitational attraction is sufficient to counter the thermal pressure of the hot ionized gas, and the ionized gas as well as the molecular gas (indicated in these observations by the photoionized arcs) will be moving inward as parts of the accretion flow.
The luminosity of G10.6–0.4 indicates the presence of several O stars (Sollins et al. 2005) that must either have formed in a timescale shorter than their main sequence lifetime or with an accretion rate high enough to delay their main sequence evolution. The observations indicate a mass accretion rate of about M⊙ yr-1 (Keto2002a) on the order of that required to maintain O stars on the main sequence as indicated by the timescales in figure 1.
Thus the new observations of G10.6–0.4 indicate that high mass stars can form by accretion and indicate how the accretion flow is able to continue even after the stars have become massive B and O stars. Only the most massive accretion flows have sufficient momentum to counter the radiation pressure of massive stars, the high densities to prevent the ionization of the molecular flow at distances beyond the gravitational radius, , and the mass accretion rate to keep the high mass stars from evolving off the main sequence.
A simple model of accretion on ballistic trajectories (Ulrich 1976, TSC) with the inclusion of a central ionizing source suggests a unifying paradigm within an evolutionary sequence for the individual models of quenched HII regions (Walmsley 1995), trapped HII regions (Keto 2002b, 2003), and photo-evaporating disks (Hollenbach et al. 1992; Johnstone et al. 1998).
10 Acknowledgements
K.W. is funded by a UK PPARC Advanced Fellowship.
References
- Beech & Mitalas (1994) Beech, M., & Mitalas, R., 1994, ApJ Suppl., 95, 517
- Behrend & Maeder (2001) Behrend, A. & Maeder, A., 2001, AA, 373, 190
- Bernasconi & Maeder (1996) Bernasconi, P. & Maeder, A., 1996, AA, 307, 839
- Beltran et al. (2004) Beltr’an, M. T., Cesaroni, R., Neri, R., Codella, C., Furuya, R. S., Testi, L. & Olmi, L. 2004, ApJ, 601, L187
- Beuther et al. (2002) Beuther, H., Schilke, P., Sridharan T., Menten, K., Walmsley, M., Wyrowski, F., 2002, AA, 383, 892
- Calvet et al. (2004) Calvet, N., Muzzerole, J., Briceno, C., Hernandez, J., Hartmann, L., Salcedo, J., Gordon, K., 2004, AJ, 128, 1294
- Churchwell (1998) Churchwell, E., 1998, in The Origin of Stars and Planetary Systems, ed. C. Lada & N. Kylafis, NATO Science Serieis 540 (Kluwer)
- Chieffi, Staniero & Salaris (1995) Chieffi, A., Staniero, O., & Salaris, M., 1995, ApJ, 445, L39
- Chini et al. (2004) Chini, R., Hoffmeister, V., Kimeswenger, S., Nielbock, M., Nurnberger, D., Schmidtobreick, L. & Sterzik, M., 2004, Nature, 429, 155
- Downes et al. (1980) Downes, D., Wilson, T., Beiging, J., Wink, J., 1980, AAS, 40, 379
- Dyson & Williams (1980) Dyson, J. & Williams, D., 1980, The Physics of the Interstellar Medium (New York:Wiley)
- Dyson, Williams & Redman (1995) Dyson, J., Williams, R. & Redman, M., 1995, 227, 700
- Fazio et al. (1978) Fazio, G., Lada, C., Kleinmann, D., Wright, E., Ho, P., Low, F., 1978, ApJ, 221, L77
- Fish et al. (2003) Fish, V., Reid, M., Wilner, D., Churchwell, E., 2003, ApJ, 587, 701
- Franco, Tenorio-Tagle & Bodenheimer (1990) Franco, J., Tenorio-Tagle, G., Bodenheimer, P., 1990, ApJ, 349, 126
- Henning et al. (2000) Henning, T., Schreyer, K., Launhardt, R., Burkert, A., AA, 2000, 353, 211
- Ho & Haschick (1986) Ho, P., & Haschick, A., 1986, ApJ, 304, 501
- Hollenbach et al. (1994) Hollenbach, D., Johnstone, D., Lizano, S., Shu, F., 1994, ApJ, 428, 654
- Johnstone, Hollenbach, & Bally (1998) Johnstone, D., Hollenbach, D., & Bally, J., 1998, ApJ, 499, 758
- Iben (1965) Iben, I., 1965, ApJ, 141, 993
- Jijina & Adams (1996) Jijina, J. & Adams, F., 1996, ApJ, 462, 874
- Hofner et al. (1996) Hofner, P., Kurtz, S., Churchwell, E., Walmsley, C. & Cesaroni, R., 1996, ApJ, 460, 359
- Kahn (1974) Kahn, F., 1974, AA, 37, 149
- Keto et al. (1987) Keto, E., Ho. P., Haschick, A., 1987, 318, 712
- Keto et al. (1988) Keto, E., Ho. P., Haschick, A., 1988, 324, 920
- Keto (1990) Keto, E., 1990, ApJ, 355, 190
- Keto et al. (1995) Keto, E., Welch, W., Reid, M., Ho, P., 1995, ApJ, 444, 765
- Keto (2002a) Keto, E., 2002a, ApJ, 568, 754
- Keto (2002b) Keto, E., 2002b, ApJ, 580, 980
- Keto (2003) Keto, E., 2003, ApJ, 599, 1196
- Kumar et al. (2003) Kumar, M., Fernandez, A., Hunter, T., Davis, C., Kurtz, S., 2003, AA, 412, 175
- Kumar et al. (2002) Kumar, M., Bachiller, R., Davis, C., ApJ, 576, 313
- Larson & Starrfield (1971) Larson, R., & Starrfield, S., 1971, AA, 13, 190
- Lizano et al. (1996) Lizano, S., Canto, J., Garay, G., Hollenbach, D., 1996, ApJ, 465, 216
- Lugo, Lizano & Garay (2004) Lugo, J., Lizano, S., Garay, G., 2004, ApJ, 614, 807
- Mermilliod & Garcia (2001) Mermilliod, J. & Garcia, B., 2001, in The Formation of Binary Stars, IAU Symp. 200, eds. H. Zinnecker & R. Mathieu
- Nakano (1989) Nakano, T., 1989, ApJ, 345, 464
- Nakano, Hasagawa & Norman (1995) Nakano, T., Hasagawa, T., Norman, C., 1995, ApJ, 450, 183
- Norberg & Maeder (2000) Norberg, P. & Maeder, A., 2000, AA, 359, 1025
- Okamoto et al. (2003) Okamoto, Y., Kataza, H., Yamashita, T., Miyata, T., Sako, Takubo, S., Honda, M., Onaka, T., 2003, ApJ, 584, 368
- Olmi et al. (2003) Olmi, L., Cesaroni, R., Hofner, P., Kurtz, S., Churchwell, E., Walmsley, C., 2003, AA, 407, 225
- Osterbrock (1989) Osterbrock, D., 1989, Astrophysics of Gaseous Nebulae and Active Galactic Nuclei, University Science Books, Mill Valley, CA
- Palla & Stahler (1993) Palla, F., & Stahler, S., 1993, ApJ, 418, 414
- Prebisch et al. (2001) Prebisch, T., Hofmann, K., Schertl, D., Weigelt, G., Balega, Y. Balega, I., & Zinnecker, H., 2001, in IAU Symp 200. The Formation of Binary Stars, ed Zinnecker, H. & Mathieu, R., (SanFrancisco: ASP), 106
- Redman, Williams & Dyson (1996) Redman, M., Williams, R., & Dyson, J., 1996, 280, 661
- Sandell et al. (2003) Sandell, G., Wright, M., Forster, J., 2003, ApJ, 590, 45
- Scoville & Kwan (1976) Scoville, N. & Kwan, J., 1976, ApJ, 206, 718
- Shepherd & Churchwell (1996) Shepherd, D. & Churchwell, E., 1996, ApJ, 472, 225
- Shu (1990) Shu, F., 1992, The Physics of Astrophysics, Volume II, Gas Dynamics, University Science Books, Mill Valley, CA
- Sollins et al. (2005) Sollins, P., Zhang, Q., Keto, E., Ho, P., 2005, ApJ, 624, L49
- Spitzer (1978) Spitzer, L., Jr., 1978, Physical Processes in the Interstellar Medium, (New York:Wiley)
- Stahler, Shu & Taam (1980) Stahler, S., Shu, F., Taam, R., 1980, ApJ, 241, 637
- Stahler, Shu & Taam (1981a) Stahler, S., Shu, F., Taam, R., 1981, ApJ, 242, 226
- Stahler, Shu & Taam (1981b) Stahler, S., Shu, F., Taam, R., 1980a, ApJ, 248, 727
- Sternberg et al. (2003) Sternber, A., Hoffmann, T., & Pauldrach, A., 2003, ApJ, 599, 1333
- Terebey, Shu & Cassen, P. (1984) Terebey, S., Shu, F., Cassen, P., 1984 ApJ, 286, 529
- Testi et al. (2000) Testi, L., Hofner, P., Kurtz, S., & Rupen, M., 2000, AA, 359, L5
- Ulrich (1976) Ulrich, R., 1976, ApJ, 210, 377
- van der Tak & Menten (2005) van der Tak, F. & Menten, K., 2005, AA, 437, 947
- Walmsley (1995) Walmsley, M., 1995, Revista Mexicana de Astronomia y Astrofisica Serie de Conferencias, Vol. 1, Circumstellar Disks, Outflows and Star Formation, Cozumel, Mexico, Nov 28-Dec 2, 1994, p. 137
- Wolfire & Cassinelli (1987) Wolfire, M. & Cassinelli., 1987, ApJ, 319, 850
- Wood, Mathis & Ercolano (2004) Wood, K., Mathis, J., Ercolano, B., 2004, MNRAS, 348, 1337
- Yorke & Krugel (1977) Yorke, H., & Krugel, E., 1977, AA, 54, 183
- Young, Keto & Ho (1988) Young, L., Keto, E., & Ho, P., 1998, ApJ507, 270
- Zhang et al. (1998) Zhang, Q., Hunter, T., Sridharan, T., 1998, ApJ, 505, 151
- Zhang et al. (2002) Zhang, Q., Hunter, T., Sridharan, T., Ho, P., 2002, ApJ, 566, 982